A monitoring solution for Osmosis full nodes with Prometheus, Grafana, cAdvisor, NodeExporter and alerting with AlertManager.
- Docker Engine >= 1.13
sudo apt-get remove docker docker-engine docker.io
sudo apt-get update
sudo apt install docker.io -y
- Docker Compose >= 1.11
sudo apt install docker-compose -y
- Osmosis full node running
- See https://get.osmosis.zone or https://docs.osmosis.zone/developing/cli/install.html to install the Osmosis binary
- Set
prometheus = trueunder instrumentation in the config.toml - Set
enable = trueandprometheus-retention-time = 1under telemetry in the app.toml
- Ensure the following ports are not in use
- 3000
- 9100
- 9092
- 8001
Set your public IP as an environment variable
export HOST_IP=$(dig +short txt ch whoami.cloudflare @1.0.0.1)
Clone this repository on your Docker host, cd into test directory and run docker-compose up
git clone https://github.com/czarcas7ic/Osmosis-Grafana-Prometheus-Docker.git
cd Osmosis-Grafana-Prometheus-Docker
docker-compose up -d
This command will create the following containers
- Grafana (visualize metrics)
http://<host-ip>:3000 - Prometheus (metrics database)
http://<host-ip>:9092 - Prometheus-Pushgateway (push acceptor for ephemeral and batch jobs)
http://<host-ip>:9091 - NodeExporter (host metrics collector)
- cAdvisor (containers metrics collector)
Once you have run docker-compose (and Osmosis has caught up to the head of the chain), simply go to http://<host-ip>:3000, login with admin and admin as the username and password, set your new password, and go to the dashboards tab (the icon that looks like four squares). Select browse and then select the Osmosis Dashboard.
The dashboard can also be reached directly at http://<host-ip>:3000/d/UJyurCTWz/osmosis-dashboard
To shut down all of the above docker containers but retain the data
docker-compose down
To shut down and delete all metrics collected
docker-compose down --volumes
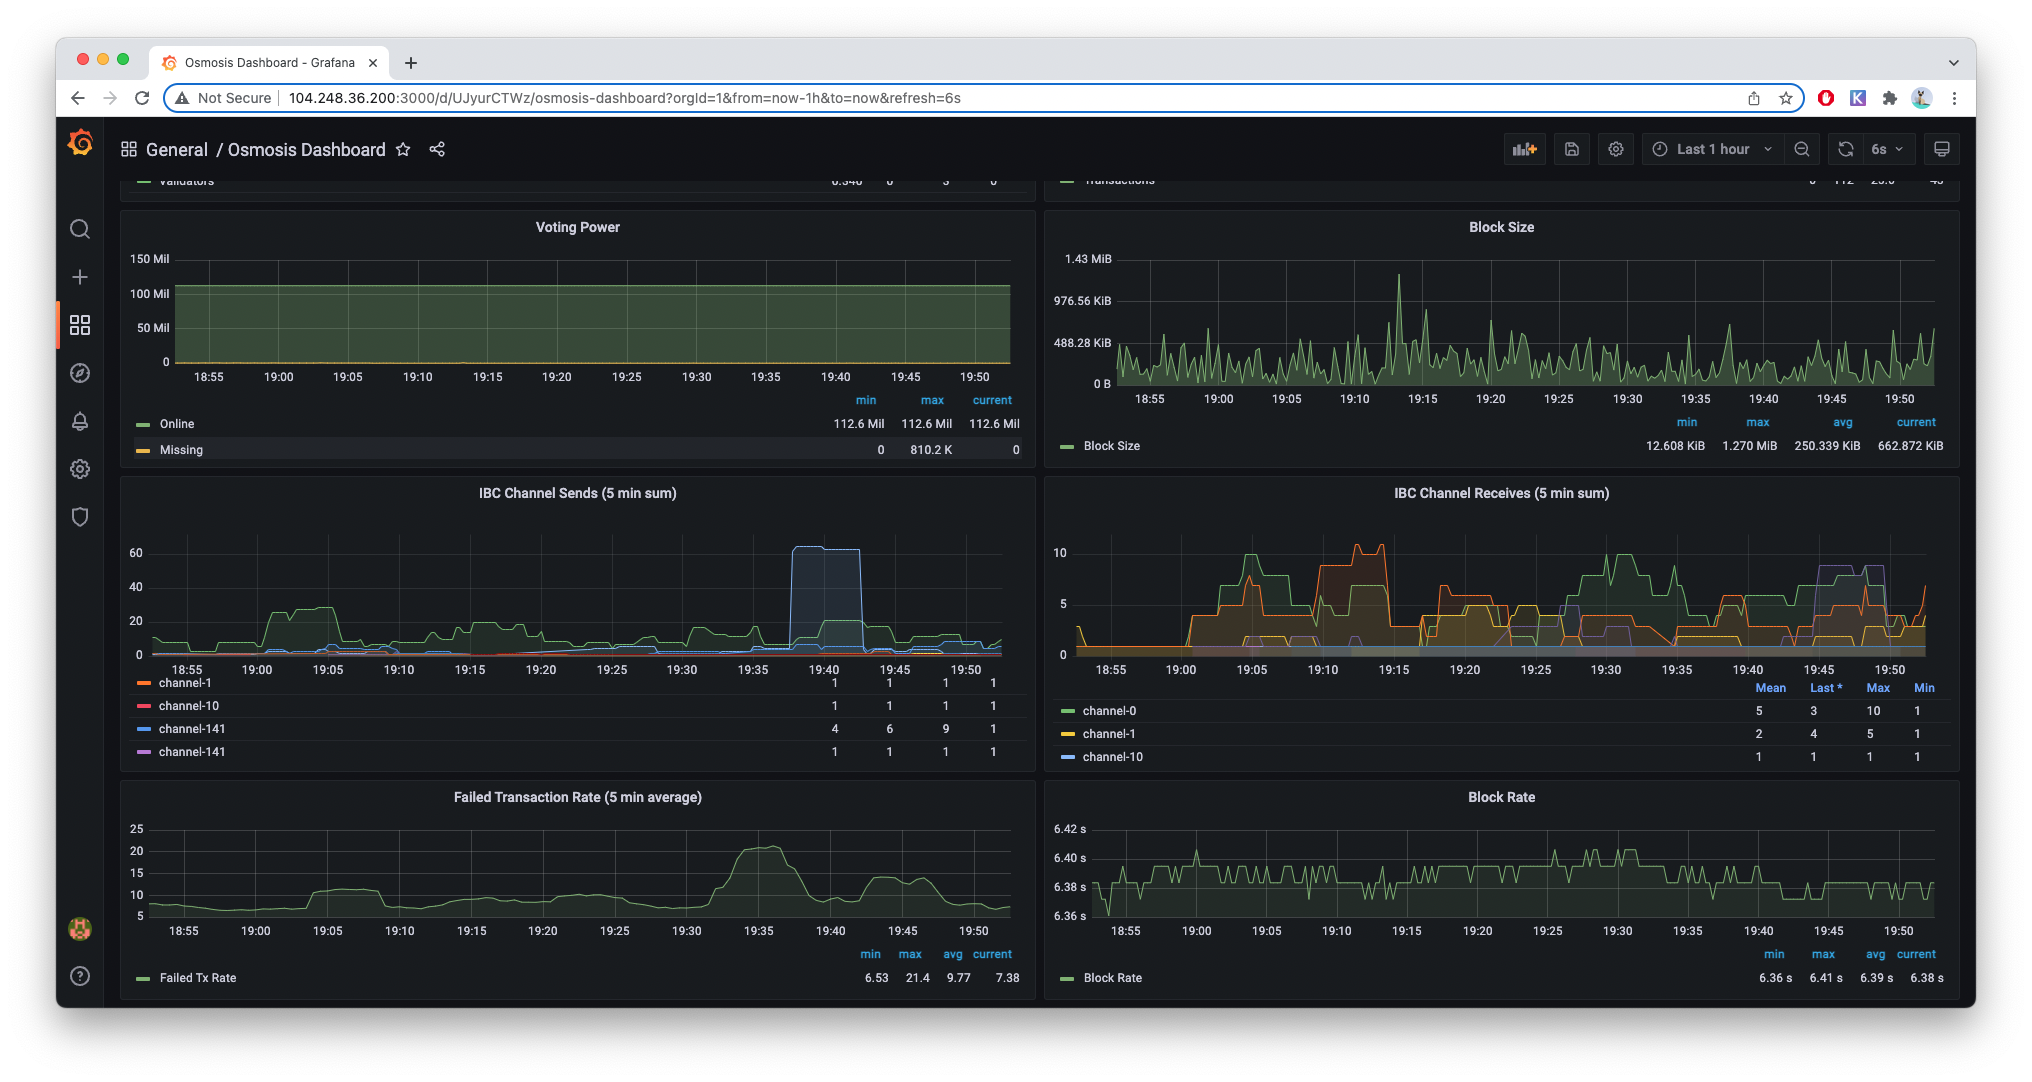
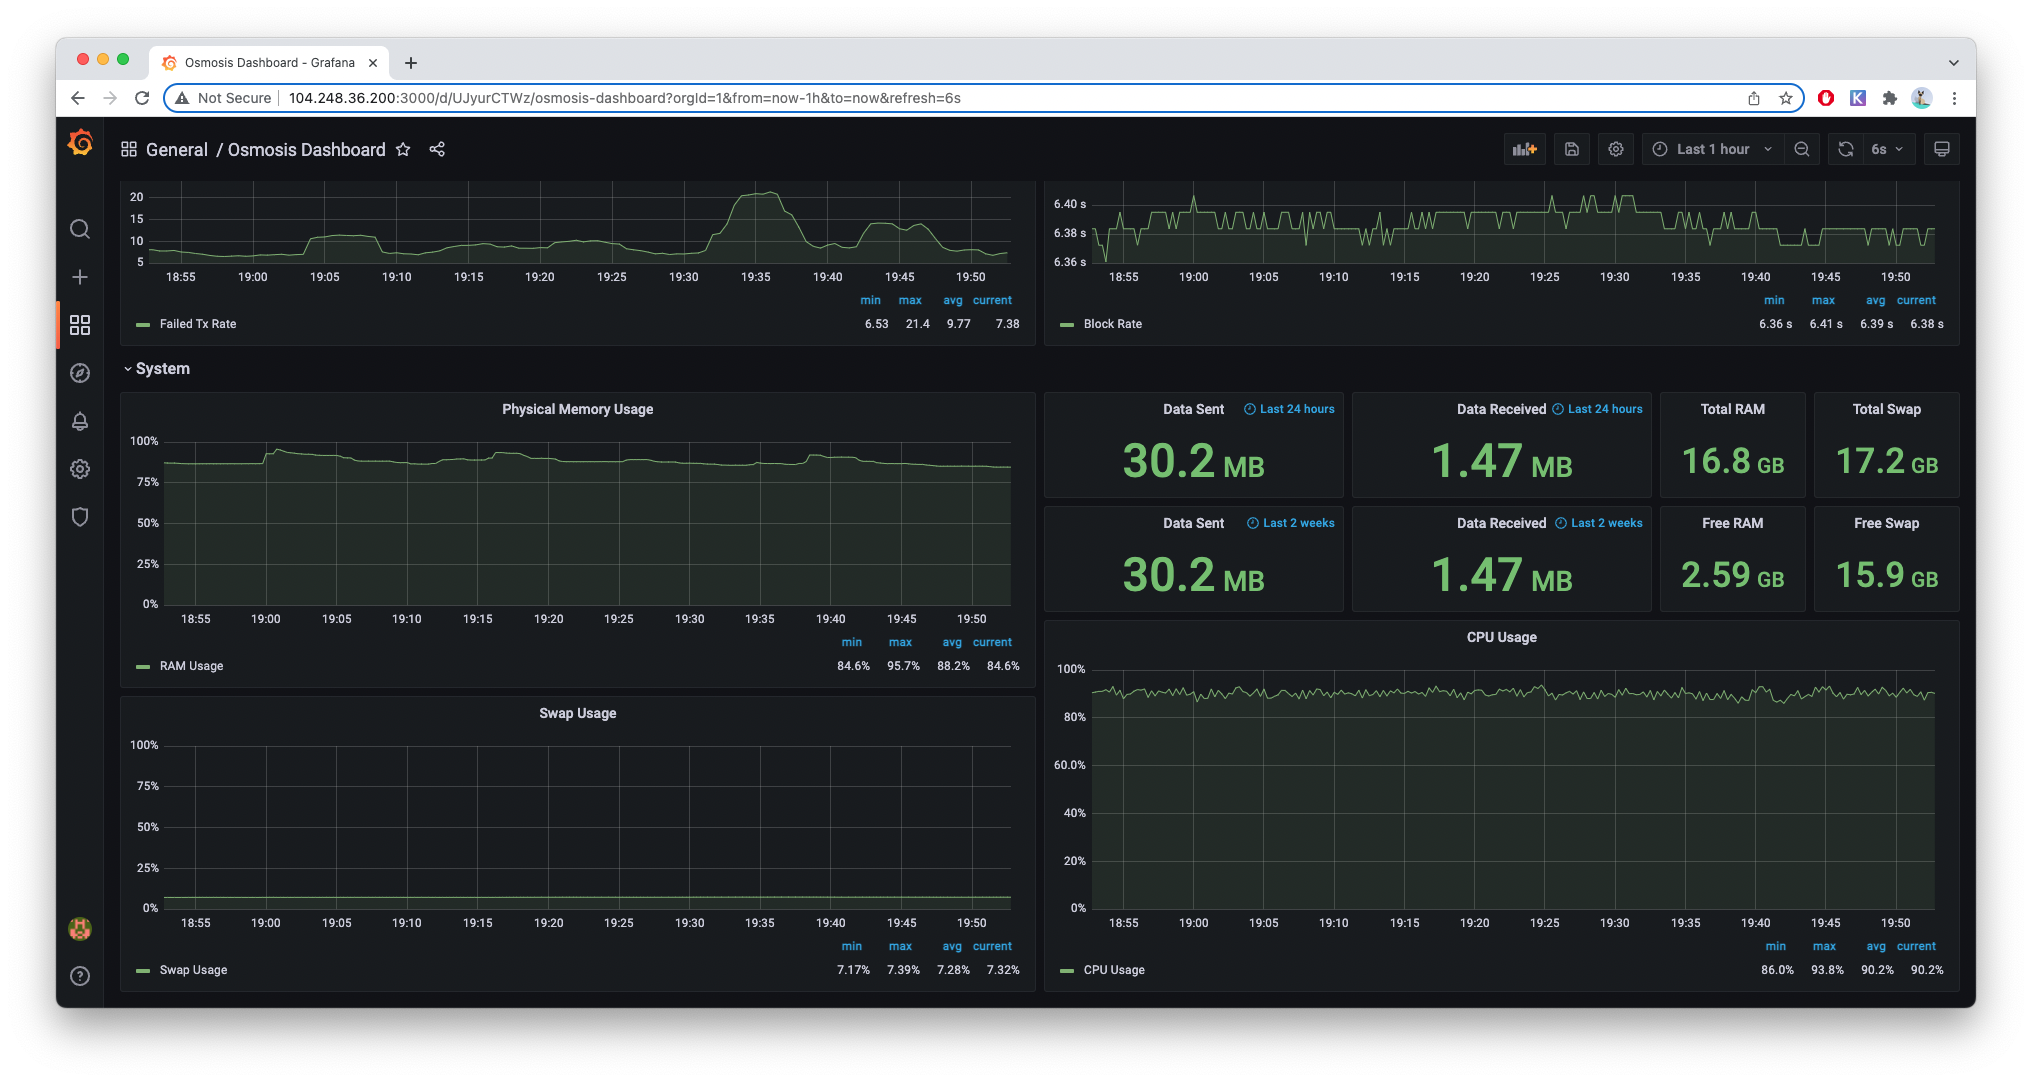
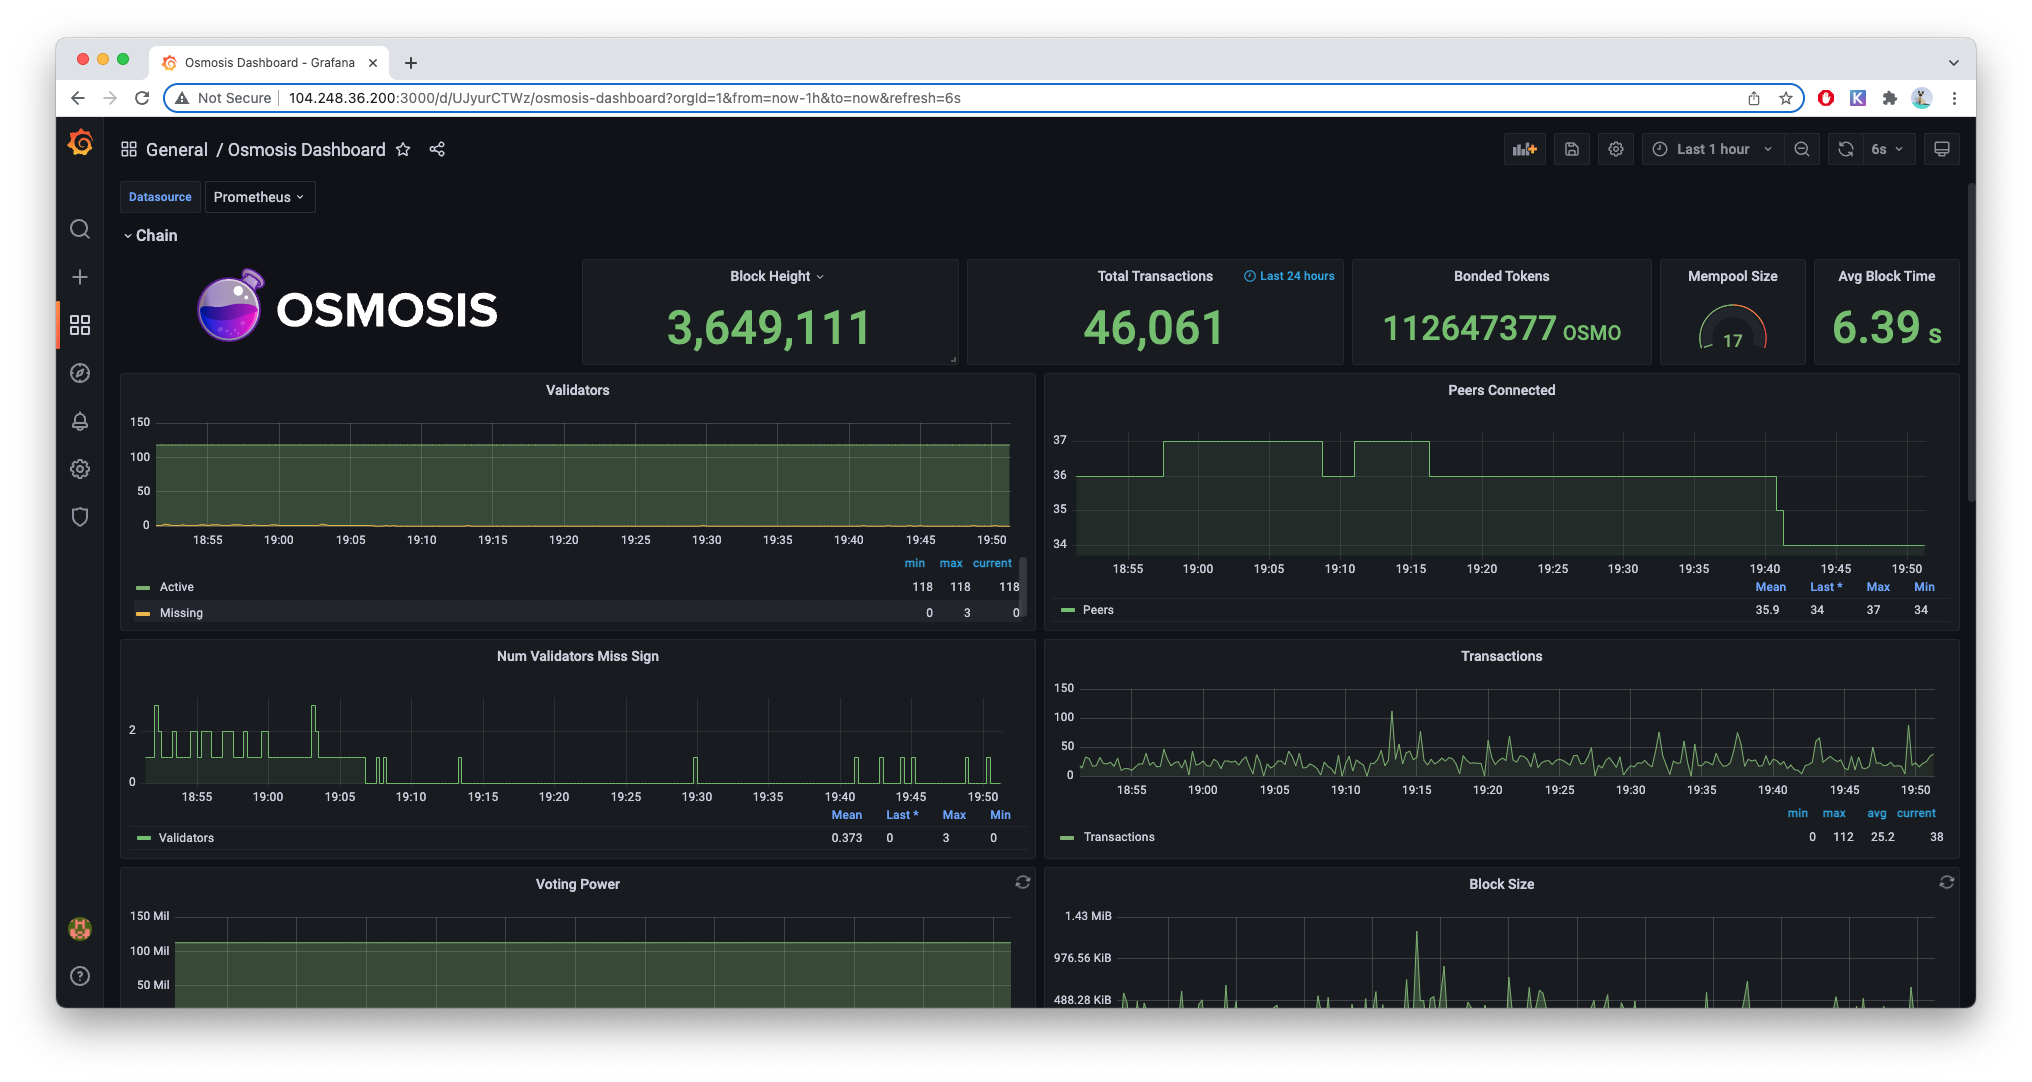
The Osmosis Dashboard shows key metrics for monitoring the chain state as well as machine resource usage: