QGIS toolbox to extract swath profiles. After Swath Profiles are calculated, it will show a graphic window with the output swaths. It also calculates THI* index (see Pérez-Peña et al., 2016).
To install the toolbox, copy the SwathProfiler.py and SwathProfiler.py.help files in the script folder:
- Users/user_name/.qgis2/processing/scripts [MAC] (Hidden folder)
- C:\Users\user_name.qgis2/processing/scripts [Windows]
Alternatively you can use the "Add script from file" tool located in the Processing Toolbox > Scripts > Tools. (With this method will not include the help file).
Just launch the Toolbox and fill the required parameters:
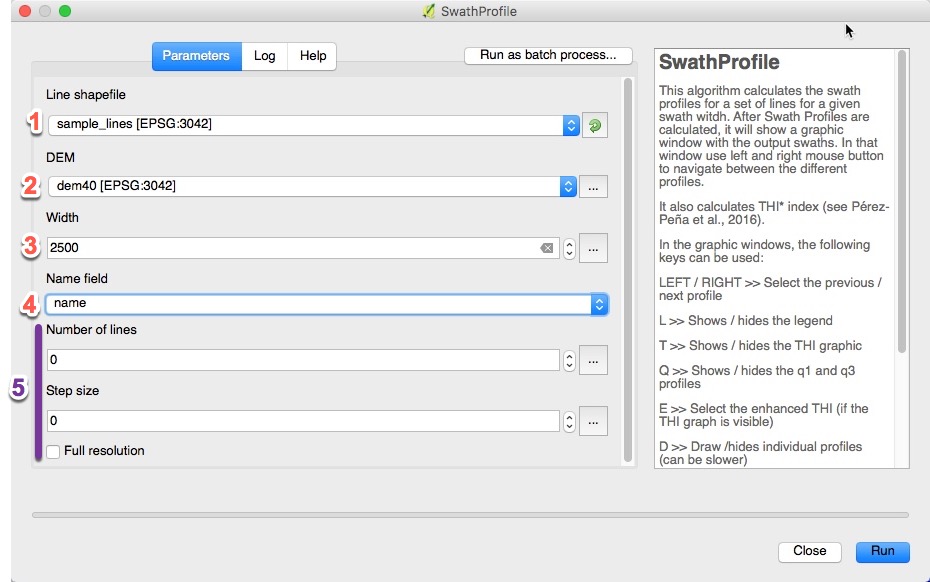
- Polyline shapefile with the swath base lines
- Digital Elevation Model
- Half with of the Swath. It would take this widht at both sides of each base line
- Name Field in the shapefile to take profile labels
- Optional parameters (normally don't need to change)
- Number of lines: Number of lines to analyze at each side of the profile. If leave 0, it will calculate 50 profiles at both sides of each base line.
- Step size: Step size to take elevations along each elevation profile. If leave 0, it will take the DEM resolution.
- Full resolution: If checked, ignore previous values of Number of lines and Step size to take the maximum resolution; Number of lines = (width / DEM resolution) and Step size = DEM Resolution. This take much longer and does not provide almost improvement, but could be usefull in some cases 😳
Once the tool have processed all the basins, it will show a graphic window with the swath profiles.
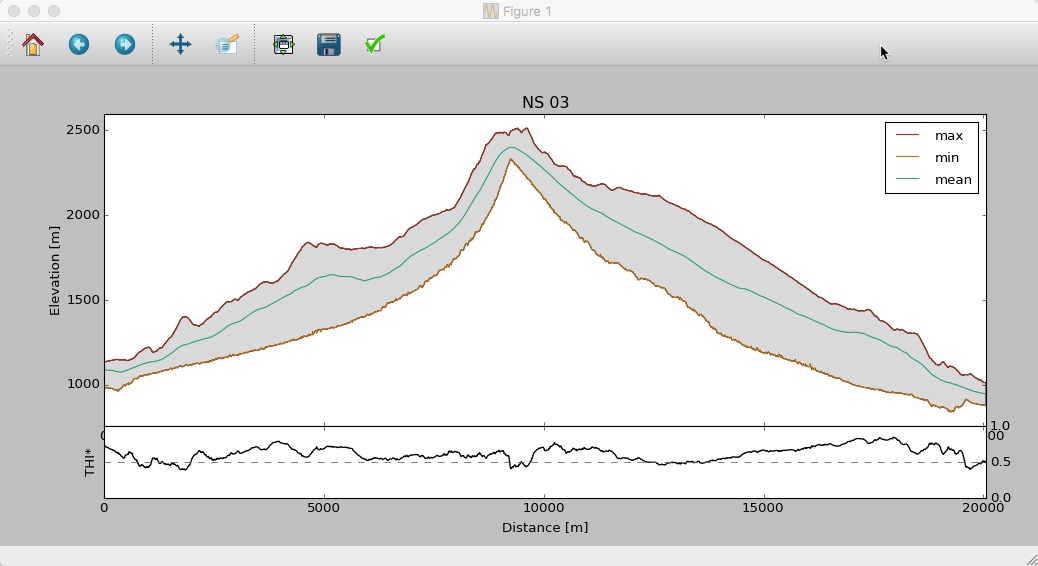
In this graphic window you can use the following keys:
- LEFT / RIGHT : Navigates throught the different Swath Profiles
- Q : Shows/hides the Q1 (percentile 25) and Q3 (percentile 75) lines
- T : Shows/hides the Transverse Hipsometric Integral (THI). See Pérez-Peña et al., 2016 for details.
- E : Shows/hides the enhanced Transverse Hipsometric Integral (THI*). See Pérez-Peña et al., 2016 for details.
- L : Shows/hides the legend
- D : Shows/hides all the profile data. It can slow down the rendering if a high number of lines (or Full resolution) was selected
- B : Shows/hides a gray background between max and min profiles
Pérez-Peña, J.V., Al-Awabdeh, M., Azañón, J.M., Galve, J.P., Booth-Rea, G., Notti, D., 2017. SwathProfiler and NProfiler: Two new ArcGIS Add-ins for the automatic extraction of swath and normalized river profiles. Computers & Geosciences 104, 135-150. doi:10.1016/j.cageo.2016.08.008