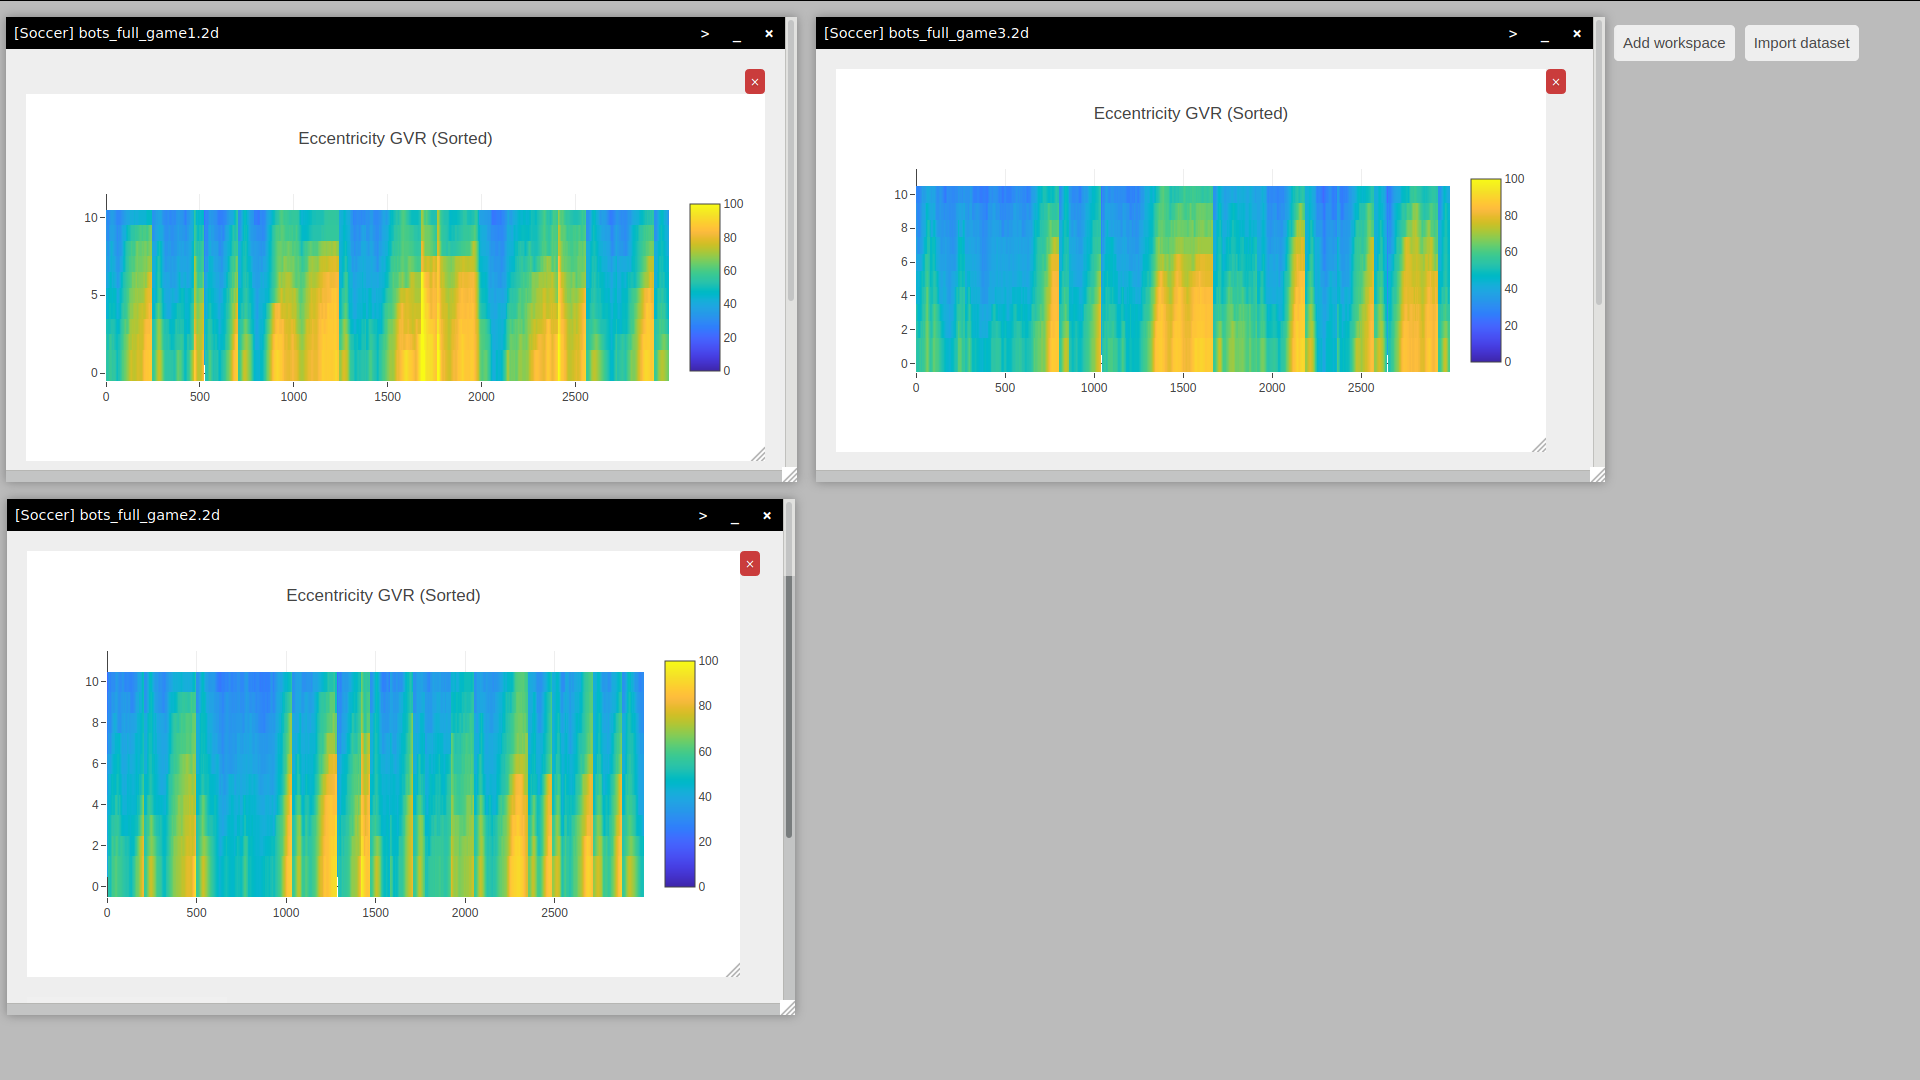
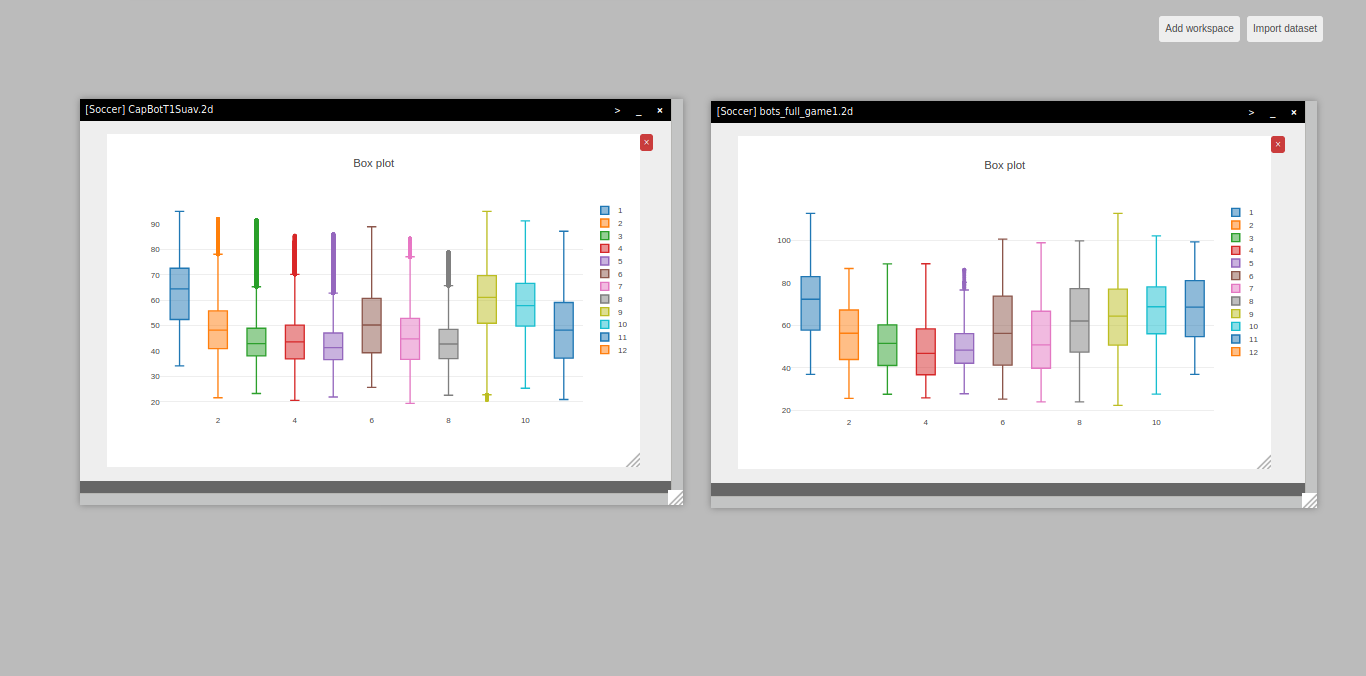
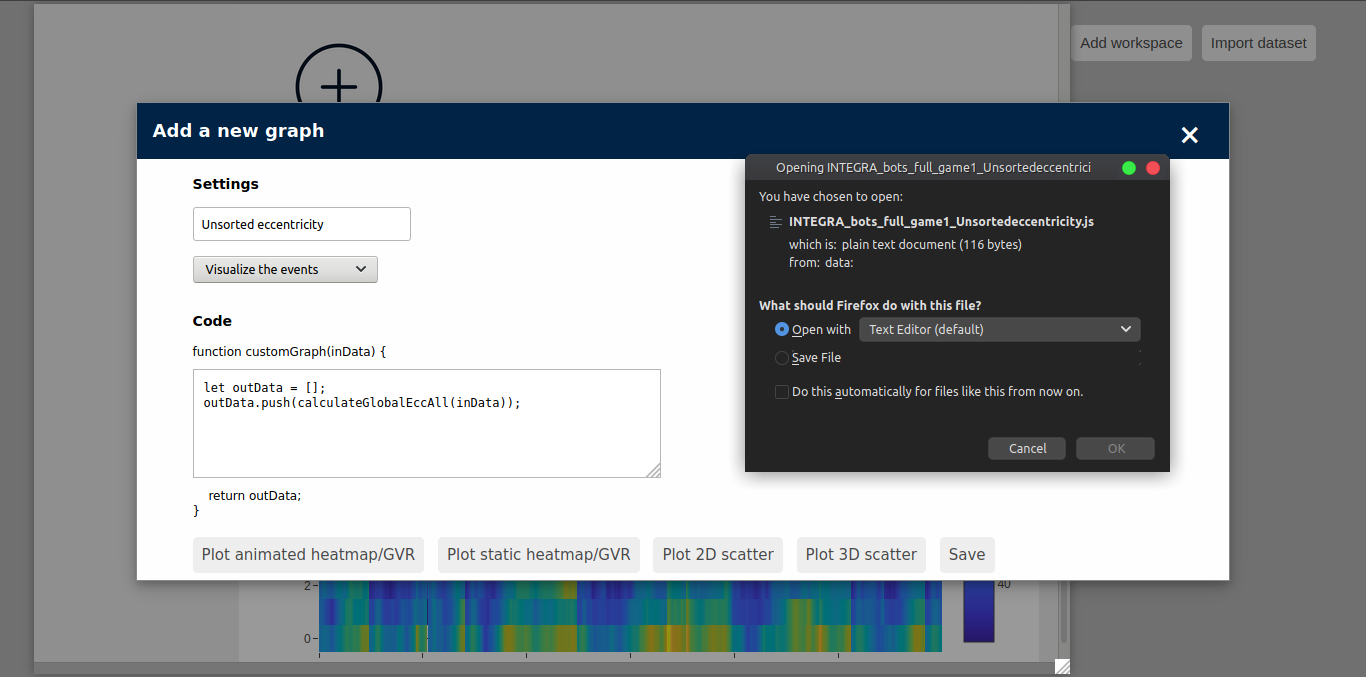
The wiki is available at https://github.com/nicolopinci/INTEGRA/wiki and describes how to use the tool in detail. One of the central features of INTEGRA, for example, is the possibility to plot a custom graph. For this purpose, the user should follow this procedure:
- Import a soccer dataset
- Select it from the dataset list
- Wait until the preset graphs and the + button are loaded
- A modal window will appear
inDatais the representation of the parsed data as a mapoutDatawill be used by Plot.ly to plot the custom graph- It is now possible to write Javascript code to manipulate the initial data properly.


