Clustably provides simple resampling methods for determining the stability of single-cell RNA-Seq clusters. It is mainly aimed at use together with Seurat, however the methods here can be generalized to other packages and even data types.
Currently clustably is only availble as a development version, so you must install devtools and install from this repository.
install.packages('devtools')
library(devtools)
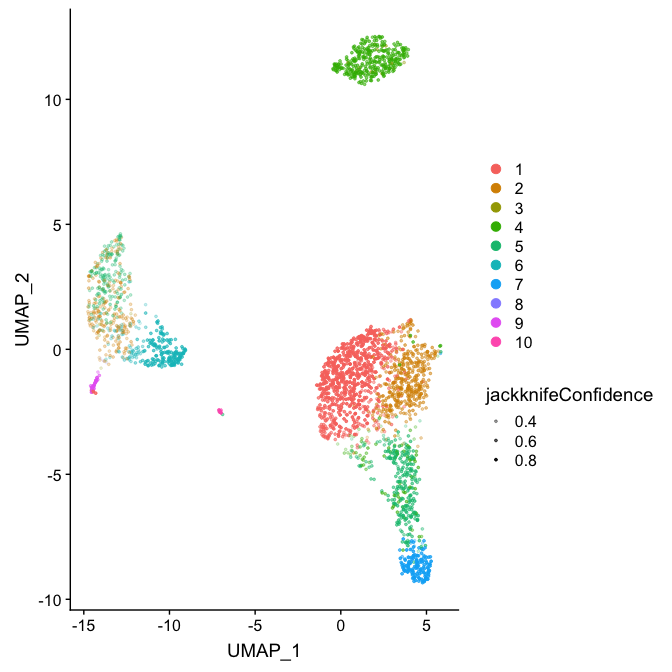
devtools::install_github("nijibabulu/clustably")Clustably can plot jackknife confidence values along with the standard UMAP or tSNE embedding of each cell:
library(clustably)
library(Seurat)
label <- function(obj) {
  # function to label a resampled subset of the data
  obj <- FindVariableFeatures(obj, verbose = F)
  obj <- ScaleData(obj, verbose = F)
  obj <- RunPCA(obj, verbose = F)
  obj <- FindNeighbors(obj, verbose = F)
  obj <- FindClusters(obj, verbose = F)
  Idents(obj)
}

pbmc <- # ... fetch and pre-process a pbmc Seurat data set

pbmc.jack <- jackknifeClustering(pbmc, labelingFunc=label, n=100, verbose=T)
pbmc.jack <- RunUMAP(pbmc.jack, reduction = "pca", dims = 1:10)
Idents(pbmc.jack) <- "jackknifeConsensus"
DimConfidencePlot(pbmc.jack, confidence="jackknifeConfidence")
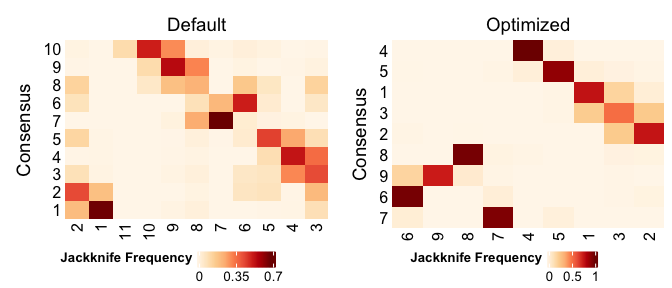
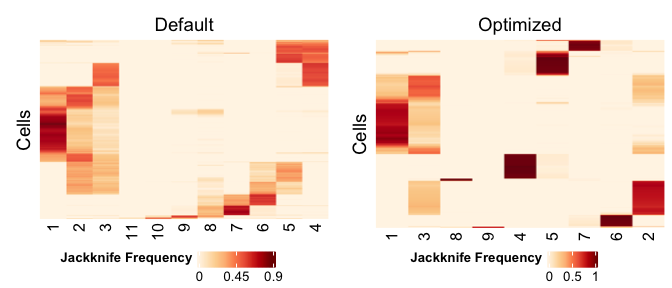
We can use the information about confidence values to compare different clustering schemes to each other:
CombinePlots(list(
  PlotCrossClassificationFrequency(pbmc.jack, plotTitle="Default"),
  PlotCrossClassificationFrequency(pbmc.jack.opt, plotTitle="Optimized")))
CombinePlots(list(
  PlotCellClassifications(pbmc.jack, plotTitle="Default"),
  PlotCellClassifications(pbmc.jack.opt, plotTitle="Optimized")))
You can find a tutorial here.


