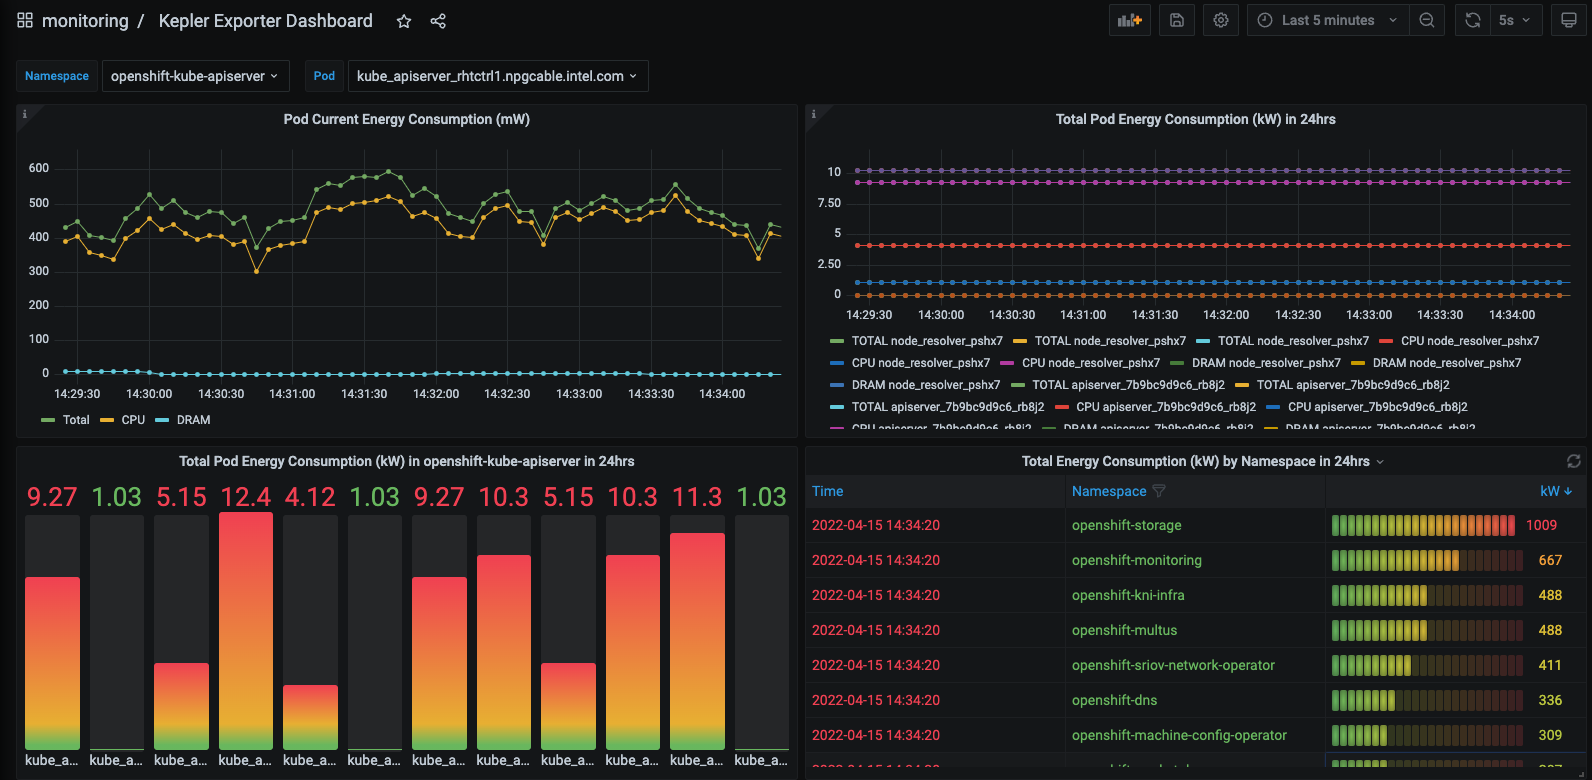
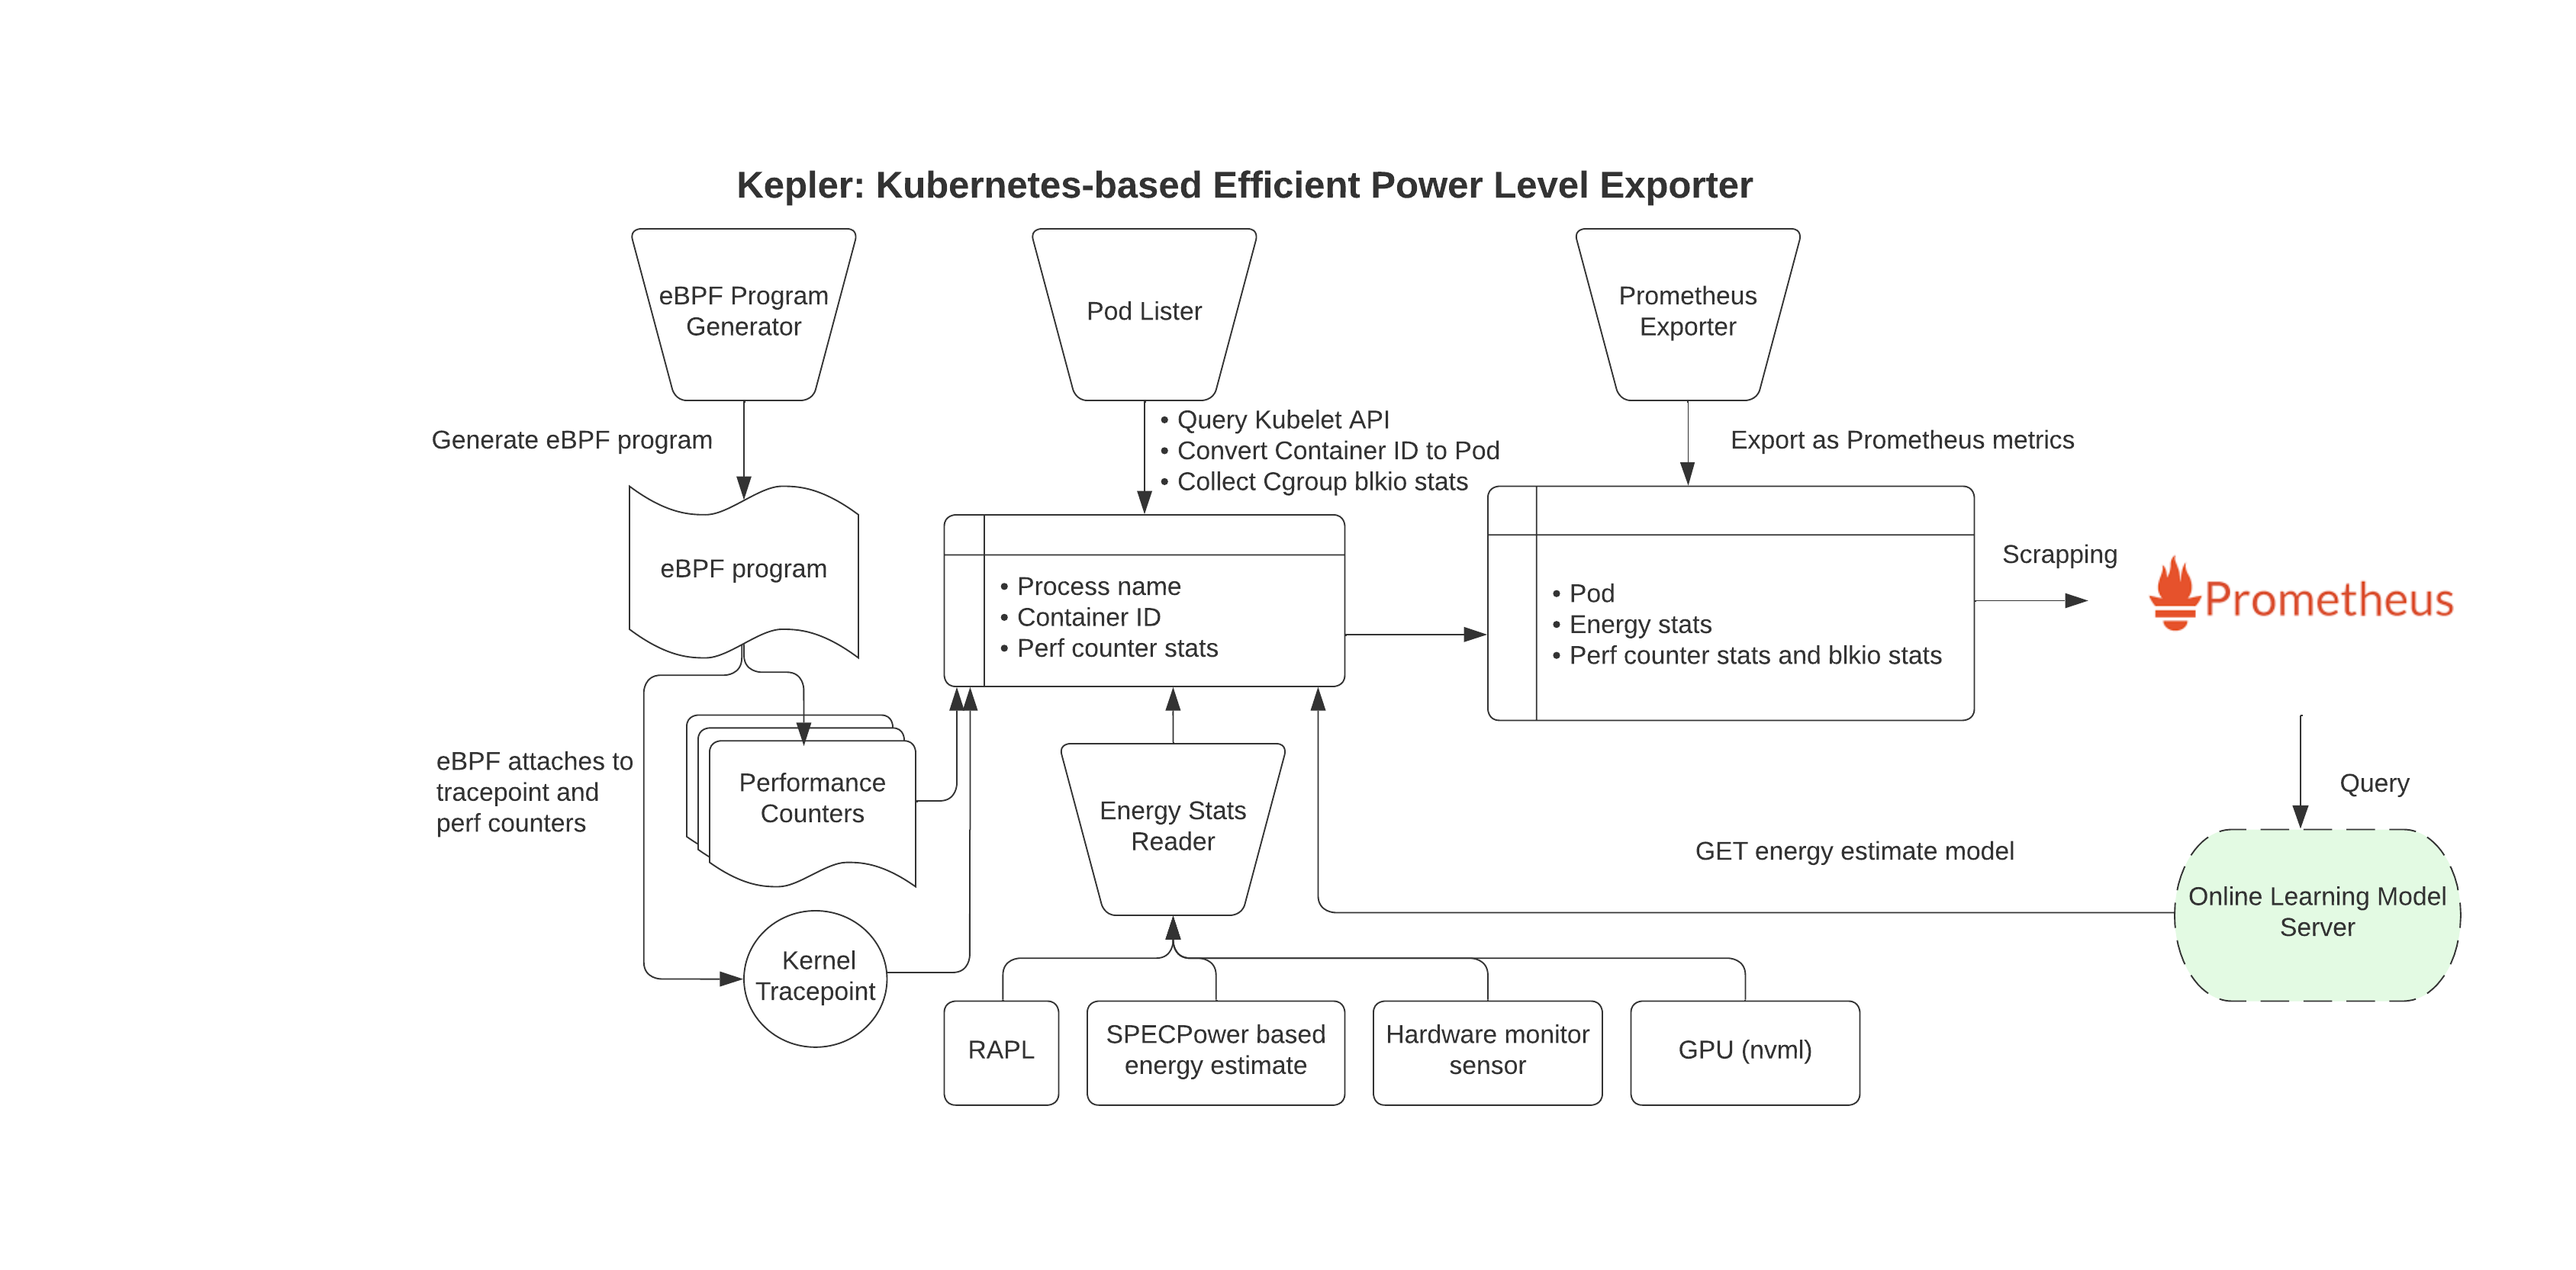
Kepler (Kubernetes Efficient Power Level Exporter) uses eBPF to probe energy related system stats and exports as Prometheus metrics
Open Source Summit NA 2022 talk and demo
Kernel 4.18+
Need access to a Kubernetes cluster.
Deploying the Kepler exporter as a daemonset to run on all nodes. The following deployment will also create a service listening on port 9102.
# build manifests file for VM+Baremetal and Baremetal only
# manifests are created in  _output/manifests/kubernetes/generated/ by default
# kubectl v1.21.0 is minimum version that support build manifest
# make build-manifest
if you are running with Baremetal only
kubectl create -f _output/manifests/kubernetes/generated/bm/deployment.yaml
if you are running with Baremetal and/or VM
kubectl create -f _output/manifests/kubernetes/generated/vm/deployment.yaml
- Clone the kube-prometheus project to your local folder.
# git clone https://github.com/prometheus-operator/kube-prometheus
- Deploy the whole monitoring stack using the config in the
manifestsdirectory. Create the namespace and CRDs, and then wait for them to be available before creating the remaining resources
# cd kube-prometheus
# kubectl apply --server-side -f manifests/setup
# until kubectl get servicemonitors --all-namespaces ; do date; sleep 1; echo ""; done
# kubectl apply -f manifests/
# cd ../kepler
# kubectl create -f manifests/kubernetes/keplerExporter-serviceMonitor.yaml
Import the pre-generated Kepler Dashboard into grafana

To set up a development environment please read our Getting Started Guide
Download the biweekly community meeting iCalendar file.


