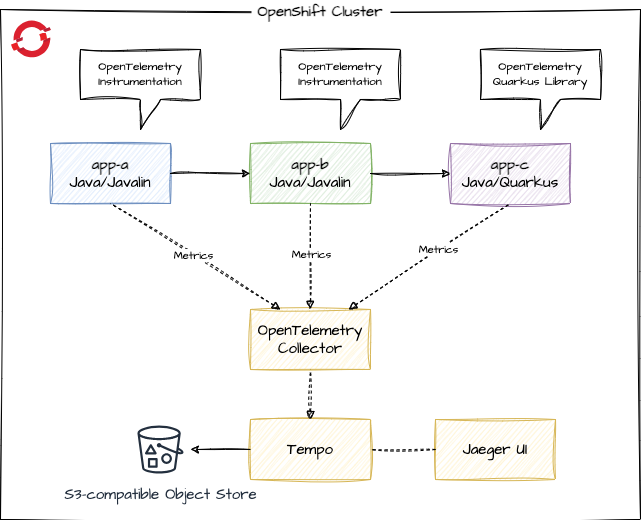
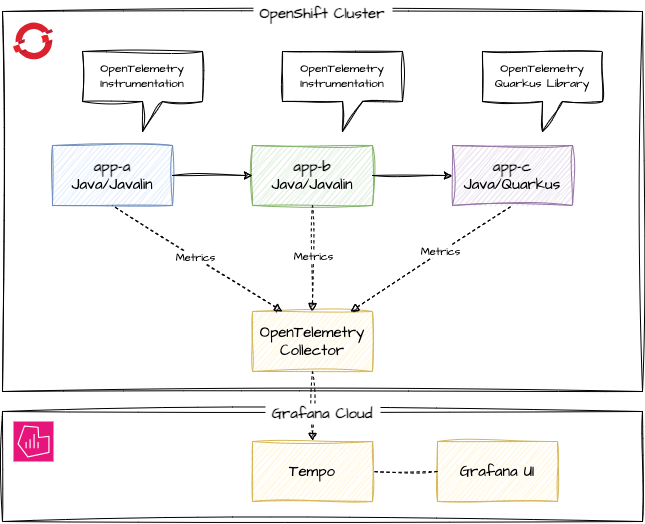
Simple example of distributed tracing with OpenTelemetry. Tracing backend Tempo/Grafana (Grafana Cloud) or Tempo/Jaeger UI (Tempo Operator on OpenShift), apps running on OpenShift with OpenTelemetry Operator for instrumenting the apps and collecting the traces.
We have the following apps:
Each app responds with it's name and we do a downstream service call, so app-a calls app-b calls app-c, adding the response of the downstream call to the output. So calling the app-a endpoint should return:
App A <- App B <- App C
oc create -f k8s/infra/tempo-operator.ymlPrerequisite: ODF is installed on OpenShift. If not, please install or use MinIO as alternative (instructions on the bottom of the page).
Create a bucketclaim
oc create -f k8s/infra/bucketclaim.ymlThen read the generated access keys and and export them as environment variables:
export S3_ENDPOINT="http://s3.openshift-storage.svc"
export AWS_ACCESS_KEY_ID=$(oc get secret tempostorage -n tempostack -o jsonpath='{.data.AWS_ACCESS_KEY_ID}' | base64 --decode)
export AWS_SECRET_ACCESS_KEY=$(oc get secret tempostorage -n tempostack -o jsonpath='{.data.AWS_SECRET_ACCESS_KEY}' | base64 --decode)Now create the Tempo stack:
envsubst < k8s/infra/tempostack.yml | oc apply -f -If you don't have envsubst, replace the values manually in tempostack.yml.
When all pods are running, check the Route oc get route and find the route for tempo-tempostack-query-frontend. Open it in a Browser and login via OpenShift. The query frontend is the Jaeger UI.
Next install the OpenTelemetry operator:
oc create -f k8s/infra/opentelemetry-operator.ymlAlternatively install via OpenShift UI the Red Hat build of OpenTelemetry operator from Operator Hub and accept the defaults.
oc new-project demooc create -f k8s/infra/tempostack-collector.ymlWe're using the deployment mode of the collector here, other options like sidecar are also available.
Check the status of the deployment:
oc get deploy -wWhen ready, have a look at the logs with
oc logs deployment/otel-collectoroc apply -k k8s/baseexport ROUTE=http://$(oc get route app-a -o jsonpath='{.spec.host}')
curl $ROUTEWith the Tempo stack operator comes Jaeger UI (you could also configure Grafana UI). Our desired flow of the metrics is:
You can find the URL to Jaeger UI with:
oc get route -n tempostackApply the kustomizations for tracing - the instrumentation resources, the annotations to trigger the instrumentation in app-a and app-b and the change of the sampler ratio of the Quarkus app-c from 0% to 100%.
oc apply -k k8s/overlays/traceIf you inspect the pods of app-a and app-b, you can see that the Java agent for the instrumentation is added via JAVA_TOOL_OPTIONS. An init container copied the javaagent.jar to the pod volume. app-c has no Java agent, as the Quarkus app itself sends the metrics to the collector and we haven't applied the instrumentation to app-c.
Hint: If the javaagent is missing but the annotations are there, simply delete the pods so they're recreated.
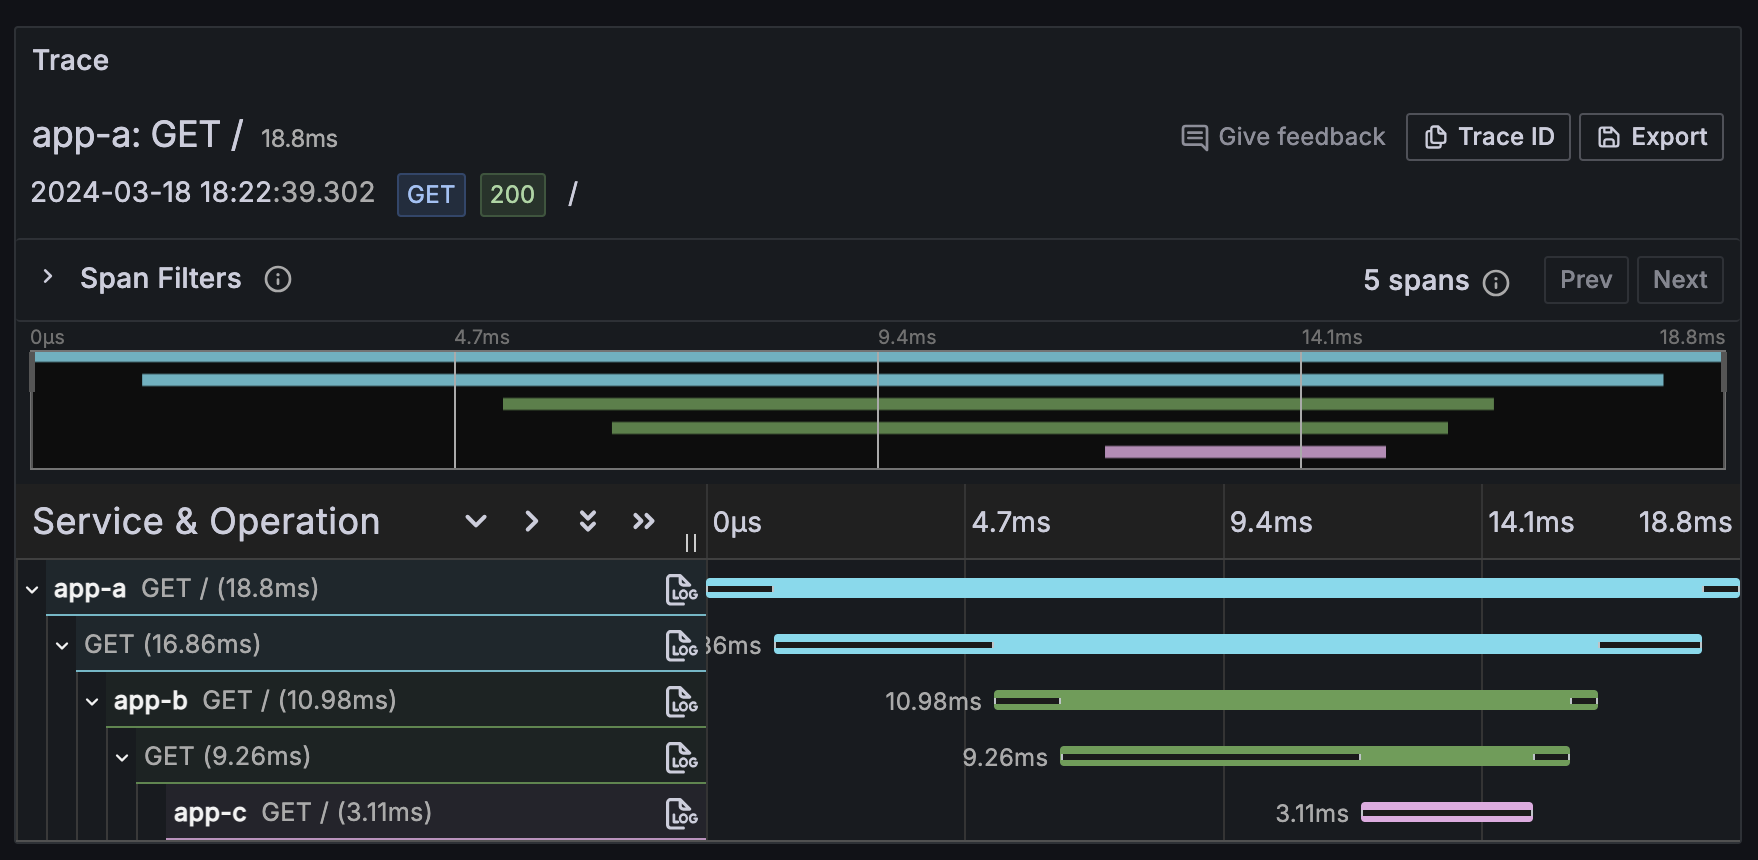
Now call the app-a endpoint to generate some traces, open the Jeager UI (oc get route -n tempostack) in a Browser, select app-a and click on "Find traces". You should see the distributed tracing information:
If you don't see any traces:
- wait a few seconds and try again (reload), the observability does not work in realtime
- check the logs of the OpenTelementry collector and maybe the TempoStack to find the cause of the problem
Now your company wants to evaluate, if it should use Grafana Cloud instead of the TempoStack.
If you don't have an account yet, for testing you could register for the free tier of Grafana Cloud. Free tier is enough for testing, if no sensitive data is transferred.
Login to Grafana Cloud and setup an instance. Make note of the endpoint, user, api key and token.
Make endpoint data of Tempo available via environment variables:
export TEMPO_URL=<tempourl>
export TEMPO_USER=<userid>
export TEMPO_APIKEY=<apikey>
export TEMPO_TOKEN=`echo -n "$TEMPO_USER:$TEMPO_APIKEY" | base64`
Replace the collector, that send telemetry data to the TempoStack by a new collector that send the data into the Grafana Cloud:
oc delete -f k8s/infra/tempostack-collector.yml
envsubst < k8s/infra/grafanacloud-collector.yml | oc apply -f -
If you don't have envsubst, use yq or edit the file to set the Tempo URL and Token before applying.
Again, make some curl calls to your apps API endpoint to create some telemetry data. Then open the Grafana Dashboard and navigate to:
Explore -> grafanacloud-<username>-traces -> Query type "Search".
If you don't want to use ODF, you can use MinIO.
oc create -f k8s/infra/minio.ymlDo not use this MinIO configuration for production workloads!
Check the Route for your MinIO installation and open the console route in your browser. Login with minioadmin / minioadmin, create a bucket and an API key. For simplicity reasons create a bucket "tempostorage" and an access key "tempostorage" with secret key "tempostorage". Again, do not do that for production workloads.
Then create the TempoStack:
oc new-project tempostack
export S3_ENDPOINT="http://minio.minio.svc:9000"
export AWS_ACCESS_KEY_ID="tempostorage"
export AWS_SECRET_ACCESS_KEY="tempostorage"
envsubst < k8s/infra/tempostack.yml | oc apply -f -


