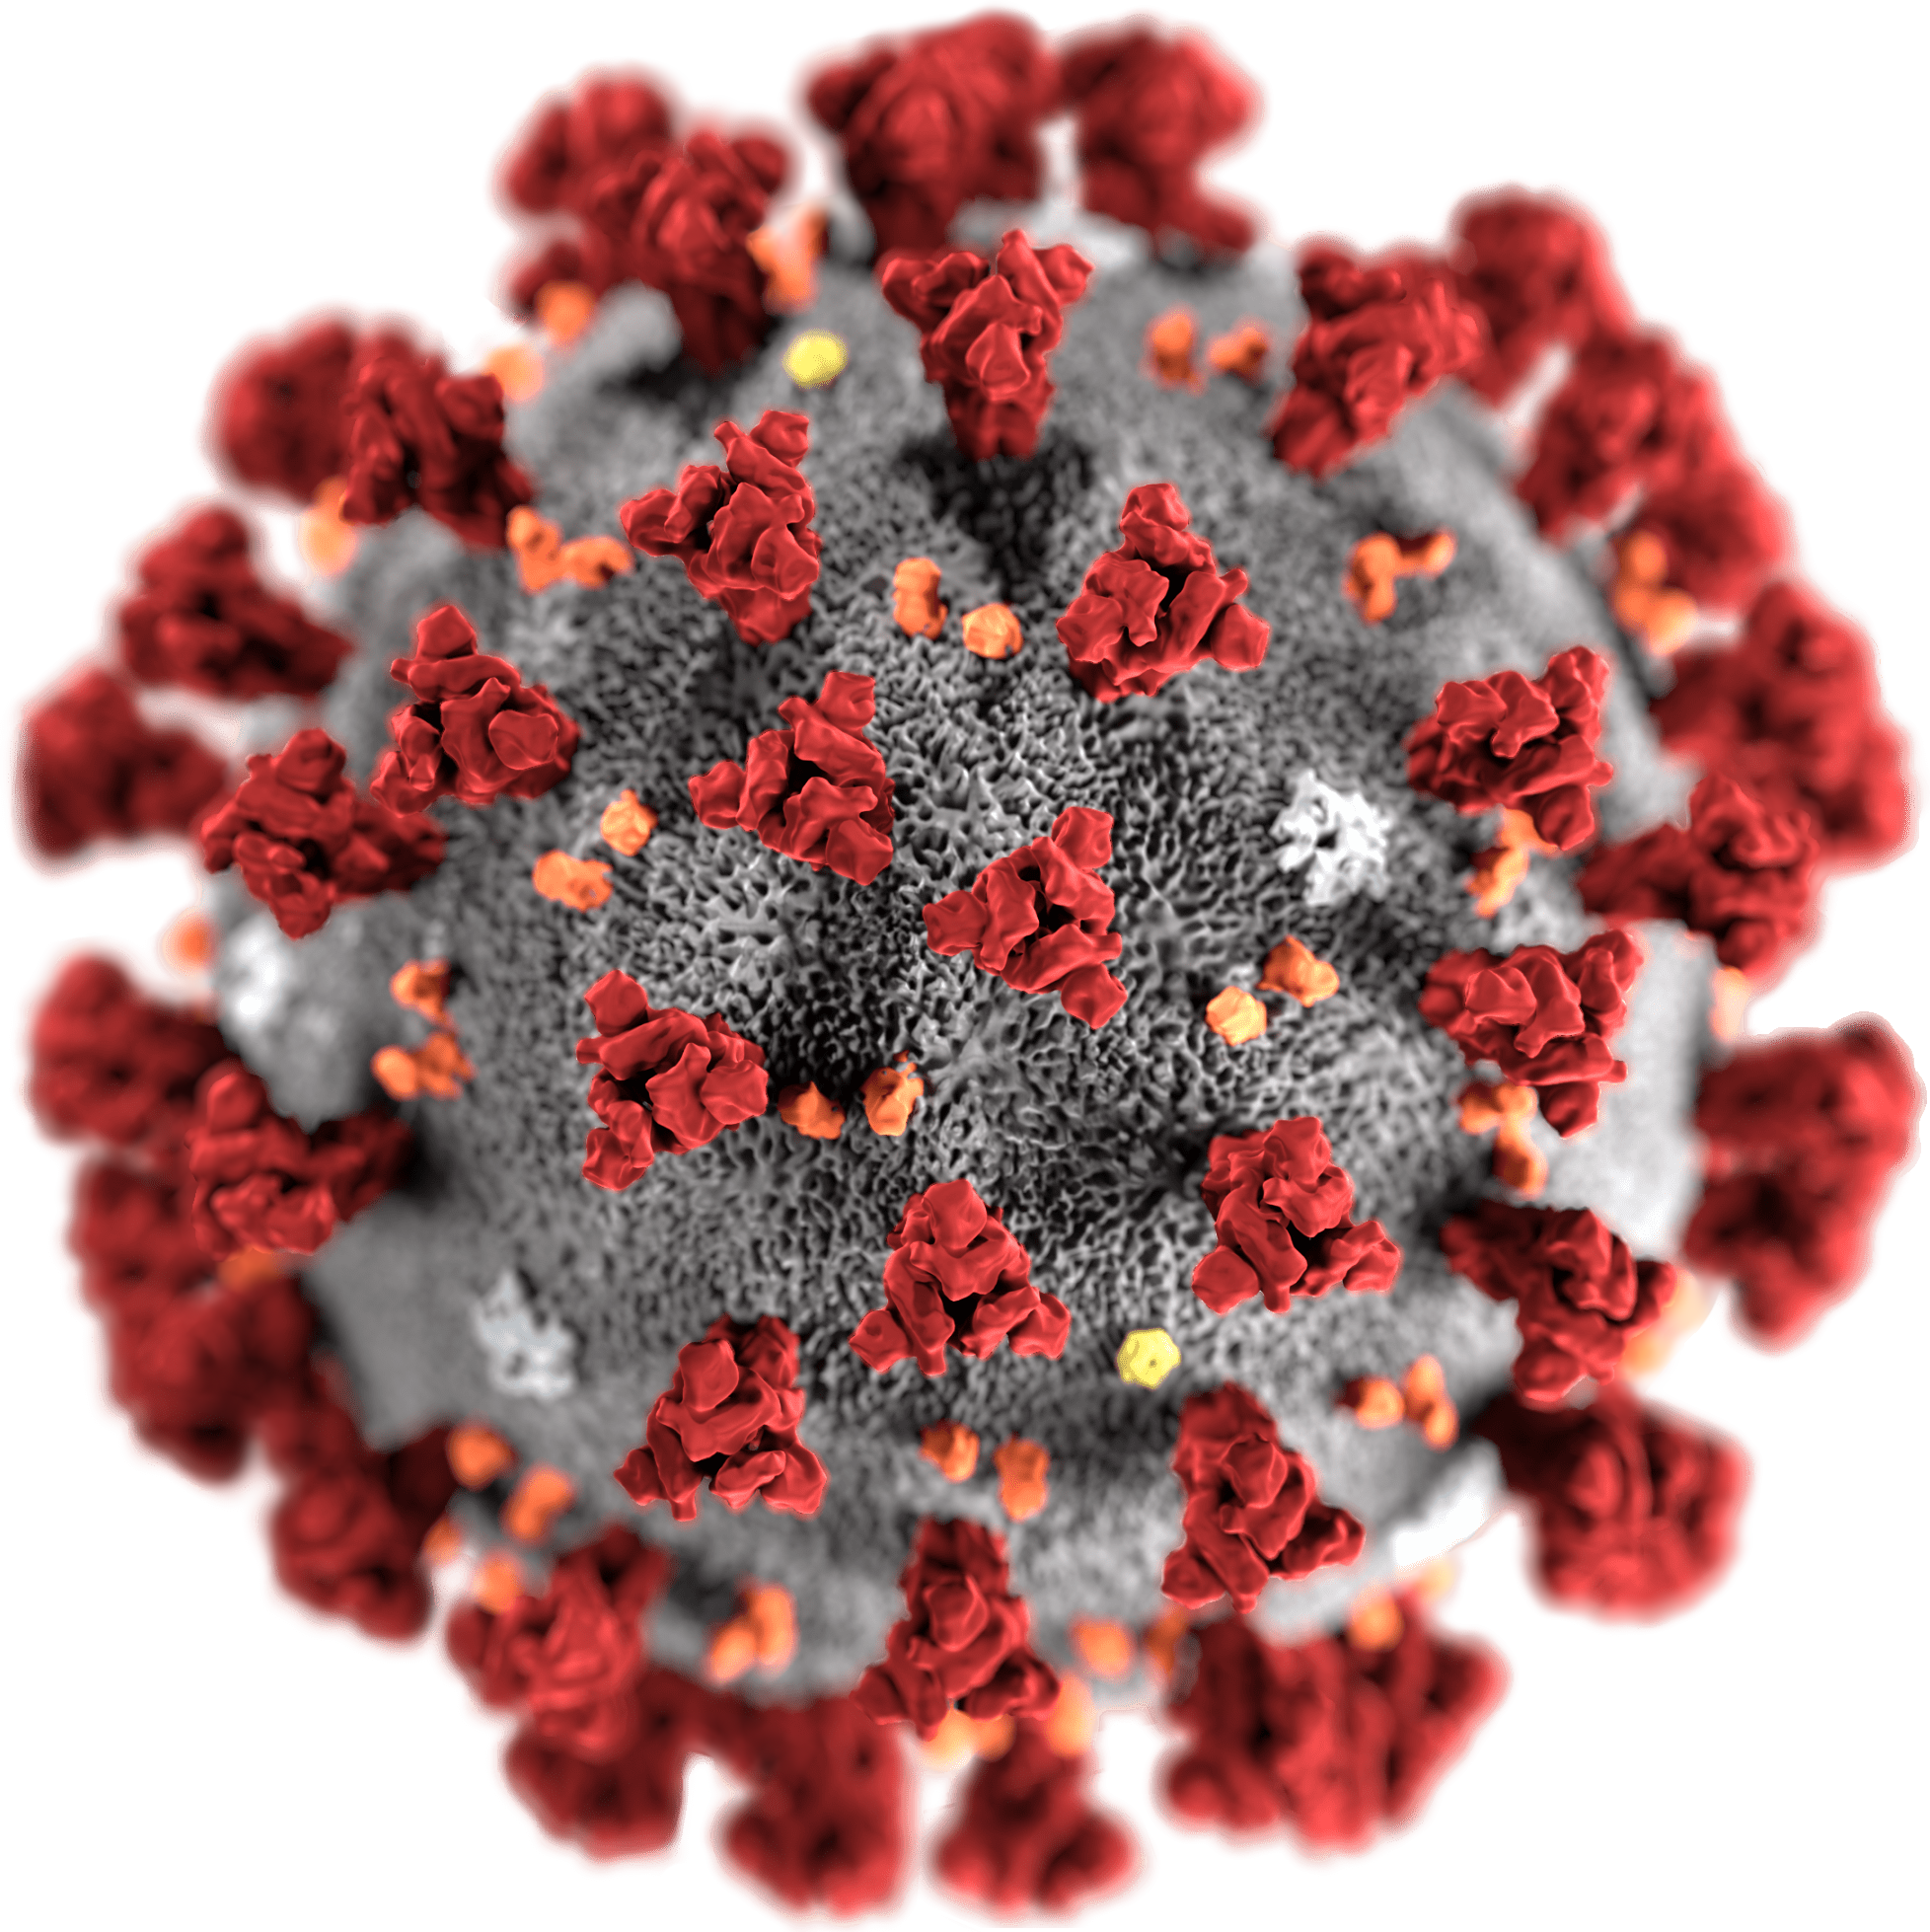
The coronavirus package provides a tidy format dataset of the 2019 Novel Coronavirus COVID-19 (2019-nCoV) epidemic. The raw data pulled from the Johns Hopkins University Center for Systems Science and Engineering (JHU CCSE) Coronavirus repository.
More details available
here, and a csv format
of the package dataset available
here
A summary dashboard is available here
Source: Centers for Disease Control and Prevention’s Public Health Image Library
Install the CRAN version:
install.packages("coronavirus") Install the Github version (refreshed on a daily bases):
# install.packages("devtools")
devtools::install_github("RamiKrispin/coronavirus")The package contains a single dataset - coronavirus:
library(coronavirus)

data("coronavirus")
This coronavirus dataset has the following fields:
head(coronavirus)
#>   Province.State Country.Region Lat Long       date cases      type
#> 1                   Afghanistan  33   65 2020-01-22     0 confirmed
#> 2                   Afghanistan  33   65 2020-01-23     0 confirmed
#> 3                   Afghanistan  33   65 2020-01-24     0 confirmed
#> 4                   Afghanistan  33   65 2020-01-25     0 confirmed
#> 5                   Afghanistan  33   65 2020-01-26     0 confirmed
#> 6                   Afghanistan  33   65 2020-01-27     0 confirmed
tail(coronavirus)
#>       Province.State Country.Region     Lat     Long       date cases      type
#> 40063       Zhejiang          China 29.1832 120.0934 2020-03-09    15 recovered
#> 40064       Zhejiang          China 29.1832 120.0934 2020-03-10    15 recovered
#> 40065       Zhejiang          China 29.1832 120.0934 2020-03-11     4 recovered
#> 40066       Zhejiang          China 29.1832 120.0934 2020-03-12     2 recovered
#> 40067       Zhejiang          China 29.1832 120.0934 2020-03-13     0 recovered
#> 40068       Zhejiang          China 29.1832 120.0934 2020-03-14    14 recovered
Here is an example of a summary total cases by region and type (top 20):
library(dplyr)

summary_df <- coronavirus %>% group_by(Country.Region, type) %>%
  summarise(total_cases = sum(cases)) %>%
  arrange(-total_cases)

summary_df %>% head(20)
#> # A tibble: 20 x 3
#> # Groups:   Country.Region [15]
#>    Country.Region type      total_cases
#>    <chr>          <chr>           <int>
#>  1 China          confirmed       80977
#>  2 China          recovered       65660
#>  3 Italy          confirmed       21157
#>  4 Iran           confirmed       12729
#>  5 Korea, South   confirmed        8086
#>  6 Spain          confirmed        6391
#>  7 Germany        confirmed        4585
#>  8 France         confirmed        4480
#>  9 China          death            3193
#> 10 Iran           recovered        2959
#> 11 US             confirmed        2727
#> 12 Italy          recovered        1966
#> 13 Italy          death            1441
#> 14 Switzerland    confirmed        1359
#> 15 United Kingdom confirmed        1143
#> 16 Norway         confirmed        1090
#> 17 Sweden         confirmed         961
#> 18 Netherlands    confirmed         959
#> 19 Denmark        confirmed         836
#> 20 Japan          confirmed         773
Summary of new cases during the past 24 hours by country and type (as of 2020-03-14):
library(tidyr)

coronavirus %>%
  filter(date == max(date)) %>%
  select(country = Country.Region, type, cases) %>%
  group_by(country, type) %>%
  summarise(total_cases = sum(cases)) %>%
  pivot_wider(names_from = type,
              values_from = total_cases) %>%
  arrange(-confirmed)
#> # A tibble: 143 x 4
#> # Groups:   country [143]
#>    country        confirmed death recovered
#>    <chr>              <int> <int>     <int>
#>  1 Italy               3497   175       527
#>  2 Iran                1365    97         0
#>  3 Spain               1159    62       324
#>  4 Germany              910     2         0
#>  5 France               813    12         0
#>  6 US                   548     7         0
#>  7 United Kingdom       342    13         0
#>  8 Switzerland          220     2         0
#>  9 Netherlands          155     2         2
#> 10 Austria              151     0         0
#> 11 Sweden               147     1         0
#> 12 Belgium              130     1         0
#> 13 Korea, South         107     6         0
#> 14 Norway                94     3         0
#> 15 Japan                 72     3         0
#> 16 Finland               70     0         0
#> 17 Portugal              57     0         1
#> 18 Australia             50     0         0
#> 19 Czechia               48     0         0
#> 20 Philippines           47     3         0
#> 21 Malaysia              41     0         9
#> 22 Slovenia              40     1         0
#> 23 Ireland               39     1         0
#> 24 Greece                38     2         8
#> 25 Estonia               36     0         0
#> 26 Poland                35     1         0
#> 27 Romania               34     0         2
#> 28 China                 32    13      1464
#> 29 Denmark               32     1         0
#> 30 Israel                32     0         0
#> 31 Egypt                 29     0         0
#> 32 Indonesia             27     1         6
#> 33 Kuwait                24     0         0
#> 34 Iceland               22     0         0
#> 35 Bahrain               21     0         0
#> 36 India                 20     0         0
#> 37 Bulgaria              18     1         0
#> 38 Chile                 18     0         0
#> 39 Luxembourg            17     1         0
#> 40 Qatar                 17     0         4
#> # … with 103 more rowsThe raw data pulled and arranged by the Johns Hopkins University Center for Systems Science and Engineering (JHU CCSE) from the following resources:
- World Health Organization (WHO): https://www.who.int/
- DXY.cn. Pneumonia. 2020. http://3g.dxy.cn/newh5/view/pneumonia.
- BNO News:
https://bnonews.com/index.php/2020/02/the-latest-coronavirus-cases/
- National Health Commission of the People’s Republic of China (NHC): http:://www.nhc.gov.cn/xcs/yqtb/list_gzbd.shtml
- China CDC (CCDC):
http:://weekly.chinacdc.cn/news/TrackingtheEpidemic.htm
- Hong Kong Department of Health:
https://www.chp.gov.hk/en/features/102465.html
- Macau Government: https://www.ssm.gov.mo/portal/
- Taiwan CDC:
https://sites.google.com/cdc.gov.tw/2019ncov/taiwan?authuser=0
- US CDC: https://www.cdc.gov/coronavirus/2019-ncov/index.html
- Government of Canada:
https://www.canada.ca/en/public-health/services/diseases/coronavirus.html
- Australia Government Department of Health:
https://www.health.gov.au/news/coronavirus-update-at-a-glance
- European Centre for Disease Prevention and Control (ECDC):
https://www.ecdc.europa.eu/en/geographical-distribution-2019-ncov-cases


