Create a useful dashboard overview of Spotify data obtained from the Spotify API. This is designed to work with the data exported from the Spotify Rehydrator. It is also designed to work with multiple different data files, in order to create a dashboard for multiple users.
Because of this, the .Rmd file takes a filepath to the data as a parameter, and the .R script can be used to iterate through data files in a repository.
The .Rmd file will generate a .html multi-page dashboard describing an individual's Spotify data. It is built using R Markdown, Plotly and flexdashboard.
This dashboard will accept a .tsv where each row contains a listening event in an individuals Spotify listening history. This is easy to change though in the first markdown block of the template .Rmd file.
- Number of listening events in the data
- Number of hours of music played overall
- The percentage of songs that were repeated
- The number of unique tracks listened to
- Top 10 artists listened to
- Top song for each month of data
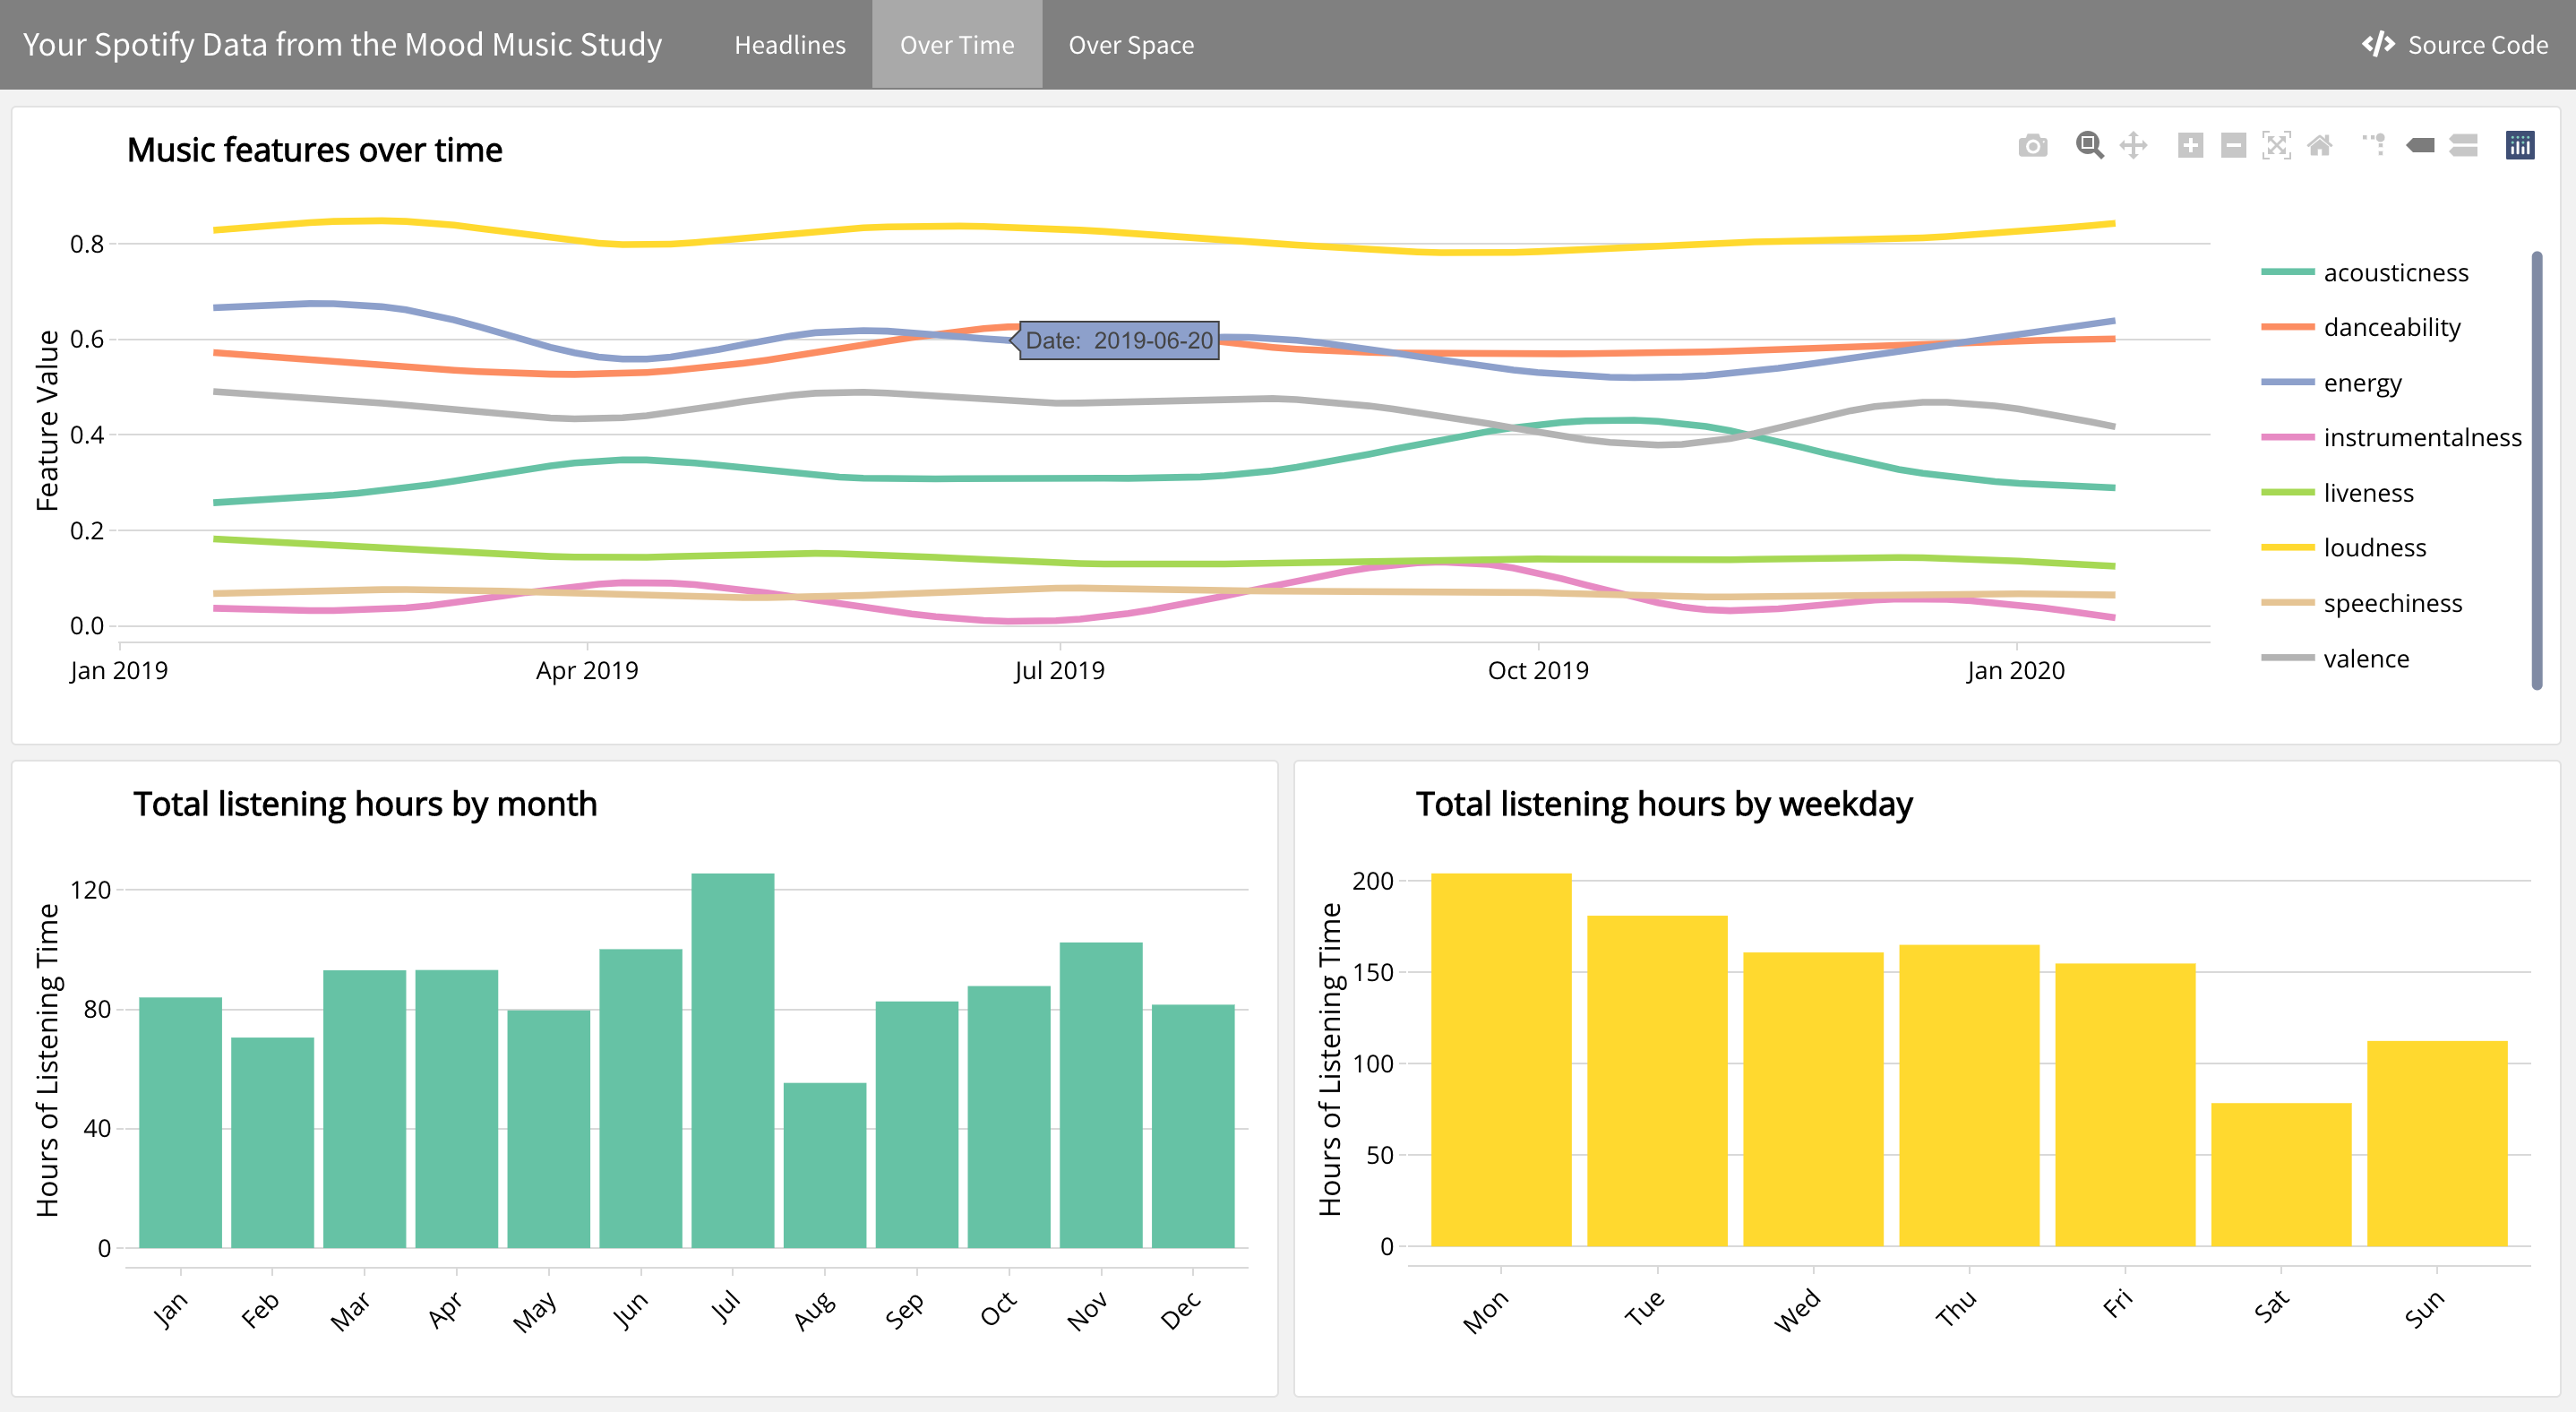
- A time-series plot of eight of the music features over time
- Bar chart of the number of hours of music listened to each weekday
- Bar chart of the number of hours of music listened to each month
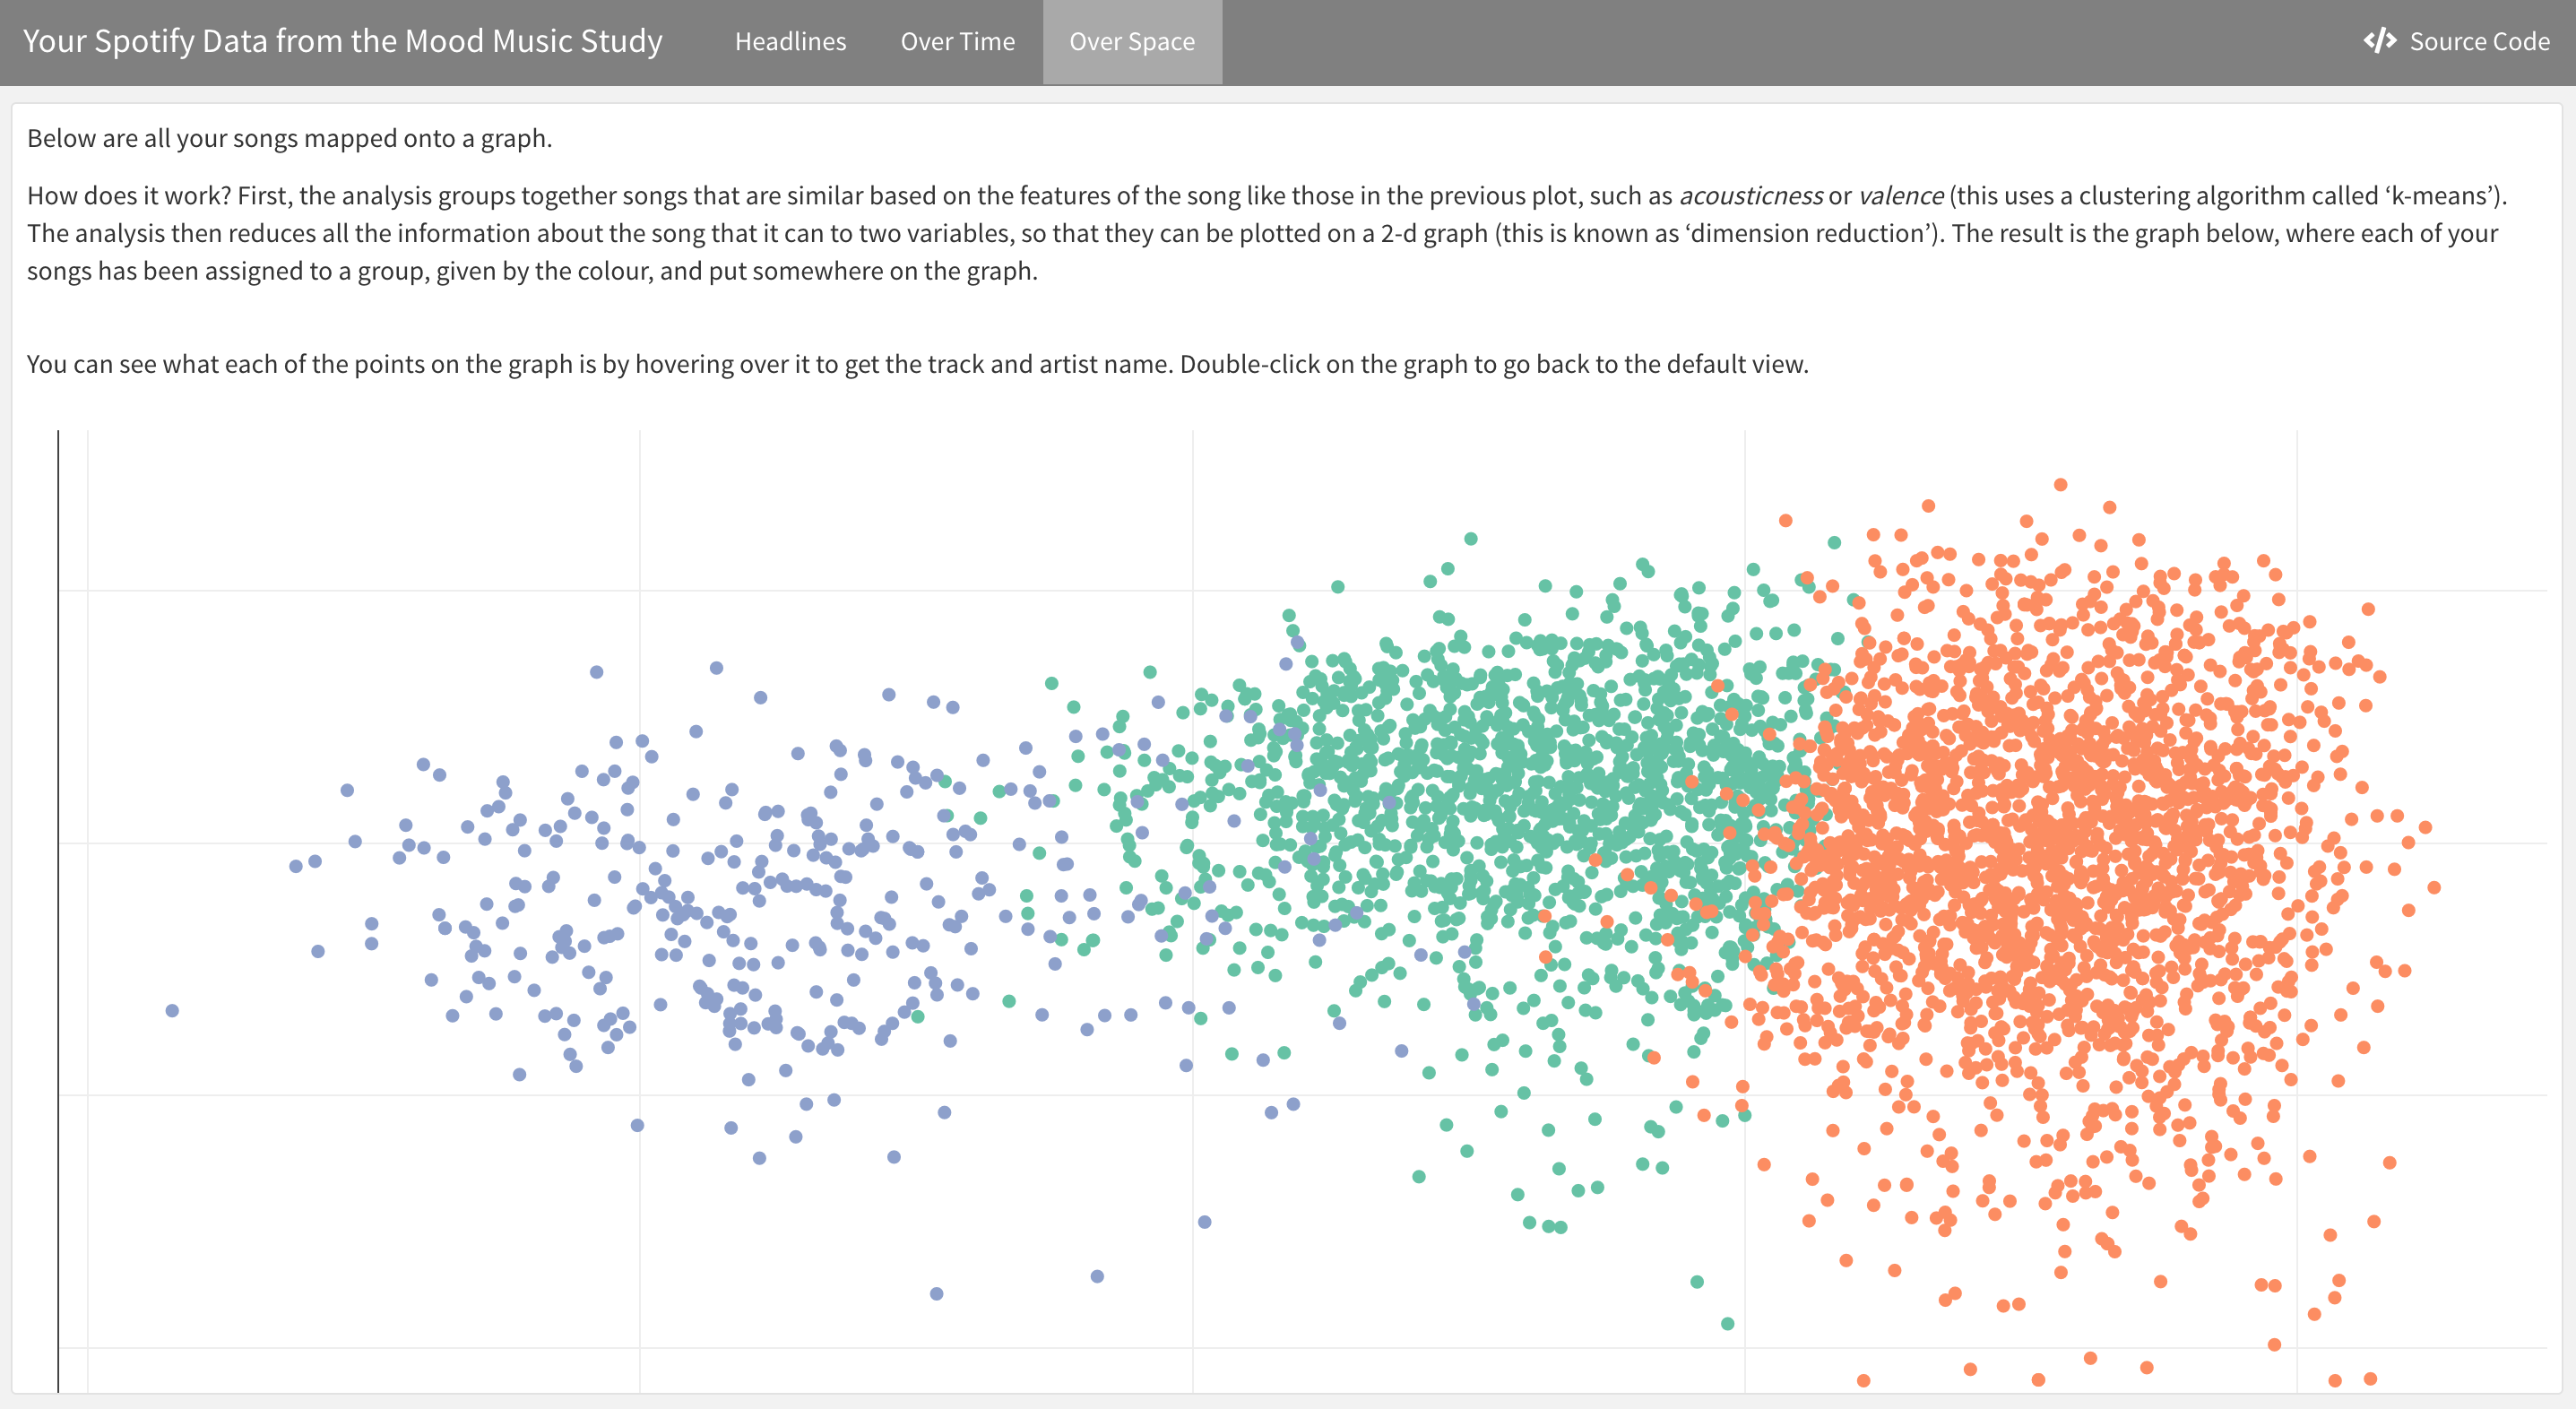
- A plot of all the songs as points, with the x and y axes as principle components, and songs coloured by their k-means cluster
The below are examples of each page of the dashboard.


