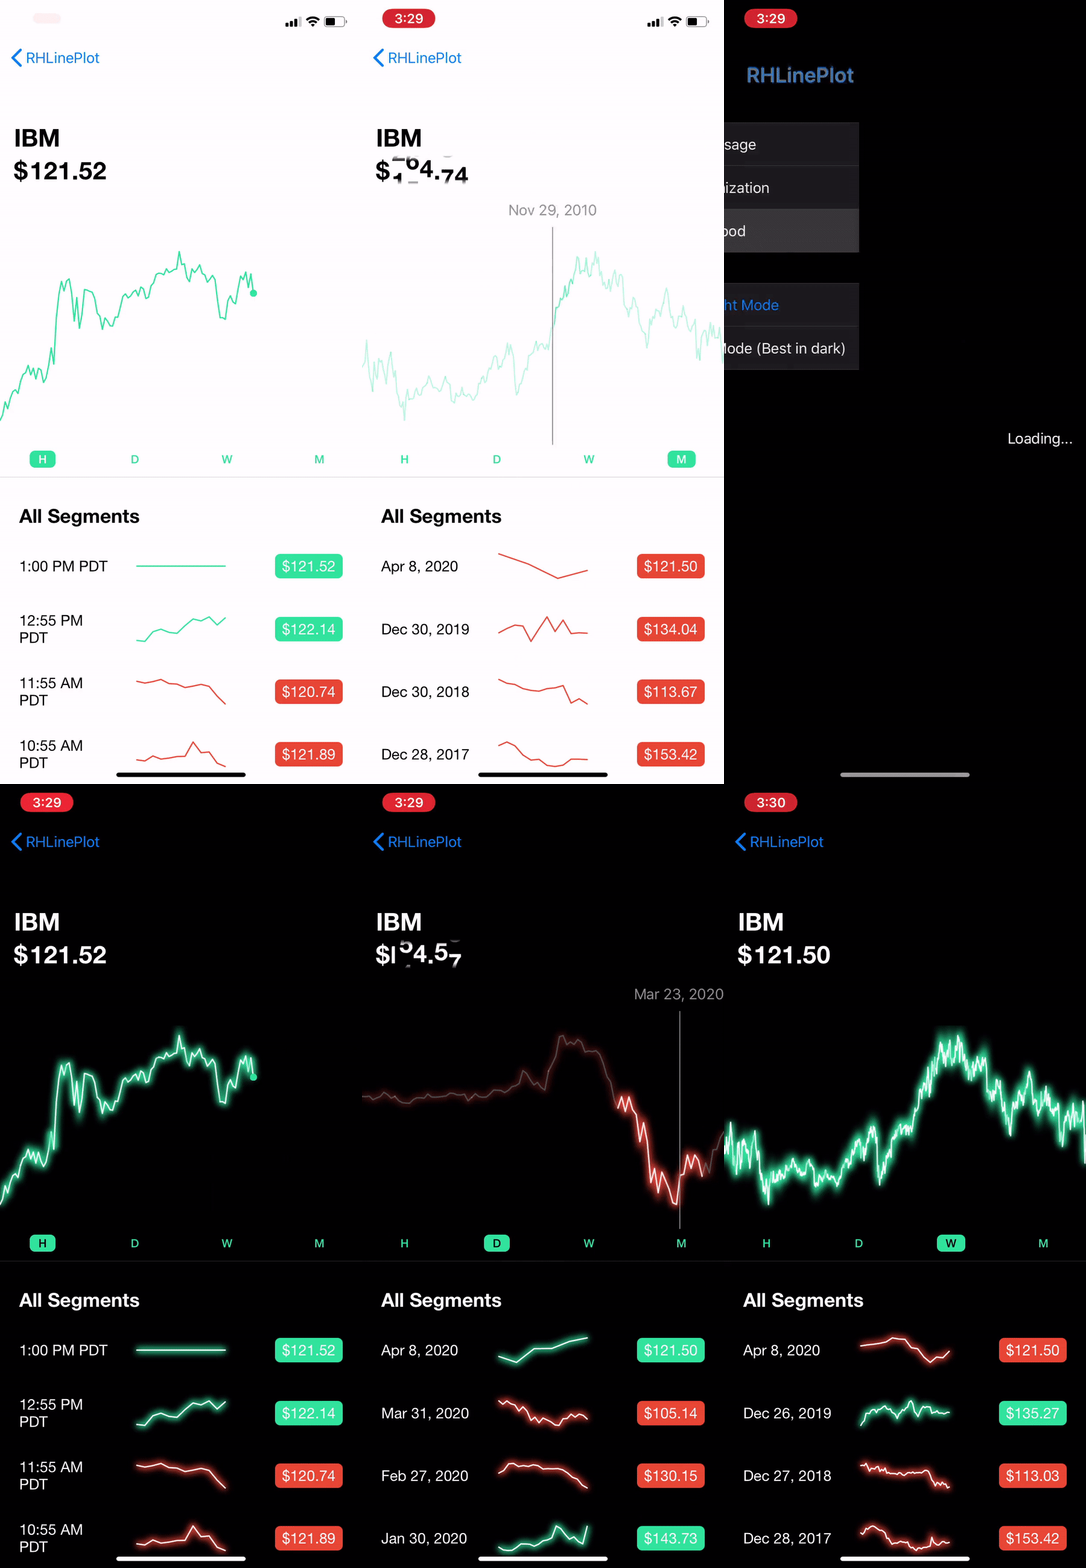
Line plot like in Robinhood app, in pure SwiftUI
Demo:
- Support glowing indicator, i.e. for real-time data
- Highlight active segment
- Laser mode!
Play around with the example app to see possible customizations and the Robinhood-style view shown in the demo.
The moving price effect in that page would be worthy of another repo here.
Just use the source however you like. The library is in folder RHLinePlot.
RHLinePlot(
    values: valuesToPlot,
    occupyingRelativeWidth: 0.8,
    showGlowingIndicator: true,
    lineSegmentStartingIndices: segments,
    activeSegment: 2,
    customLatestValueIndicator: {
      // Return a custom glowing indicator if you want
    }
)
Notes:
segmentsis the beginning indices of each segment. I.e.values = [1,2,3,4,3,2,1,2,3,4]andsegments = [0,4,8]means there are three segments in this line plot: 0-3, 4-7, 8-9.occupyingRelativeWidth = 0.8is to plot 80% of the plot canvas. This is useful to simulate realtime data. I.e. compute the current hour of the day relative to the 24-hour timeframe and use that ratio. By default this is 1.0.
RHInteractiveLinePlot(
    values: values,
    occupyingRelativeWidth: 0.8,
    showGlowingIndicator: true,
    lineSegmentStartingIndices: segments,
    didSelectValueAtIndex: { index in
      // Do sth useful with index...
},
    customLatestValueIndicator: {
      // Custom indicator...
},
    valueStickLabel: { value in
      // Label above the value stick...
})To customize:
YourView
.environment(\.rhLinePlotConfig, RHLinePlotConfig.default.custom(f: { (c) in
    c.useLaserLightLinePlotStyle = isLaserModeOn
}))
Full config:
public struct RHLinePlotConfig {

    /// Width of the rectangle holding the glowing indicator (i.e. not `radius`, but rather `glowingIndicatorWidth = 2*radius`). Default is `8.0`
    public var glowingIndicatorWidth: CGFloat = 8.0

    /// Line width of the line plot. Default is `1.5`
    public var plotLineWidth: CGFloat = 1.5

    /// If all values are equal, we will draw a straight line. Default is 0.5 which draws a line at the middle.
    public var relativeYForStraightLine: CGFloat = 0.5

    /// Opacity of unselected segment. Default is `0.3`.
    public var opacityOfUnselectedSegment: Double = 0.3

    /// Animation duration of opacity on select/unselect a segment. Default is `0.1`.
    public var segmentSelectionAnimationDuration: Double = 0.1

    /// Scale the fading background of glowing indicator to specified value. Default is `5` (scale to 5 times bigger before disappear)
    public var glowingIndicatorBackgroundScaleEffect: CGFloat = 5

    public var glowingIndicatorDelayBetweenGlow: Double = 0.5
    public var glowingIndicatorGlowAnimationDuration: Double = 0.8

    /// Use laser stroke mode to plot lines.
    ///
    /// Note that your plot will be automatically shrinked so that the blurry part fits inside the canvas.
    public var useLaserLightLinePlotStyle: Bool = false

    /// Use drawing group for laser light mode.
    ///
    /// This will increase responsiveness if there's a lot of segments.
    /// **But, the blurry parts will be clipped off the canvas bounds.**
//    public var useDrawingGroupForLaserLightLinePlotStyle: Bool = false

    /// The edges to fit the line strokes within canvas. This interacts with `plotLineWidth`. Default is `[]`.
    ///
    /// By default only the line skeletons (*paths*) exactly fits in the canvas,** without considering the `plotLineWidth`**.
    /// So when you increase the line width, the edge of the extreme values could go out of the canvas.
    /// You can provide a set of edges to consider to adjust to fit in canvas.
    public var adjustedEdgesToFitLineStrokeInCanvas: Edge.Set = []

    // MARK:- RHInteractiveLinePlot

    public var valueStickWidth: CGFloat = 1.2
    public var valueStickColor: Color = .gray

    /// Padding from the highest point of line plot to value stick. If `0`, the top of value stick will be at the same level of the highest point in plot.
    public var valueStickTopPadding: CGFloat = 28

    /// Padding from the lowest point of line plot to value stick. If `0`, the end of value stick will be at the same level of the lowest point in plot.
    public var valueStickBottomPadding: CGFloat = 28


    public var spaceBetweenValueStickAndStickLabel: CGFloat = 8

    public static let `default` = RHLinePlotConfig()

    public func custom(f: (inout RHLinePlotConfig) -> Void) -> RHLinePlotConfig {
        var new = self
        f(&new)
        return new
    }
}- Dragging in the interactive plot consumes all the gestures. If you put it in a
ScrollView, you can't scroll the scroll view in the interactive plot area, you'd be interacting with the plot instead.
