kube-netc (pronounced kube-net-see) is a Kubernetes network monitor built using eBPF
To test the current capabilities of kube-netc, this guide will walk you through viewing the network statistics of your nodes.
First, install the daemon set using the install.yaml:
kubectl apply -f https://github.com/nirmata/kube-netc/raw/master/config/install.yaml
This will start the kube-netc DaemonSet on your cluster and setup the required roles. Then, we get the name of the kube-netc pod:
kubectl get pods --all-namespaces | grep kube-netc
For example, my kube-netc pod is:
kube-netc-j56cx
In a new terminal, we port-forward the port of our pod so we can access it with curl outside the cluster with:
kubectl port-forward kube-netc-j56cx 9655:9655
9655 is the port we are going to access the Prometheus endpoint on. We can then curl the /metrics endpoint using curl on local host to show the Prometheus metrics:
curl localhost:9655/metrics | grep bytes_recv{
This is an example output of the query showing the total bytes received by this node from each given connection:
...
bytes_recv{component="kube-controller-manager",destination_address="172.18.0.2:1640",destination_kind="pod",destination_name="kube-controller-manager-drewcluster-control-plane",destination_namespace="kube-system",destination_node="drewcluster-control-plane",instance="",managed_by="",name="",part_of="",source_address="172.18.0.2",source_kind="pod",source_name="kube-controller-manager-drewcluster-control-plane",source_namespace="kube-system",source_node="drewcluster-control-plane",version=""} 2960
bytes_recv{component="kube-controller-manager",destination_address="172.18.0.2:38256",destination_kind="pod",destination_name="kube-controller-manager-drewcluster-control-plane",destination_namespace="kube-system",destination_node="drewcluster-control-plane",instance="",managed_by="",name="",part_of="",source_address="172.18.0.2",source_kind="pod",source_name="kube-controller-manager-drewcluster-control-plane",source_namespace="kube-system",source_node="drewcluster-control-plane",version=""} 295276
bytes_recv{component="kube-controller-manager",destination_address="172.18.0.2:38258",destination_kind="pod",destination_name="kube-controller-manager-drewcluster-control-plane",destination_namespace="kube-system",destination_node="drewcluster-control-plane",instance="",managed_by="",name="",part_of="",source_address="172.18.0.2",source_kind="pod",source_name="kube-controller-manager-drewcluster-control-plane",source_namespace="kube-system",source_node="drewcluster-control-plane",version=""} 178
bytes_recv{component="kube-controller-manager",destination_address="172.18.0.2:38446",destination_kind="pod",destination_name="kube-controller-manager-drewcluster-control-plane",destination_namespace="kube-system",destination_node="drewcluster-control-plane",instance="",managed_by="",name="",part_of="",source_address="172.18.0.2",source_kind="pod",source_name="kube-controller-manager-drewcluster-control-plane",source_namespace="kube-system",source_node="drewcluster-control-plane",version=""} 276120
bytes_recv{component="kube-controller-manager",destination_address="172.18.0.2:38448",destination_kind="pod",destination_name="kube-controller-manager-drewcluster-control-plane",destination_namespace="kube-system",destination_node="drewcluster-control-plane",instance="",managed_by="",name="",part_of="",source_address="172.18.0.2",source_kind="pod",source_name="kube-controller-manager-drewcluster-control-plane",source_namespace="kube-system",source_node="drewcluster-control-plane",version=""} 39315
bytes_recv{component="kube-controller-manager",destination_address="172.18.0.2:38460",destination_kind="pod",destination_name="kube-controller-manager-drewcluster-control-plane",destination_namespace="kube-system",destination_node="drewcluster-control-plane",instance="",managed_by="",name="",part_of="",source_address="172.18.0.2",source_kind="pod",source_name="kube-controller-manager-drewcluster-control-plane",source_namespace="kube-system",source_node="drewcluster-control-plane",version=""} 122540
bytes_recv{component="kube-controller-manager",destination_address="172.18.0.2:38496",destination_kind="pod",destination_name="kube-controller-manager-drewcluster-control-plane",destination_namespace="kube-system",destination_node="drewcluster-control-plane",instance="",managed_by="",name="",part_of="",source_address="172.18.0.2",source_kind="pod",source_name="kube-controller-manager-drewcluster-control-plane",source_namespace="kube-system",source_node="drewcluster-control-plane",version=""} 3382
...
As we see the bytes received by each connection is shown and the source IP is given. If there is a known pod, node or service with the same IP, the source_name and or destination_name is also given.
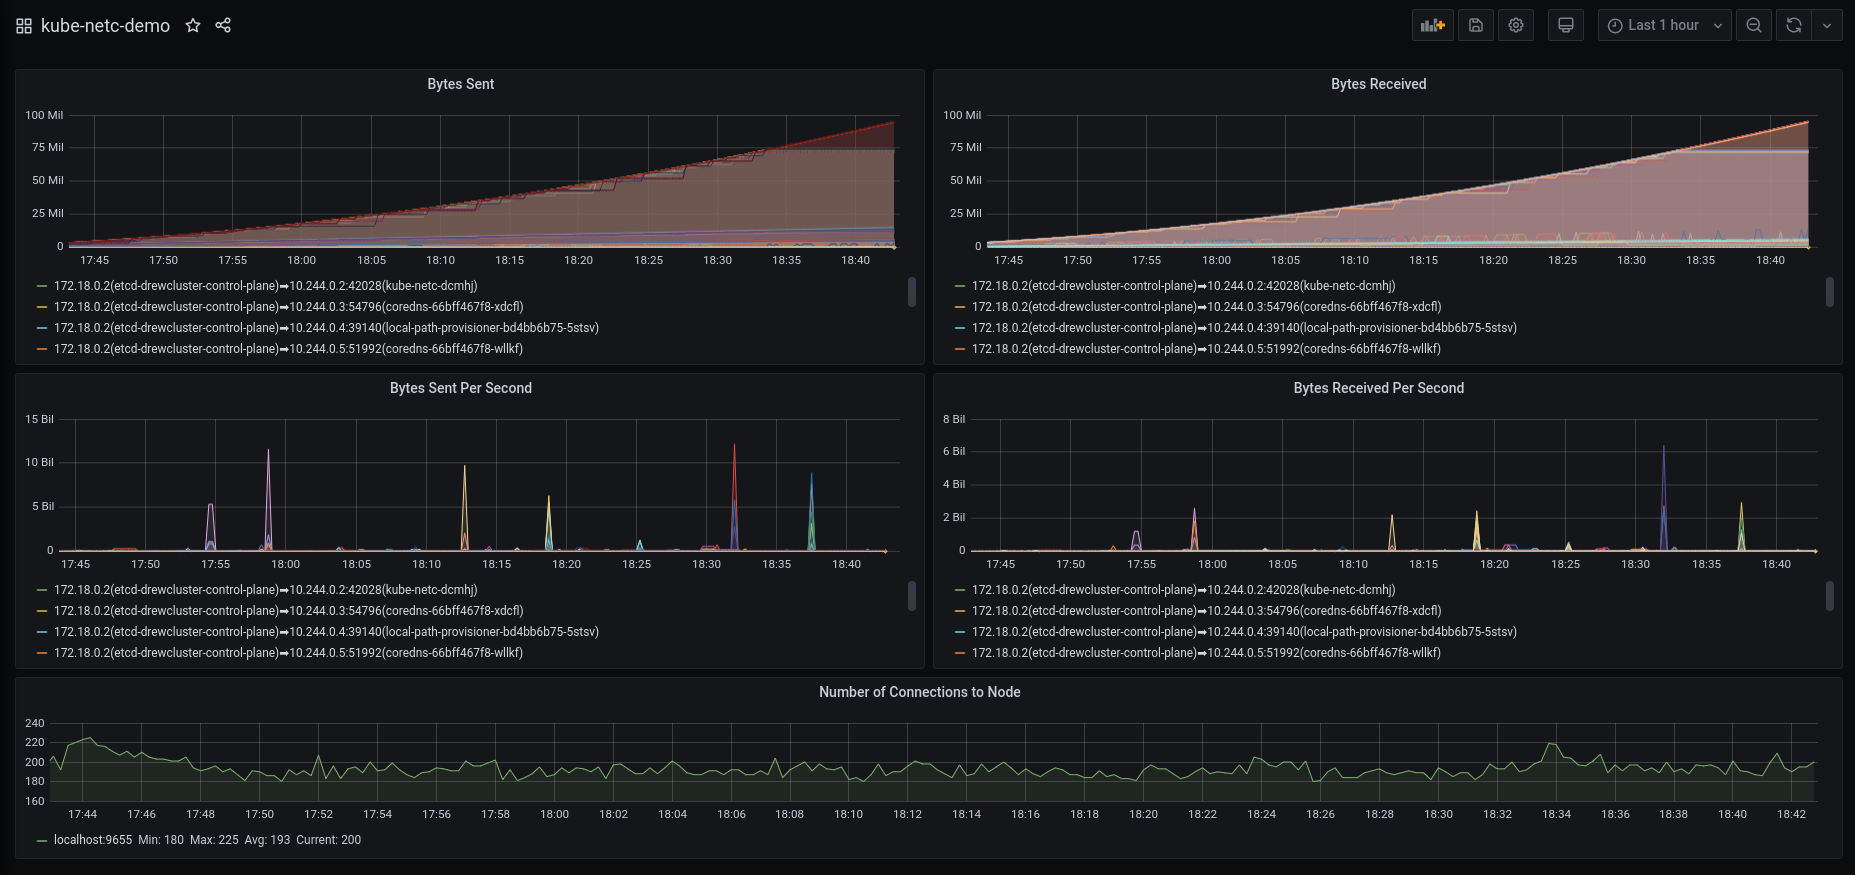
There is a pre-prepared Grafana dashboard so you can test out kube-netc yourself and visualize the reported stats.
Make sure to point Prometheus to the kube-netc exporter in your configuration by appending a new job to your scrape_configs in your prometheus.yml:
- job_name: 'kube-netc'
    static_configs:
    - targets: ['localhost:9655']
Then you can start Prometheus and import the dashboard into Grafana.
Please see the DESIGN for information on how kube-netc is structured.
Special thanks to Alban from Kinvolk for his assistance with implementing eBPF and DataDog for their eBPF library.
