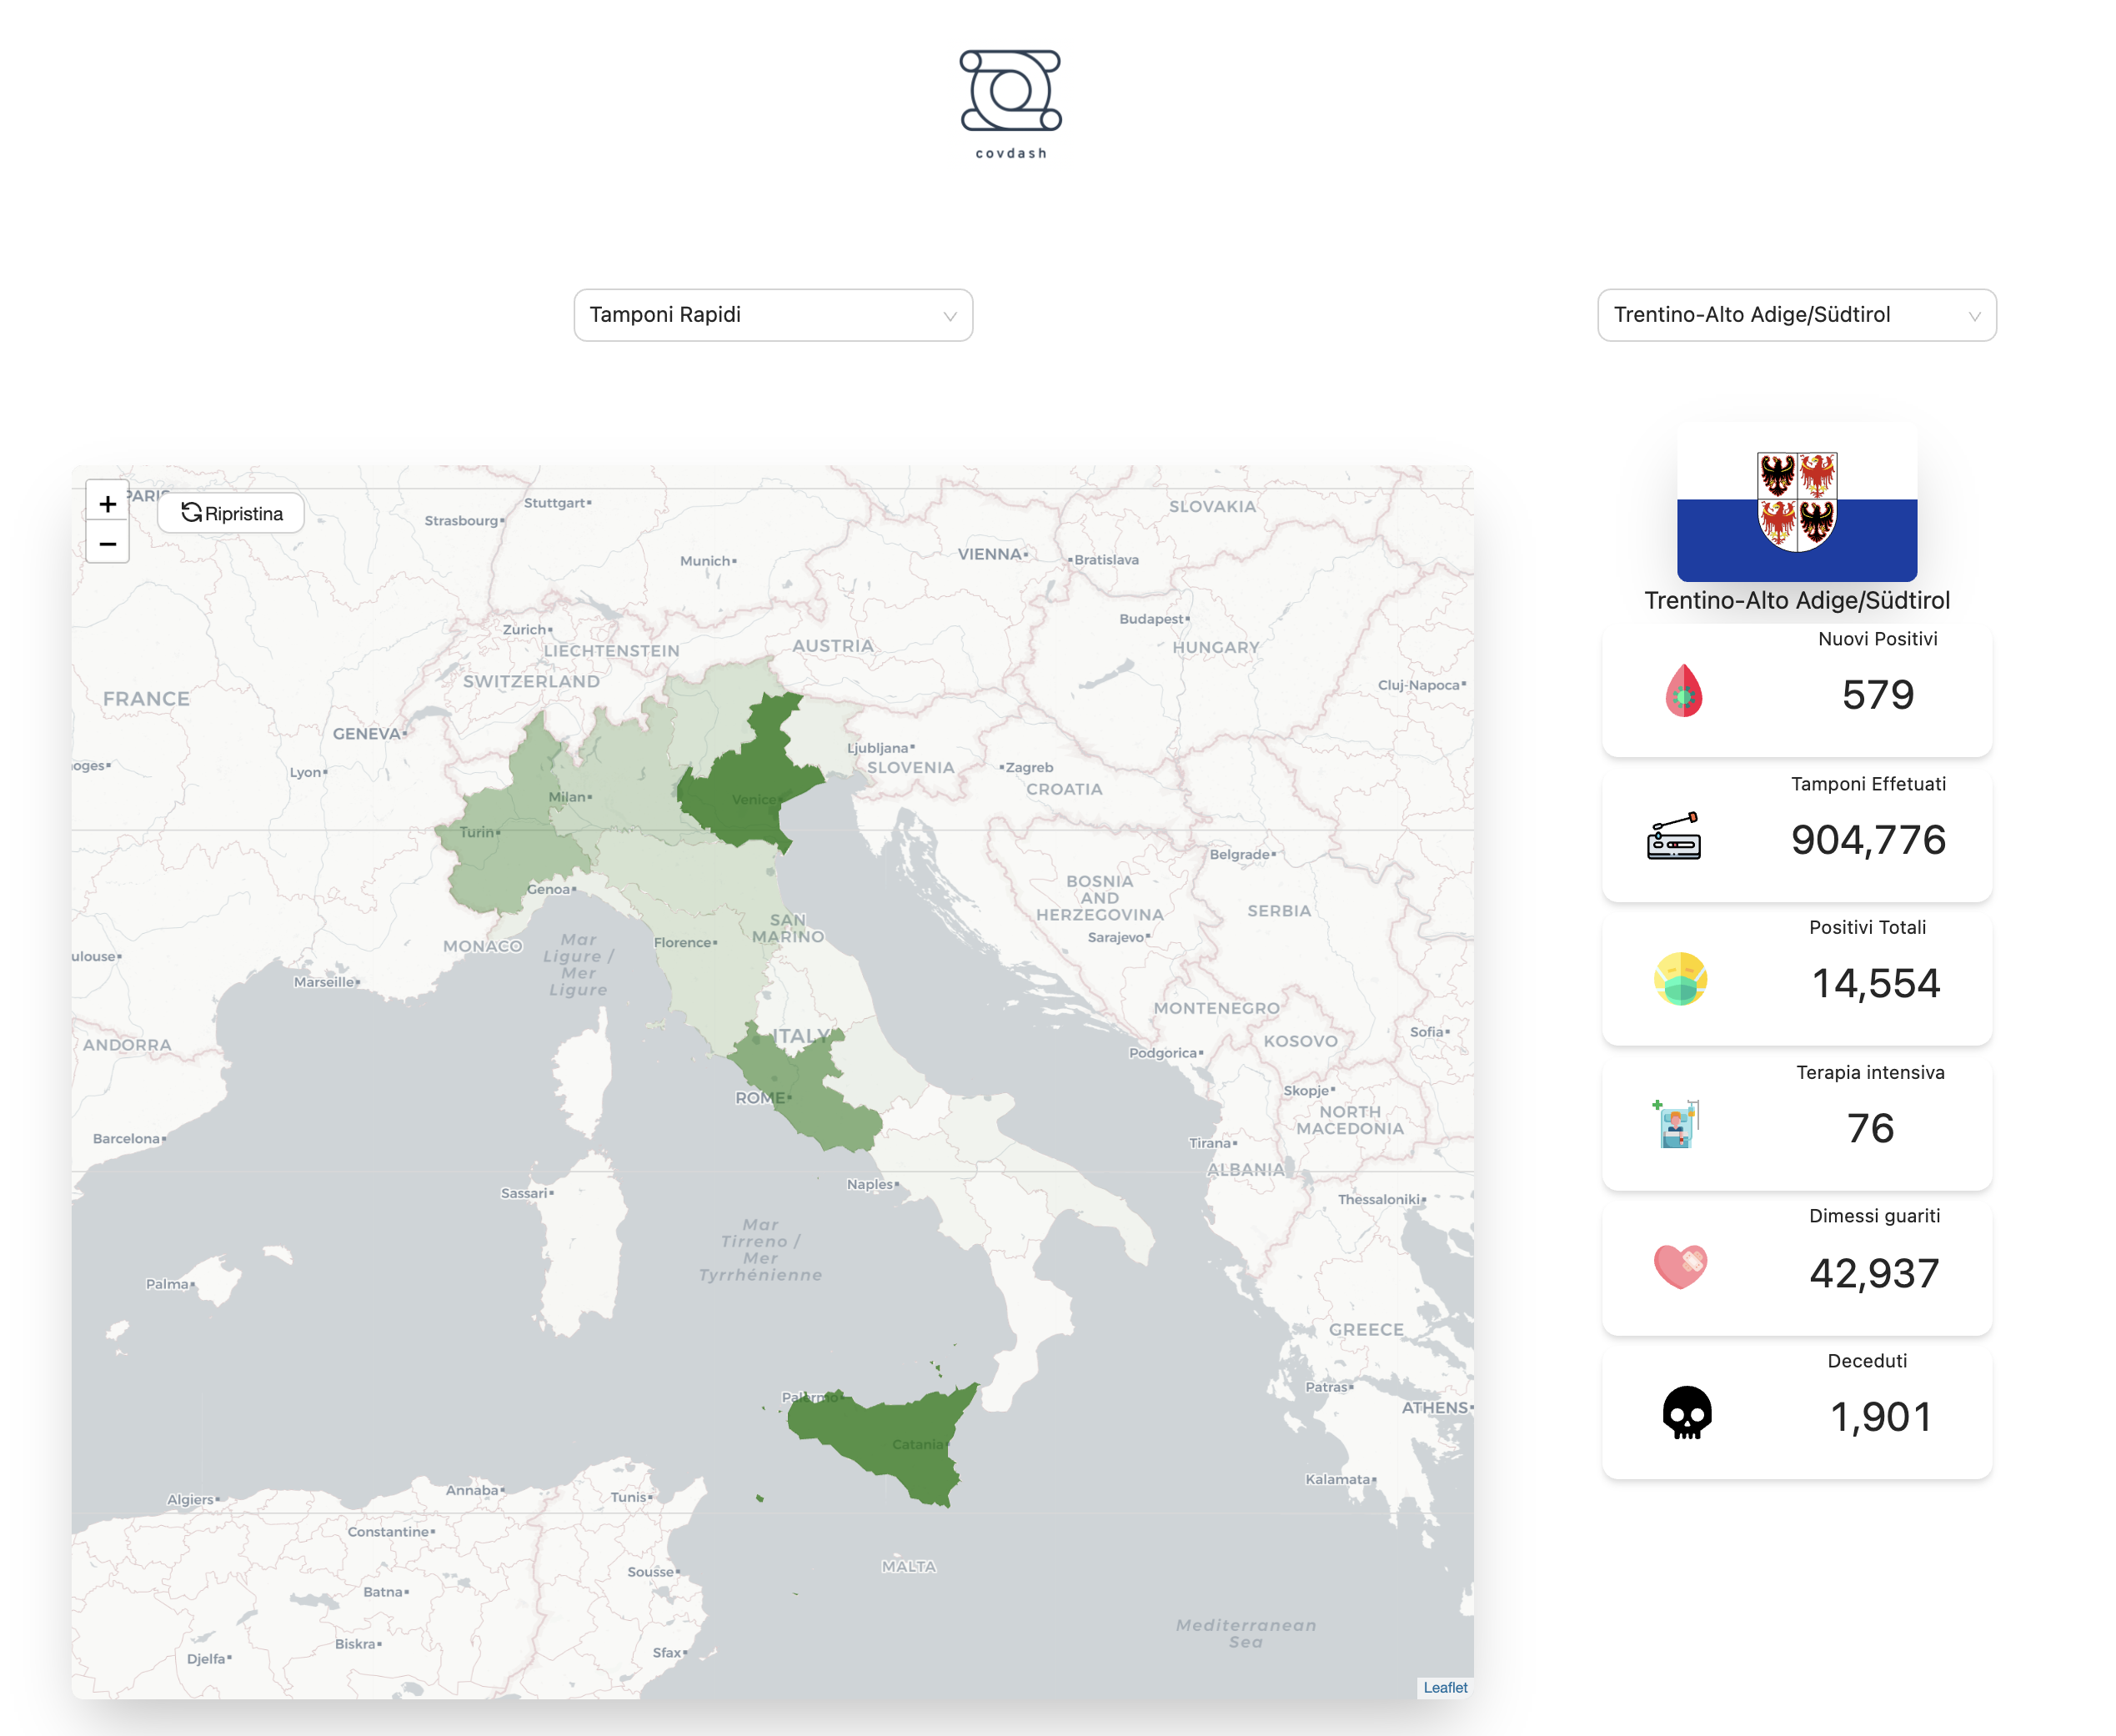
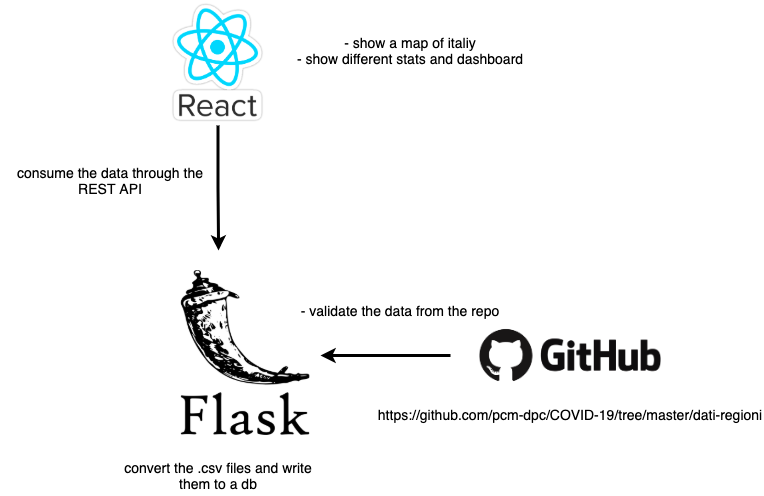
The intent of the project is to have a dashboard that would show a map of Italy as well as other data regarding the covid pandemic.
github repo -> azure static website is deployed through github actions
deploying python flask app to azure
- tailwind css
- antd
- react-leaflet for map
- showing a map of italy, with each regions and the stats (using leaflet with mapbox for colors)
- charts about the data using (using nivo rocks or something similar)
- dark theme react using react context api
- add the instructions for each region and zone color in own custom part
- maybe if we have enough time add google analytics to the project
for now this is what we want to have 1 class component the rest is stateless is at the highest level
stateful, selectedProperty (filter: deceduti, morti, ...) selectedRegion (Lazio, Piemonte ...) and fetchs the region data when it mounts (class component) - stateless, sets a state of the selectedProperty. (functional component) - stateless, contains a map of italy. (must use hooks, because of the library) - stateless, shows the properties - stateless - stateless shows the graph, is not affected by selectedRegion, only by selectedProperty - toggles between dark mode
In order to start the scraping
# run tests
pytest -s

# running the program
python3 -m crawling.crawling_script
this will create a new folder called data with the csv and geojson subfolders inside of it
. /venv/bin/activate

flask run
run tests from backend folder
pytest
FLASK_APP=app.py FLASK_ENV=development flask run
-
depending on the scraper, see if it's easier in python
-
scrape the stats from the covid repo data
-
once it is scraped, save to our elasticsearch node that goes through a server written in dotnet core
-
convert csv files into geojson files.
-
write some testing before hand, try to give it bad csv files, if it goes wrong, email the dev or alert him somehow (this is a critical feature, erros in this will damage data integrity across the systems) !
-
maybe scrape some other data from other sources if we have enough time
-
add APM to elasticsearch to catch exceptions
- elasticsearch for the data we crawled
- hosting the website on a real production website hosted on aruba cloud
- nginx proper configuration
- ssl properly configured with LetsEncrypt certificates
- use local version of kibana to check out and play with the data.
- do backend first, then frontend, and finally deploy on cloud
- there is no authentication, since we are designing something that should in theory be accessible to the public. It wouldn't make sense to have an auth gateway except for analytics.
- We could use mongo as a db, but we wouldn't be able to include kibana's visualizations easy (we would need to do something like .net => mongodb => elasticsearch).
- .Net Core was chosen because of familiarity and it is considered a relatively fast and reliable backend server technology.
- React was chosen because of familiarity and it seemed suitable for the task.
- geojson format
- covid data for each region
- governo italiano
- leaflet tutorial for maps
- top chart libraries for react
Feel free to contribute and submit pull requests, and propose any suggestions regarding anything about the project.


