npm start- runs the app in the development mode. Open http://localhost:3000 to view it in the browser;startServer- runs a NodeJS server which listens to8080port on http requests and WebSocket connections ( path:/ws);build- builds the app for production to thebuildfolder;test:ut:watch- runsjesttesting environment in a watch mode and executes all available unit tests;test:ut- as above, but it executes UTs in a single run;test:it:dev- builds the application, opens a server which serves the static assets frombuilddirectory and opens the Cypress Test Runner;test:it- as above, but it doesn't run the Cypress Test Runner, but the ITs are executed in a single run;eslint- performs static code analysis.
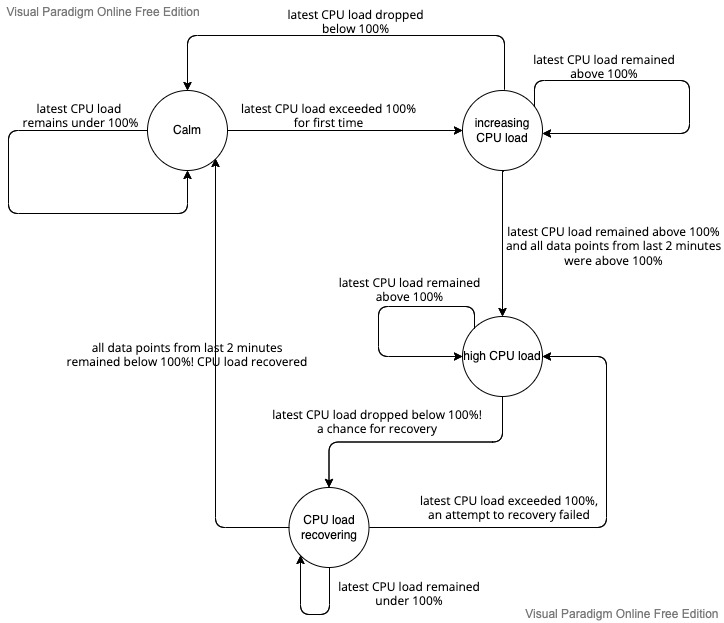
The alerting logic is described by the above diagram. The feature's state is a state machine. Its correctness is
verified by unit tests in the file: ./src/state/reducers.test.ts.
Only reducers (including the transitions between state machine's states) are covered by unit tests.
Integration tests mocks the back-end and verify the application from the user perspective. Tests cases are not independent of each other - their order describes a certain test scenario.
Things to improve related specifically to application (UI/UX) design:
- improve layout responsiveness;
- add an ability to switch to the dark mode;
- add an ability to switch to the compact mode (smaller font sizes, spacings etc.);
Nice-to-have feature propositions:
- add an ability to re-arrange the position and size of the panels on Dashboard as user wishes;
- add an ability to pick a custom time ranges on all panels (that would require B/E support);
- add more options to customize visual aspects of the panels (background color, text colors, stylize time series etc.);
- improve alerting feature - browser should trigger browser notifications so that user knows that CPU is under heavy load even if she/he is not on the app's tab;
- add an ability to customize parameters / thresholds such as 10 seconds (data points fetching frequency) or 2 minutes ( duration used in alerting logic) or 0 % - 60 % - 100 % (low/medium/high CPU load thresholds);
Reactas the application view layer tool,Reduxas a state management tool,cypressfor integration tests,jestfor unit tests,create-react-appas a tool for generating a project scaffolding,WebSocket APIas a communication protocol, which provides with full-duplex communication channel over a single TCP connection between F/E and B/E,canvasJSfor time series visualisation,ag-gridfor data table visualisation.
NodeJS+express,nginx,certbot+Let's encryptcertificate authority for generating a SSL/TSL certificate.
- the application is deployed e2e on
AWS: https://cpu-load-monitoring.com/, - used services:
AWS EC2,AWS Route53, - used
Sumo Logic Real User Monitoring, - configured
Github Actionsworkflow, which runseslint, unit and integration tests.
- add logging to the server
