In 2016 summer I planed to buy an apartment in Shanghai. At that time lianjia.com is popular for viewing apartments info online. So I want to keep track of apartments' price changes from lianjia, with a tool. Then comes this crawler.
BTW, before the crawler was finished and came to use, I've bought one in three days...
Search for all apartment in a region, with various contraints.

Search for community in a region, with all kinds of statistical data.

Search for apartments' price change.

Prerequisites includes installing python/MySQL/Apache server and necessary python modules. Choose according to your OS.
Mac OS X Ubuntu Centos Windows 7
In lianjia_crawler_conf.py, perform configuration changes according to comments.
-
Check MySQL configurations in MySQL_conf, set connection parameters. Be careful about the user/password. Confirm it with "mysql -u root -p" to log into MySQL, if you use root.
-
Create a database named lianjia in MySQL with command "CREATE DATABASE lianjia".
-
Define the regions you are caring about in region_def.
- In shell, run "chmod u+x lianjia_crawler.py" and "./lianjia_crawler.py".
- On Mac OS/Linux, Use cron to schedule the crawler running every day. Here is an example from Mac OS X.
- Create a shell script, setting the Python path. Like file name lianjia_crawler.sh, with content,
#!/bin/bash
export PATH=/opt/local/Library/Frameworks/Python.framework/Versions/2.7/bin: $PATH
/Users/xyz/lianjia/lianjia_crawler.py >> /Users/xyz/lianjia/lianjia_crawler.log 2>&1- Install task in cron with "sudo crontab -e", run the script 12:00 every day.
00 12 * * * /Users/xyz/lianjia/lianjia_crawler.sh
- In browser(recommend Chrome!), type in "localhost" as the address.
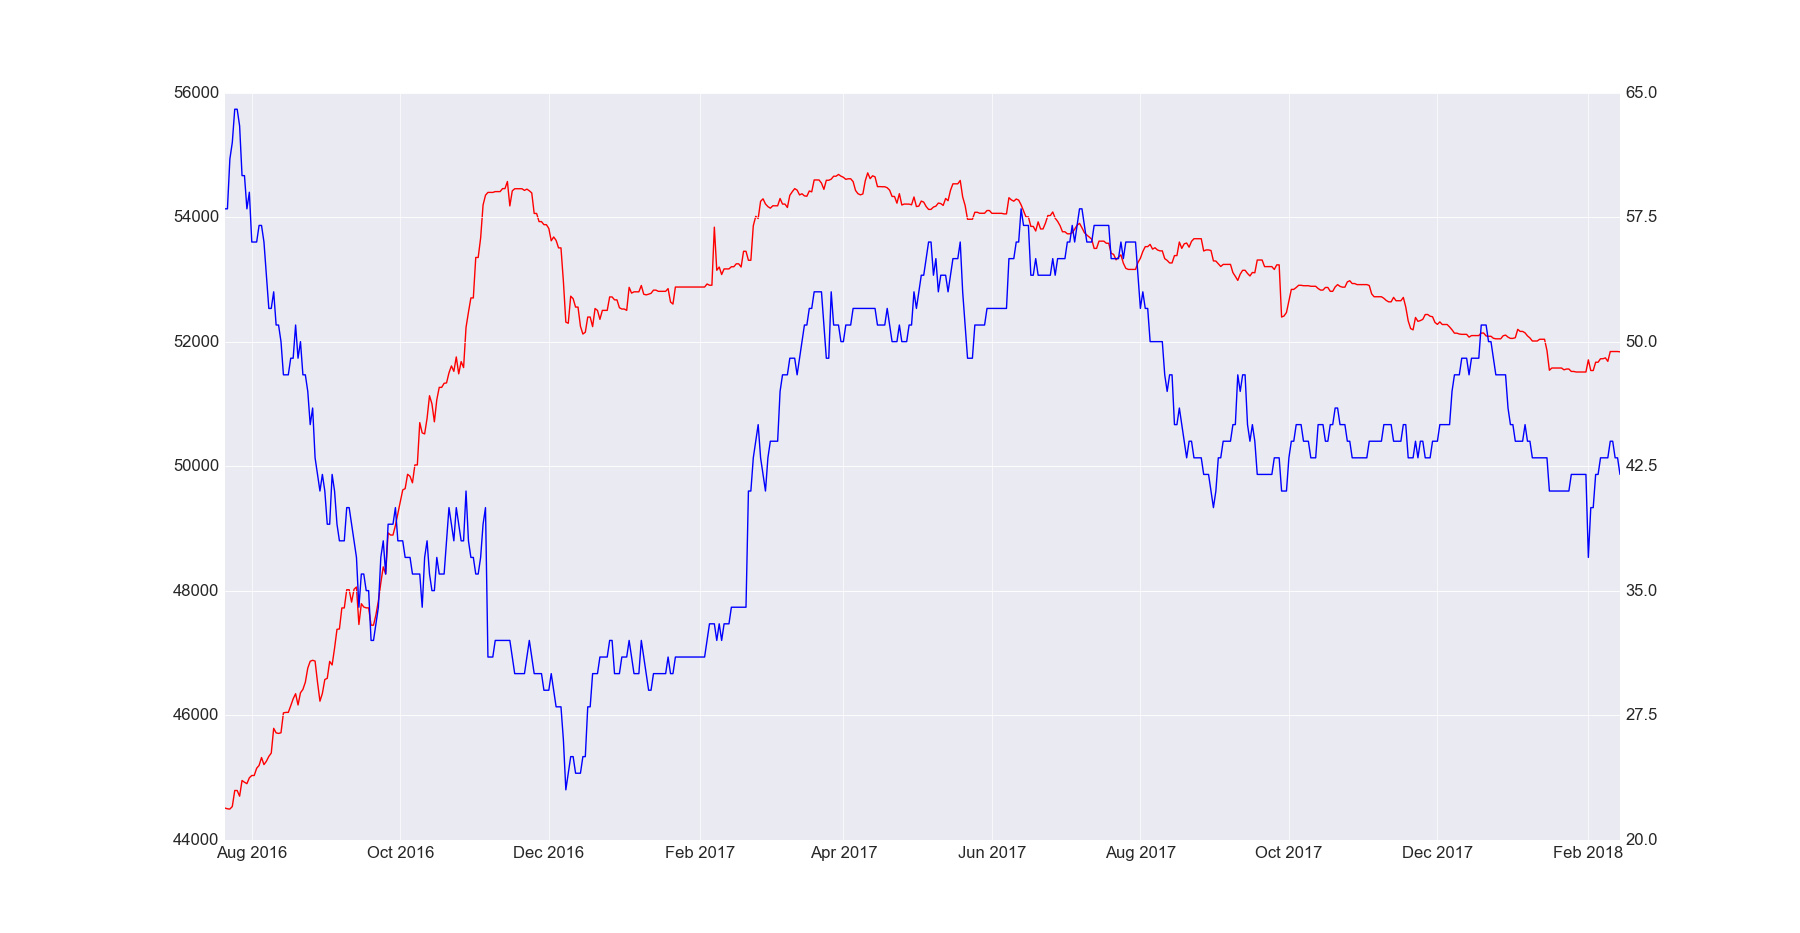
- With script lianjia_avg.py, you can check how price going in the past. Here one example figure, red line is the price change, while the blue line stands for the change of the number of apartments listed.
- Export data to CSV file

SELECT location, size, price FROM ly_data INTO OUTFILE '/Users/xyz/xx' FIELDS TERMINATED BY ',';