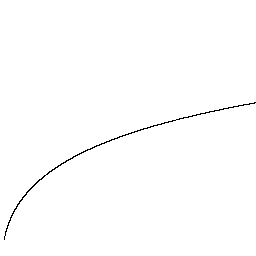
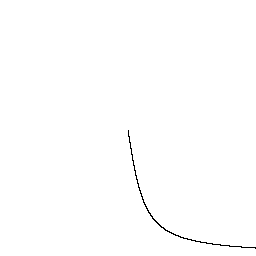
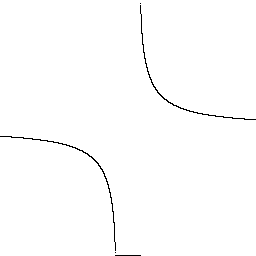
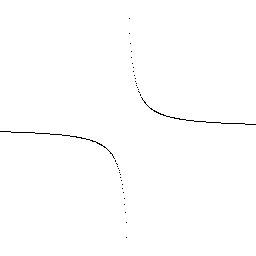
elemapprox user manual
| Title | elemapprox (Elementary functions approximation in ANSI C, Verilog HDL, and VHDL) |
| Author | Nikolaos Kavvadias (C) 2013-2021 |
| Contact | nikolaos.kavvadias@gmail.com |
| Website | http://www.nkavvadias.com |
| Release Date | 24 April 2021 |
| Version | 1.4.2 |
| Rev. history | |
| v1.4.2 | 2021-04-24 Fix plots for |
| v1.4.1 | 2017-07-03 Add |
| v1.4.0 | 2017-07-01 Add |
| v1.3.3 | 2016-08-22 Add |
| v1.3.2 | 2016-02-27 Fix ASCII rendering of function plots in the documentation. |
| v1.3.1 | 2015-12-25 Documentation updated with function plot examples. |
| v1.3.0 | 2014-10-12 Added |
| v1.2.0 | 2014-10-10 Added |
| v1.1.0 | 2014-10-07 Added VHDL version for approximating and plotting the elementary functions. Numerous documentation fixes. |
| v1.0.1 | 2014-09-24 Minor documentation corrections. |
| v1.0.0 | 2014-09-16 Initial release. This is an expanded version built upon Mark G. Arnold's Verilog Transcendental Functions paper. |
1. Introduction
elemapprox is an ANSI C code, Verilog HDL and VHDL collection of modules
(Verilog HDL) and packages (VHDL) that provide the capability of evaluating and
plotting transcendental functions by evaluating them in single precision. The
original work supports ASCII plotting of a subset of the functions; this version
provides a more complete list of functions in addition to bitmap plotting for
the transcendental functions as PBM (monochrome) image files.
elemapprox has been conceived as an extension to Prof. Mark G. Arnold's work
as puhlished in HDLCON 2001. Most functions have been prefixed with the letter
k in order to avoid function name clashes in both ANSI C and VHDL standard-
based implementations. Currently, the plain VHDL version, vhdl uses unprefixed
names (e.g., acos instead of kacos). The vhdlieee version
is compatible to the IEEE.math_real package and features prefixed names.
1.1 Implementations
The following table summarizes the implemented versions in C, VHDL and Verilog HDL.
| Implementation | Description |
ansic |
ANSI C version with custom approximations |
ansicstd |
ANSI C version using math.h |
verilog |
Verilog version with custom approximations |
verilogieee |
Verilog 2005 version with the new arithmetic system functions |
vhdl |
VHDL version with custom approximations |
vhdlieee |
VHDL version using IEEE.math_real |
1.2 Implemented functions
The transcendental functions supported include most elementary functions
(hence the name elemapprox) and the list is as follows:
| Function | Description |
kfabs(x) |
Floating-point absolute value (helper function). |
kfmax(x,y) |
Floating-point maximum value (helper function). |
kfmin(x,y) |
Floating-point minimum value (helper function). |
kfloor(x) |
Floating-point floor (helper function). |
kceil(x) |
Floating-point ceiling (helper function). |
kround(x) |
Floating-point round-to-nearest (helper function). |
ktrunc(x) |
Floating-point truncation (helper function). |
kfmod(x,y) |
Floating-point modulo. |
rootof2(x) |
Calculate root-of-2 (not in vhdlieee,
verilogieee and ansicstd). |
kacos(x) |
Arc cosine. |
kacosh(x) |
Inverse hyperbolic cosine. |
kacot(x) |
Arc cotangent. |
kacoth(x) |
Inverse hyperbolic cotangent. |
kacsc(x) |
Arc cosecant. |
kacsch(x) |
Inverse hyperbolic cosecant. |
kasec(x) |
Arc secant. |
kasech(x) |
Inverse hyperbolic secant. |
kasin(x) |
Arc sine. |
kasinh(x) |
Inverse hyperbolic sine. |
katan(x) |
Arc tangent. |
katan2(y,x) |
Two-argument (x/y) arc tangent. |
katanh(x) |
Inverse hyperbolic tangent. |
kcos(x) |
Cosine. |
kcosh(x) |
Hyperbolic cosine. |
kcot(x) |
Cotangent. |
kcoth(x) |
Hyperbolic cotangent. |
kcsc(x) |
Cosecant. |
kcsch(x) |
Hyperbolic cosecant. |
kexp(x) |
Exponential. |
khypot(x,y) |
Hypotenuse. |
klog(x) |
Natural logarithm. |
kpow(x,y) |
Powering function. |
ksec(x) |
Secant (named secant in the plain VHDL port). |
ksech(x) |
Hyperbolic secant. |
ksin(x) |
Sine. |
ksinh(x) |
Hyperbolic sine. |
ksqrt(x) |
Square root. |
kcbrt(x) |
Cube root. |
ktan(x) |
Tangent. |
ktanh(x) |
Hyperbolic tangent. |
The reference paper and the corresponding presentation are available from the web at the following links:
- https://web.archive.org/web/20100515000000*/http://www.cse.lehigh.edu/~caar/marnold/papers/sanjose_hdlcon.doc
- https://web.archive.org/web/20100415000000*/http://www.cse.lehigh.edu/~caar/marnold/presentations/freeddy.ppt
Since the original links have been removed, the files are now only accessible from the Internet Archive.
2. File listing
The elemapprox C code implementation and Verilog HDL modules include the
following files:
| /elemapprox | Top-level directory |
| AUTHORS | List of authors. |
| LICENSE | License argeement (Modified BSD license). |
| README.rst | This file. |
| README.html | HTML version of README. |
| README.pdf | PDF version of README. |
| rst2docs.sh | Bash script for generating the HTML and PDF versions. |
| VERSION | Current version. |
| /ansic | ANSI C implementation (standalone) |
| clean-math-ansic.sh | Bash script for cleaning up the generated executables. |
| elemapprox.c | C code for the function approximations. |
| Makefile | GNU Makefile for building testfunc.exe. |
| plot-ansic-ascii.sh | Bash script for plotting the elementary functions
as ASCII graphs using testfunc.exe. |
| plot-ansic-pbm.sh | Bash script for plotting the elementary functions
as PBM images using testfunc.exe. |
| test<func>.pbm | Generated PBM image data for the function <func>. |
| test<func>.txt | Generated ASCII graph data for the function <func>. |
| test<func>-ascii.txt | Concatenation of the generated ASCII graph data for all supported functions. |
| /ansicstd | ANSI C implementation (based on math.h) |
| clean-math-ansic.sh | Bash script for cleaning up the generated executables. |
| elemapprox.c | C code for the function approximations. |
| Makefile | GNU Makefile for building testfunc.exe. |
| plot-ansic-ascii.sh | Bash script for plotting the elementary functions
as ASCII graphs using testfunc.exe. |
| plot-ansic-pbm.sh | Bash script for plotting the elementary functions
as PBM images using testfunc.exe. |
| test<func>.pbm | Generated PBM image data for the function <func>. |
| test<func>.txt | Generated ASCII graph data for the function <func>. |
| test<func>-ascii.txt | Concatenation of the generated ASCII graph data for all supported functions. |
| /common | Common files |
| /common/ansic | Common files for the C implementations |
| elemapprox.h | C header file for the above. Defines certain mathematical constants and declares function prototypes. |
| funcplot.c | Reference code for creating the plot data for the functions. |
| funcplot.h | C header file for the above. |
| graph.c | Collection of ASCII and PBM graphing functions. |
| graph.h | C header file for the above. |
| /common/scripts | Scripts for common use |
| diff-ascii.sh | Compare the results from ASCII plots between two different implementations (directories) |
| pbm2png.sh | Convert PBM to PNG images with ImageMagick's
convert. |
| /common/verilog | Common files for the Verilog implementations |
| funcplot.v | Reference code for creating the plot data for the functions. |
| graph.v | Collection of ASCII and PBM graphing tasks. |
| testfunc.v | Application code for the elementary functions. Options include PBM or ASCII image generation and function selection. |
| /common/vhdl | Common files for the VHDL implementations |
| graph.vhd | VHDL package code with a collection of ASCII and PBM procedures. |
| testfunc.vhd | VHDL testbench code for the elementary functions. Options include PBM or ASCII image generation and function selection through a configuration file. |
| /verilog | Verilog HDL implementation |
| clean-math-verilog.sh | Bash script for cleaning up the generated interpreted intermediate code (for Icarus Verilog). |
| constants.v | Certain mathematical constants. |
| elemapprox.v | Verilog HDL code for the function approximations. |
| plot-verilog-ascii.sh | Bash script for plotting the elementary functions
as ASCII graphs using testfunc.v. The script
Icarus Verilog' VVP interpreter which is capable of
parsing command-line options. |
| plot-verilog-pbm.sh | Bash script for plotting the elementary functions
as PBM images using testfunc.v. |
| test<func>.pbm | Generated PBM image data for the function <func>. |
| test<func>.txt | Generated ASCII graph data for the function <func>. |
| test<func>-ascii.txt | Concatenation of the generated ASCII graph data for all supported functions. |
| /verilogieee | Verilog 2005 implementation |
| clean-math-verilog.sh | Bash script for cleaning up the generated interpreted intermediate code (for Icarus Verilog). |
| elemapprox.v | Verilog HDL code for the function approximations. |
| plot-verilog-ascii.sh | Bash script for plotting the elementary functions
as ASCII graphs using testfunc.v. The script
Icarus Verilog' VVP interpreter which is capable of
parsing command-line options. |
| plot-verilog-pbm.sh | Bash script for plotting the elementary functions
as PBM images using testfunc.v. |
| test<func>.pbm | Generated PBM image data for the function <func>. |
| test<func>.txt | Generated ASCII graph data for the function <func>. |
| test<func>-ascii.txt | Concatenation of the generated ASCII graph data for all supported functions. |
| /vhdl | VHDL implementation |
| elemapprox.do | Modelsim .do macro file for Modelsim simulation. |
| elemapprox.mk | GNU Makefile for running the testbench using GHDL. |
| elemapprox.vhd | VHDL package code for the function approximations and related mathematical constants. |
| funcplot.vhd | VHDL package code for creating the plot data for the elementary functions. |
| plot-ghdl-ascii.sh | Bash script for plotting the elementary functions
as ASCII graphs using GHDL. The script generates a
configuration file (config.txt) for controlling
the simulation. |
| plot-ghdl-pbm.sh | Bash script for plotting the elementary functions
as PBM images using GHDL. The script generates a
configuration file (config.txt) for controlling
the simulation. |
| plot-mti-ascii.sh | Bash script for plotting the elementary functions
as ASCII graphs using Modelsim. The script generates
a configuration file (config.txt) for controlling
the simulation. |
| plot-mti-pbm.sh | Bash script for plotting the elementary functions
as PBM images using Modelsim. The script generates
a configuration file (config.txt) for controlling
the simulation. |
| test<func>.pbm | Generated PBM image data for the function <func>. |
| test<func>.txt | Generated ASCII graph data for the function <func>. |
| test<func>-ascii.txt | Concatenation of the generated ASCII graph data for all supported functions. |
| /vhdlieee | VHDL implementation compatible to IEEE.math_real |
| elemapprox.do | Modelsim .do macro file for Modelsim simulation. |
| elemapprox.mk | GNU Makefile for running the testbench using GHDL. |
| elemapprox.vhd | VHDL package code for the function approximations and related mathematical constants. |
| funcplot.vhd | VHDL package code for creating the plot data for the elementary functions. |
| plot-ghdl-ascii.sh | Bash script for plotting the elementary functions
as ASCII graphs using GHDL. The script generates a
configuration file (config.txt) for controlling
the simulation. |
| plot-ghdl-pbm.sh | Bash script for plotting the elementary functions
as PBM images using GHDL. The script generates a
configuration file (config.txt) for controlling
the simulation. |
| plot-mti-ascii.sh | Bash script for plotting the elementary functions
as ASCII graphs using Modelsim. The script generates
a configuration file (config.txt) for controlling
the simulation. |
| plot-mti-pbm.sh | Bash script for plotting the elementary functions
as PBM images using Modelsim. The script generates
a configuration file (config.txt) for controlling
the simulation. |
| test<func>.pbm | Generated PBM image data for the function <func>. |
| test<func>.txt | Generated ASCII graph data for the function <func>. |
| test<func>-ascii.txt | Concatenation of the generated ASCII graph data for all supported functions. |
| /refs | Reference documentation |
| sanjose_hdlcon.doc | MS Word document for the manuscript: M. G. Arnold, C. Walter and F. Engineer, "Verilog Transcendental Functions for Numerical Testbenches," Proceedings of the Tenth International HDL conference, Santa Clara, California, March 1, 2001. |
| freeddy.ppt | MS PowerPoint presentation of the above work. |
3. Usage
Both the ANSI C and Verilog HDL versions can be used for generating graph data and depicting any of the supported transcendental functions via two similar scripts.
3.1 ANSI C
- Run the following shell script from a Unix/Linux/Cygwin command line in order to generate an ASCII graph for each function.
$ cd ansicor
$ cd ansicstdfollowed by
$ ./plot-ansic-ascii.shAll generated data are also concatenated to testfunc-ascii.txt.
- Run the following shell script from a Unix/Linux/Cygwin command line in order to generate a PBM image for each function.
$ ./plot-ansic-pbm.shAll generated data are saved in the form of PBM (monochrome bitmap) image files.
Such files can be visualized using, e.g., the public domain Imagine viewer:
http://www.nyam.pe.kr/ on Windows or eog (Eye of Gnome) on Debian-based
Linux distributions (for instance, Ubuntu).
3.2 Verilog HDL
- Run the following shell script from a Unix/Linux/Cygwin command line in order to generate an ASCII graph for each function.
$ cd verilogor
$ cd verilogieeefollowed by
$ ./plot-verilog-ascii.shAll generated data are also concatenated to testfunc-ascii.txt.
- Run the following shell script from a Unix/Linux/Cygwin command line in order to generate a PBM image for each function.
$ ./plot-verilog-pbm.shAll generated data are saved in the form of PBM (monochrome bitmap) image files.
3.3 VHDL
The VHDL version of elemapprox supports both GHDL (http://ghdl.free.fr) and
Mentor Modelsim (http://www.model.com).
3.3.1 GHDL
- Run the following shell script from a Unix/Linux/Cygwin command line in order to generate an ASCII graph for each function.
$ cd vhdlor
$ cd vhdlieeefollowed by
$ ./plot-ghdl-ascii.shAll generated data are also concatenated to testfunc-ascii.txt.
- Run the following shell script from a Unix/Linux/Cygwin command line in order to generate a PBM image for each function.
$ ./plot-ghdl-pbm.shAll generated data are saved in the form of PBM (monochrome bitmap) image files.
3.3.2 Modelsim
- Run the following shell script from a Unix/Linux/Cygwin command line in order to generate an ASCII graph for each function.
$ cd vhdlor
$ cd vhdlieeefollowed by
$ ./plot-mti-ascii.shAll generated data are also concatenated to testfunc-ascii.txt.
- Run the following shell script from a Unix/Linux/Cygwin command line in order to generate a PBM image for each function.
$ ./plot-mti-pbm.shAll generated data are saved in the form of PBM (monochrome bitmap) image files.
4. Synthesis
The implementation code (either ANSI C, Verilog HDL or VHDL) for the transcendental functions has not been tested for high-level or RTL synthesis.
5. Prerequisites
Standard UNIX-based tools (tested with gcc-4.6.2 on MinGW/x86) [optional if you use Modelsim].
- make
- bash (shell)
For this reason, MinGW (http://www.mingw.org) or Cygwin (http://sources.redhat.com/cygwin) are suggested, since POSIX emulation environments of sufficient completeness.
Icarus Verilog simulator (http://iverilog.icarus.com/). The Windows version can be downloaded from: http://bleyer.org/icarus/
GHDL simulator (http://ghdl.free.fr) for VHDL. Both Windows and Linux versions can be downloaded from this site. Updated GHDL releases are available (again for multiple OSes) from: http://sourceforge.net/projects/ghdl-updates/
Alternatively, a commercial simulator like Mentor Modelsim (http://www.model.com) can be used (however this has only been tested for the VHDL version of
elemapprox).
A. Function plot examples
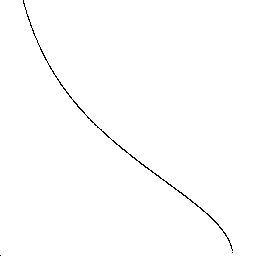
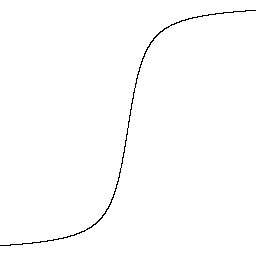
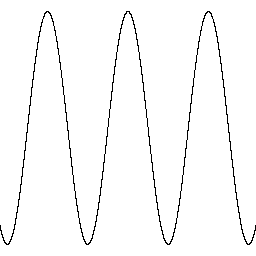
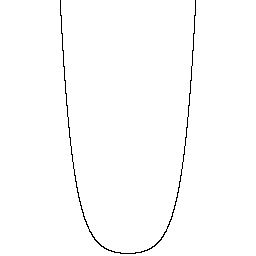
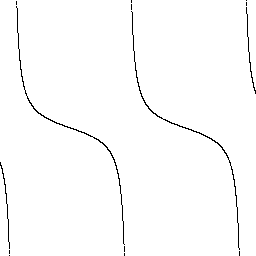
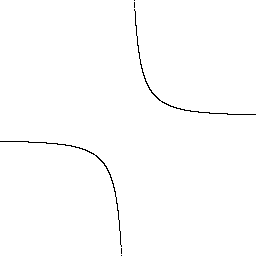
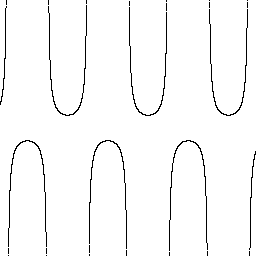
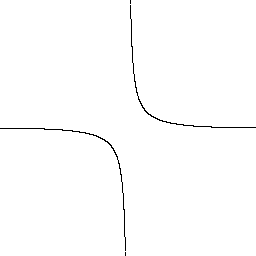
This appendix provides sample function plot visualization as raster graphics (PNG) and ASCII for the elementary functions with provided implementations.
A.1. Arc cosine (acos)
ASCII rendering.
Bitmap rendering.
A.2. Inverse hyperbolic cosine (acosh)
ASCII rendering.
Bitmap rendering.
A.3. Arc cotangent (acot)
ASCII rendering.
Bitmap rendering.
A.4. Inverse hyperbolic cotangent (acoth)
ASCII rendering.
Bitmap rendering.
A.5. Arc cosecant (acsc)
ASCII rendering.
Bitmap rendering.
A.6. Inverse hyperbolic cosecant (acsch)
ASCII rendering.
Bitmap rendering.
A.7. Arc secant (asec)
ASCII rendering.
Bitmap rendering.
A.8. Inverse hyperbolic secant (asech)
ASCII rendering.
Bitmap rendering.
A.9. Arc sine (asin)
ASCII rendering.
Bitmap rendering.
A.10. Inverse hyperbolic sine (asinh)
ASCII rendering.
Bitmap rendering.
A.11. Arc tangent (atan)
ASCII rendering.
Bitmap rendering.
A.12. Inverse hyperbolic tangent (atanh)
ASCII rendering.
Bitmap rendering.
A.13. Cosine (cos)
ASCII rendering.
Bitmap rendering.
A.14. Hyperbolic cosine (cosh)
ASCII rendering.
Bitmap rendering.
A.15. Cotangent (cot)
ASCII rendering.
Bitmap rendering.
A.16. Hyperbolic cotangent (coth)
ASCII rendering.
Bitmap rendering.
A.17. Cosecant (csc)
ASCII rendering.
Bitmap rendering.
A.18. Hyperbolic cosecant (csch)
ASCII rendering.
Bitmap rendering.
A.19. Exponential (exp)
ASCII rendering.
Bitmap rendering.
A.20. Natural logarithm (log)
ASCII rendering.
Bitmap rendering.
A.21. Base-10 logarithm (log10)
ASCII rendering.
Bitmap rendering.
A.22. Secant (sec)
ASCII rendering.
Bitmap rendering.
A.23. Hyperbolic secant (sech)
ASCII rendering.
Bitmap rendering.
A.24. Sine (sin)
ASCII rendering.
Bitmap rendering.
A.25. Hyperbolic sine (sinh)
ASCII rendering.
Bitmap rendering.
A.26. Square root (sqrt)
ASCII rendering.
Bitmap rendering.
A.27. Cube root (cbrt)
ASCII rendering.
Bitmap rendering.
A.28. Tangent (tan)
ASCII rendering.
Bitmap rendering.
A.29. Hyperbolic tangent (tanh)
ASCII rendering.
Bitmap rendering.
A.30. Floor (floor)
ASCII rendering.
Bitmap rendering.
A.31. Ceiling (ceil)
ASCII rendering.
Bitmap rendering.
A.32. Round-to-nearest (round)
ASCII rendering.
Bitmap rendering.
A.33. Truncation (trunc)
ASCII rendering.
Bitmap rendering.

