You are encouraged to read the writeup first (steps below). The result of this writeup (a small PoC) can be started with:
sudo sysctl -w vm.max_map_count=262144
docker-compose up
# in parallel to docker-compose:
cd proxy
cargo run
Please note that it was only tested on Linux with Docker (not Podman). Your milage may vary on other OSes.
Let's start our investigation by looking into what type of requests OpenSearch Dashboards (aka Kibana?) does to OpenSearch nodes (aka Elasticsearch nodes?) - capturing the traffic with Wireshark.
We'll start with the example docker-compose.yml file from OpenSearch download page:
wget https://opensearch.org/samples/docker-compose.yml
sudo sysctl -w vm.max_map_count=262144
docker-compose up
Make sure to use Docker (and not Podman). I also modified the docker-compose.yml file to disable all security to make the research process easier.
Let's insert some example data:
curl -XPUT 'http://localhost:9200/my-first-index'
curl -XPUT 'http://localhost:9200/my-first-index/_doc/1' -H 'Content-Type: application/json' -d '{"Description": "Through the fire, to the limit, to the wall, For a chance to be with you, Id gladly risk it all."}'
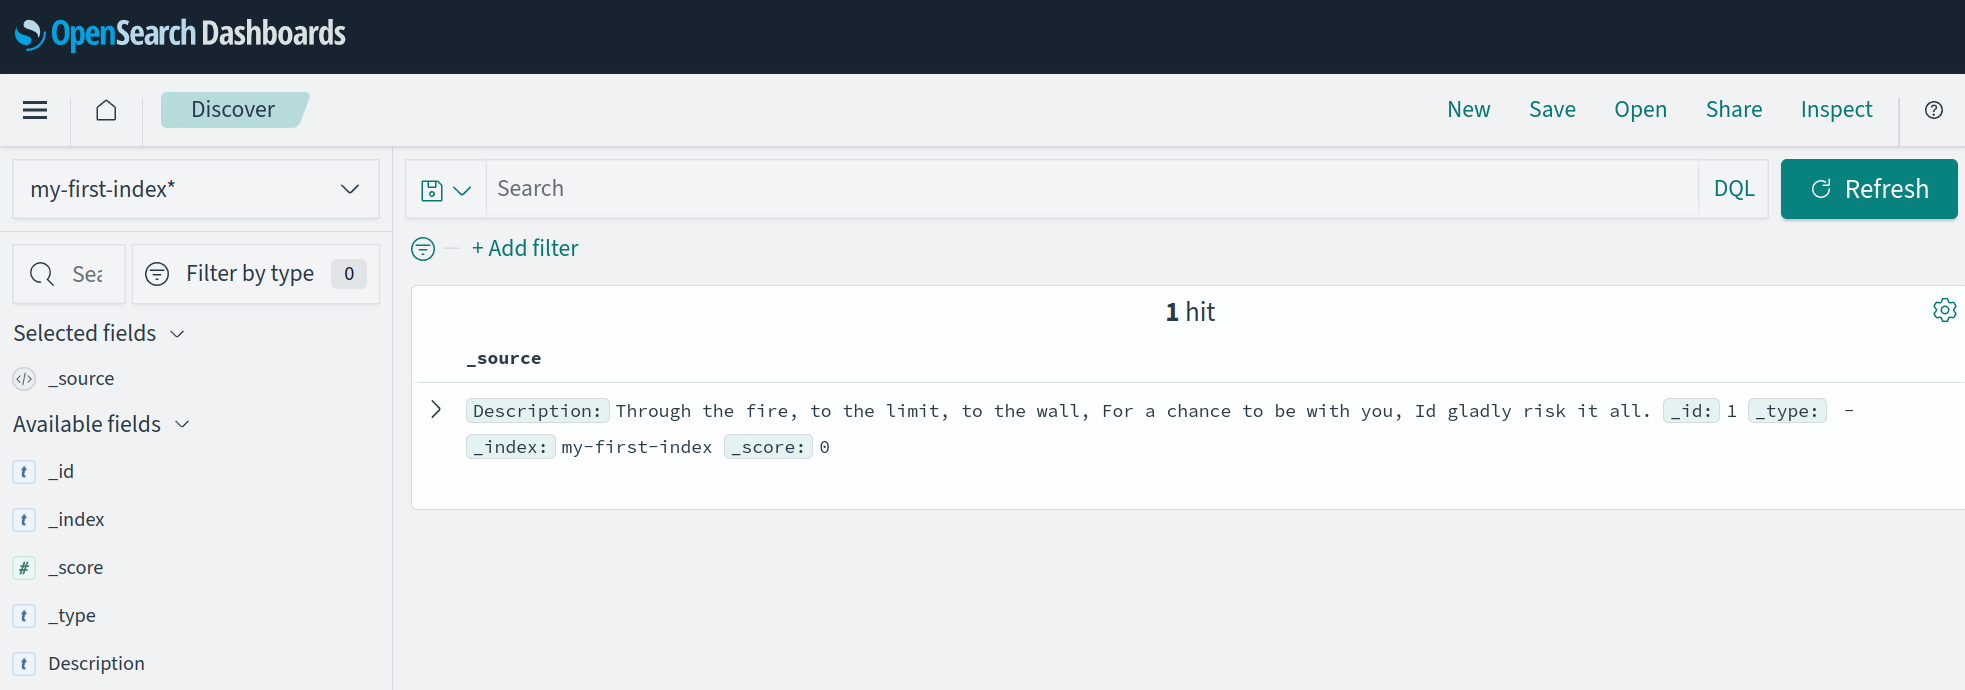
This inserted document can then be queried in a "OpenSearch Dashboards > Discover" page:
Next, we use Wireshark to see the request that fetched this data (sent from OpenSearch dashboard container to OpenSearch node container):
[from dashboard to node]
POST /my-first-index*/_search?ignore_unavailable=true&track_total_hits=true&timeout=30000ms&preference=1714304044052 HTTP/1.1
user-agent: opensearch-js/2.6.0 (linux 6.5.0-18-generic-x64; Node.js v18.19.0)
x-opensearch-product-origin: opensearch-dashboards
x-opaque-id: 5c29ad7c-0505-47fb-8f3a-dcd40726744b
content-type: application/json
content-length: 410
Host: opensearch-node1:9200
Connection: keep-alive

{"sort":[{"_score":{"order":"desc"}}],"size":500,"version":true,"stored_fields":["*"],"script_fields":{},"docvalue_fields":[],"_source":{"excludes":[]},"query":{"bool":{"must":[],"filter":[{"match_all":{}}],"should":[],"must_not":[]}},"highlight":{"pre_tags":["@opensearch-dashboards-highlighted-field@"],"post_tags":["@/opensearch-dashboards-highlighted-field@"],"fields":{"*":{}},"fragment_size":2147483647}}

[from node to dashboard]
HTTP/1.1 200 OK
X-Opaque-Id: 5c29ad7c-0505-47fb-8f3a-dcd40726744b
content-type: application/json; charset=UTF-8
content-length: 348

{"took":1,"timed_out":false,"_shards":{"total":1,"successful":1,"skipped":0,"failed":0},"hits":{"total":{"value":1,"relation":"eq"},"max_score":0.0,"hits":[{"_index":"my-first-index","_id":"1","_version":5,"_score":0.0,"_source":{"Description": "Through the fire, to the limit, to the wall, For a chance to be with you, Id gladly risk it all."}}]}}
or as a curl command:
curl 'http://localhost:9200/my-first-index*/_search?ignore_unavailable=true&track_total_hits=true&timeout=30000ms&preference=1714304044052' \
 -X POST \
 -H 'user-agent: opensearch-js/2.6.0 (linux 6.5.0-18-generic-x64; Node.js v18.19.0)' \
 -H 'x-opensearch-product-origin: opensearch-dashboards' \
 -H 'x-opaque-id: 5c29ad7c-0505-47fb-8f3a-dcd40726744b' \
 -H 'content-type: application/json' \
 -H 'content-length: 410' \
 -H 'Host: opensearch-node1:9200' \
 -H 'Connection: keep-alive' \
 -d '{"sort":[{"_score":{"order":"desc"}}],"size":500,"version":true,"stored_fields":["*"],"script_fields":{},"docvalue_fields":[],"_source":{"excludes":[]},"query":{"bool":{"must":[],"filter":[{"match_all":{}}],"should":[],"must_not":[]}},"highlight":{"pre_tags":["@opensearch-dashboards-highlighted-field@"],"post_tags":["@/opensearch-dashboards-highlighted-field@"],"fields":{"*":{}},"fragment_size":2147483647}}'
Now let's see what types of auxilary requests the Dashboard performs - according to KETCHUP project description we should expect many "read metadata" requests. Let's see all requests to the nodes that are required to render "OpenSearch Dashboards > Discover" page (sent from dashboard to node):
GET /.kibana/_doc/config%3A2.13.0
GET /.kibana/_doc/config%3A2.13.0
POST /.kibana/_search?size=10000&from=0&_source=index-pattern.title%2Cnamespace%2Cnamespaces%2Ctype%2Creferences%2CmigrationVersion%2Cupdated_at%2CoriginId%2Ctitle&rest_total_hits_as_int=true
POST /.kibana/_search?size=10000&from=0&_source=index-pattern.title%2Cnamespace%2Cnamespaces%2Ctype%2Creferences%2CmigrationVersion%2Cupdated_at%2CoriginId%2Ctitle&rest_total_hits_as_int=true
POST /_mget
GET /.kibana/_doc/config%3A2.13.0
Inspired by KETCHUP project we will set up a proxy between the dashboard and the node. At first the proxy will just forward all the requests to OpenSearch nodes, but over time it will be extended to translate some queries and send them to a different DB. We will write it in Rust and use the hyper library. gateway.rs is a convenient starting point.
Additionally, we have to adjust docker-compose.yml file to use the default network (and be able to access the proxy started outside the Docker) and point OPENSEARCH_HOSTS to the proxy.
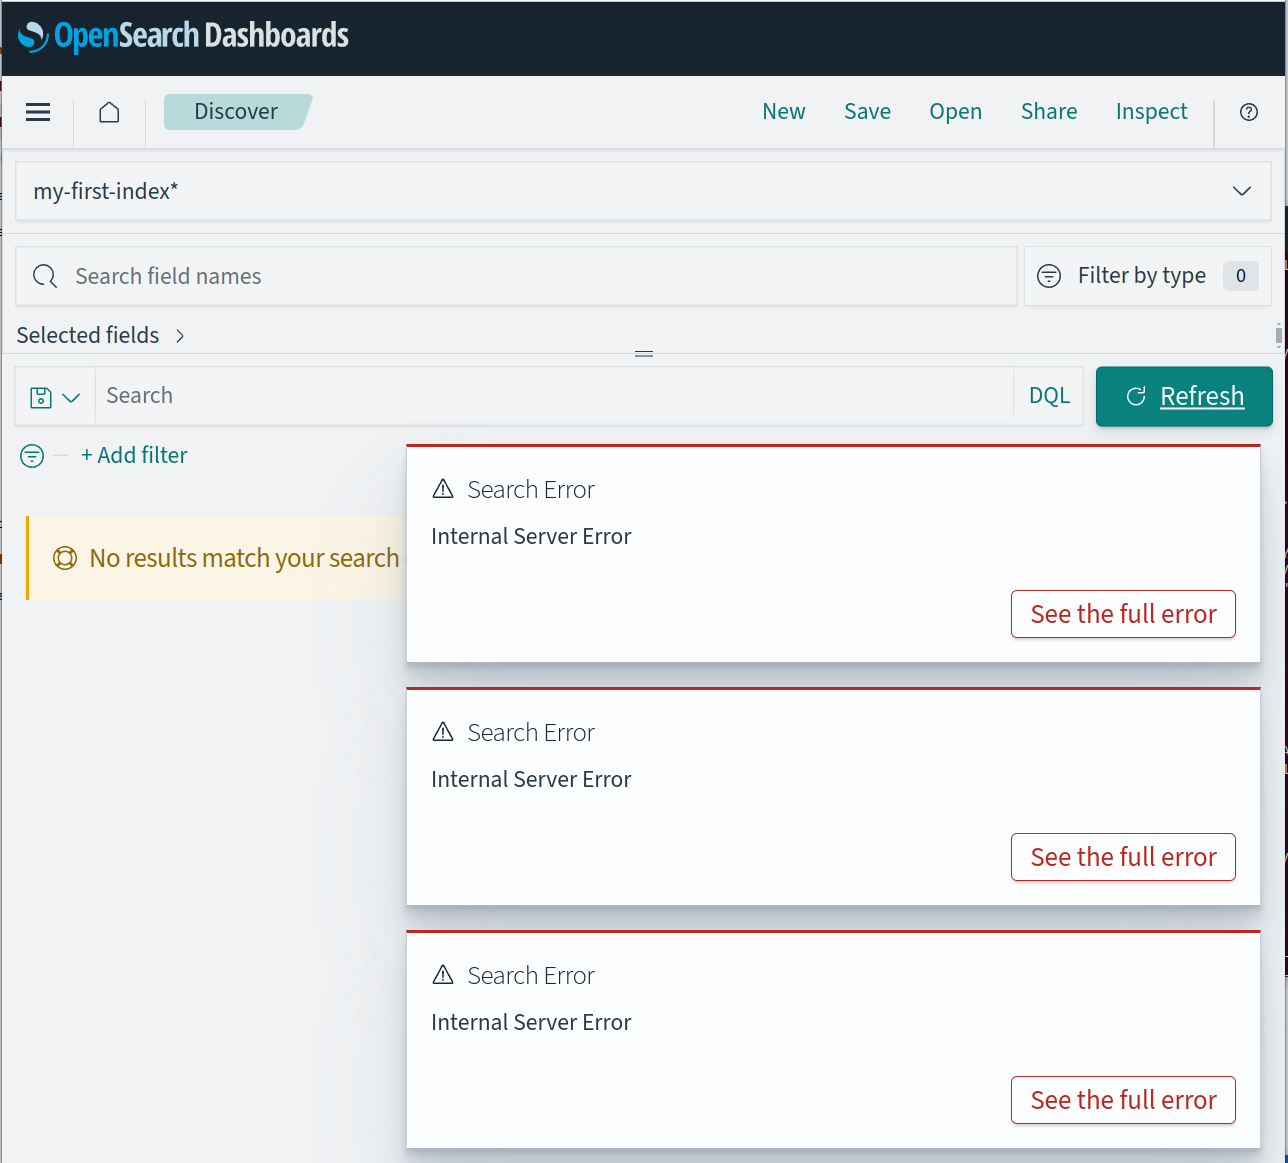
After relaunching all the nodes, we can validate that the OpenSearch Dashboard tries to use the proxy by purposefully forgetting to turn it on and expecting failures:
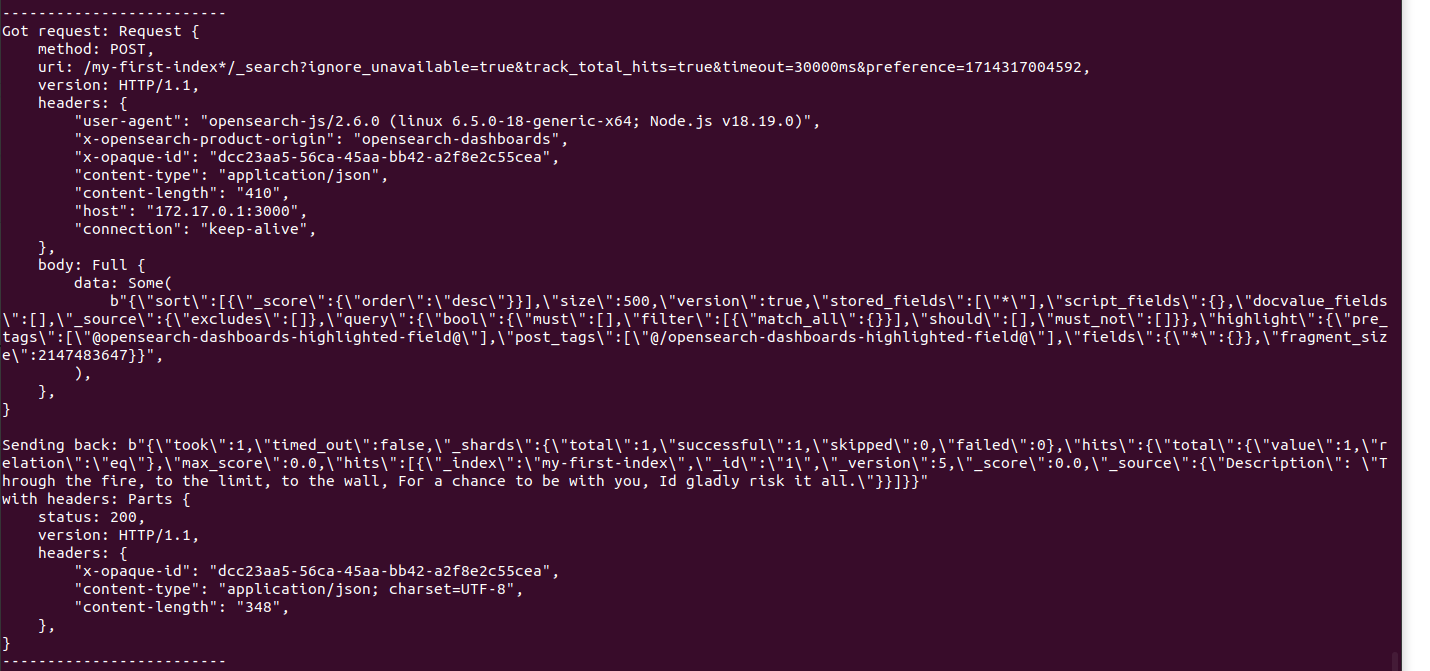
but once we turn on the proxy (cd proxy; cargo run) it correctly routes requests and the dashboard works as expected.
Now the fun part - let's handle some request on our own, without sending it to OpenSearch nodes. For now, we'll focus only on the most basic query - without any filtering and fallback to OpenSearch nodes otherwise.
The proxy code now will read the entire request and if it's a request to the _search endpoint it will try to parse and validate it.
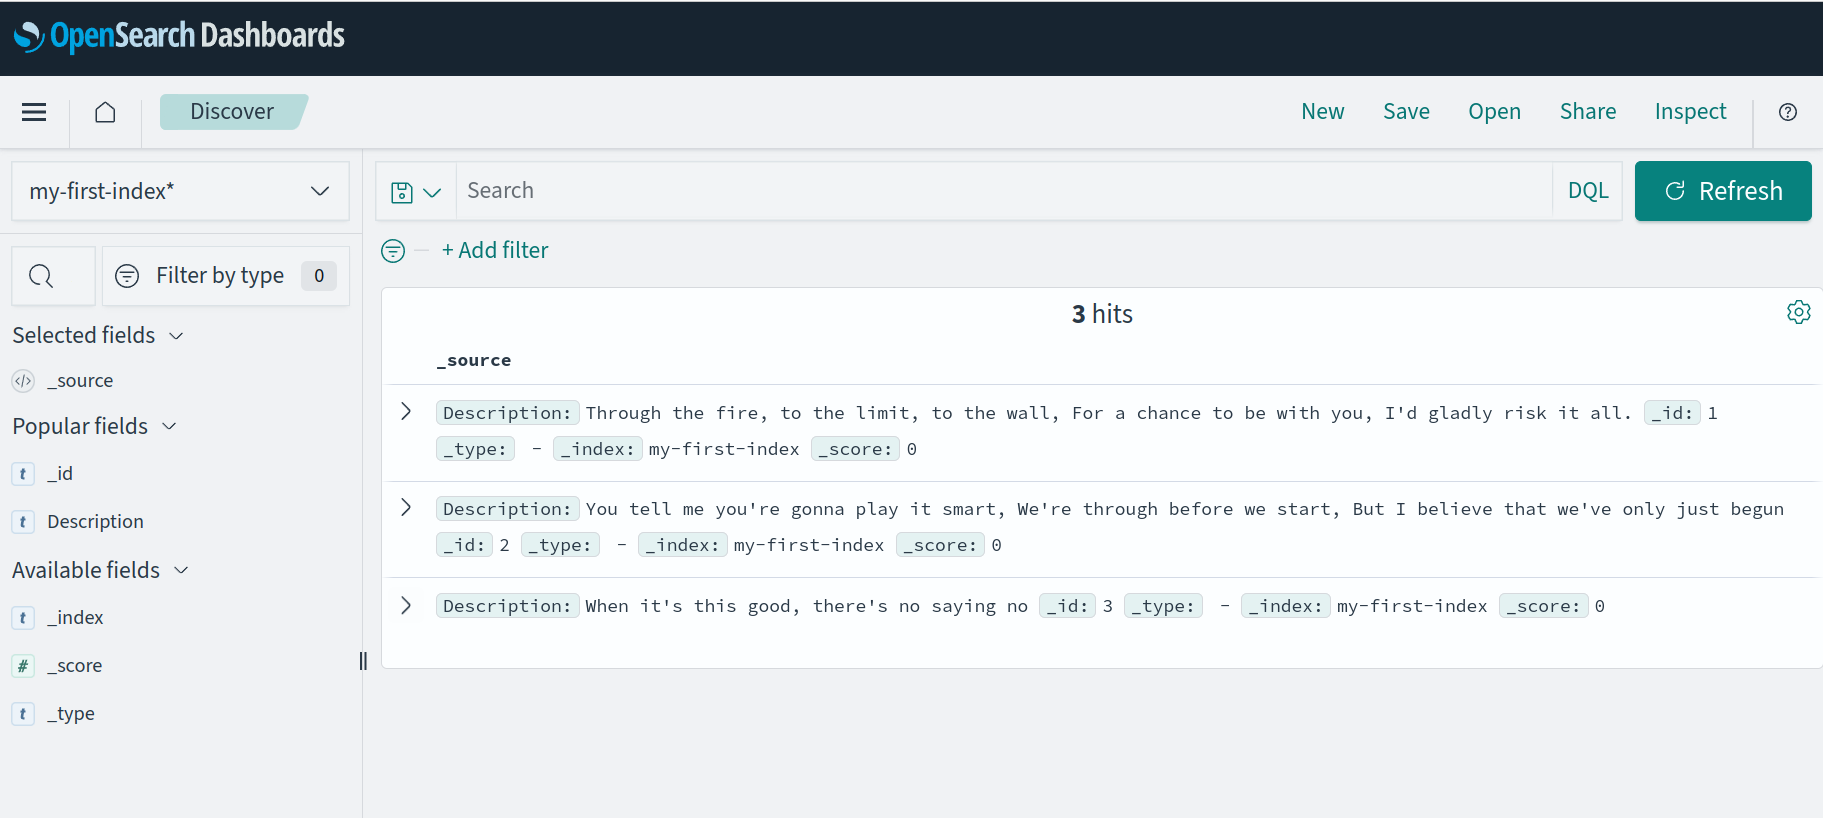
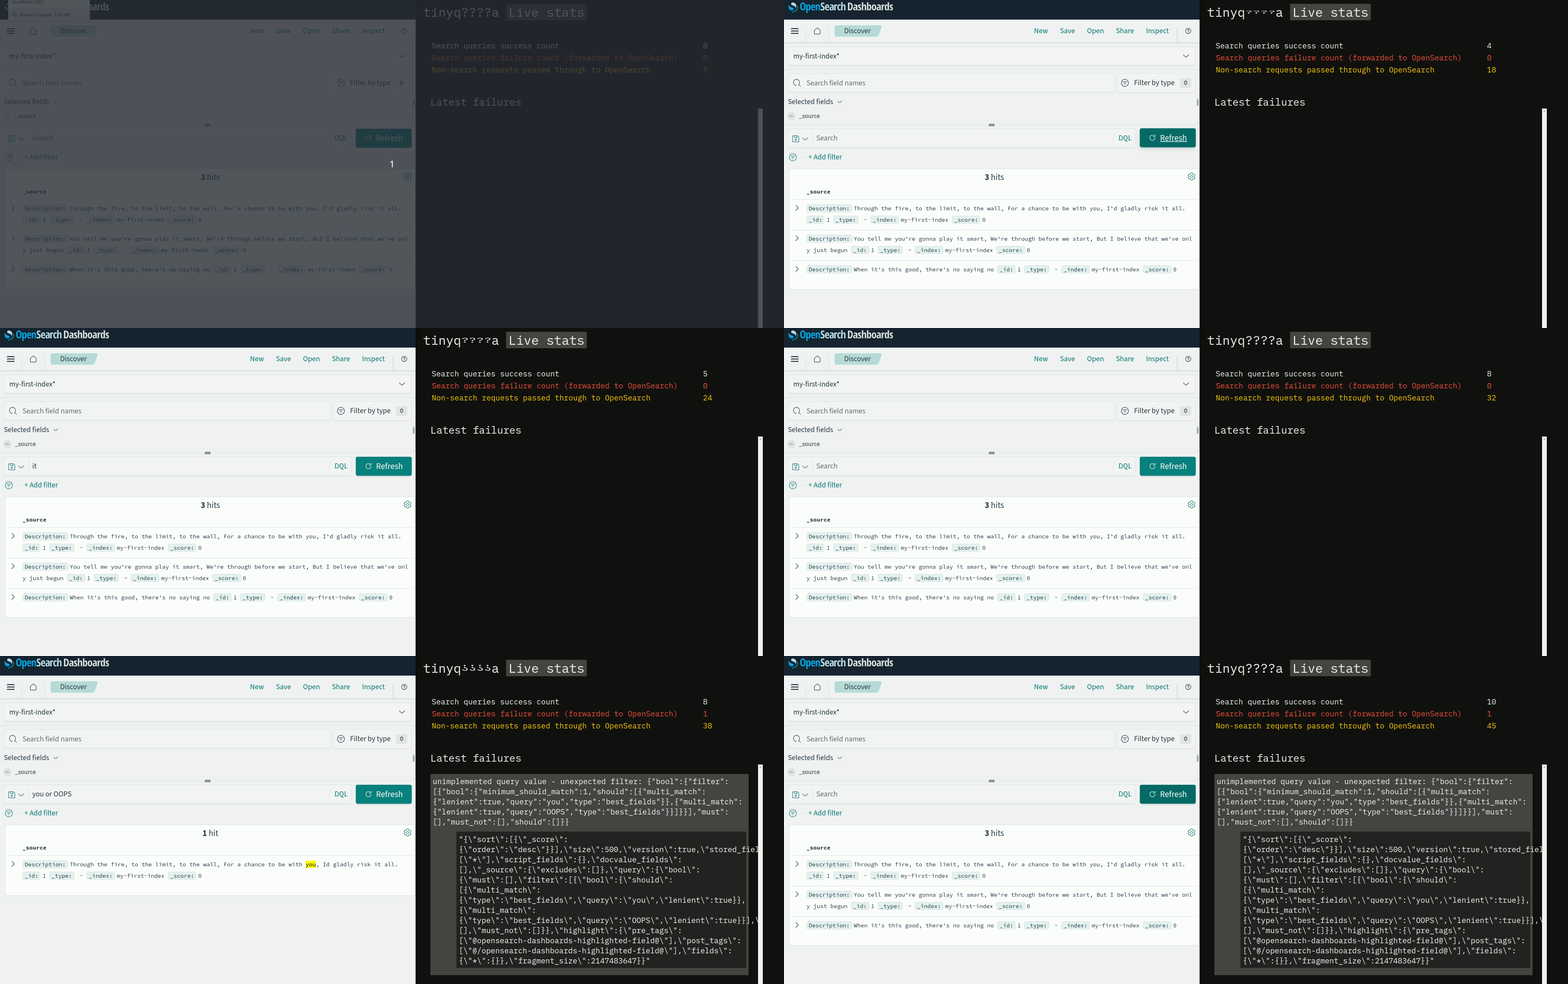
If it's a query without any filtering (exact same query as seen above), the code will return a response with our own list of results (for now hardcoded in memory) - see it returning 3 hits instead of 1 hit:
In any other case, it will fall back to sending the request to the OpenSearch node. This way we can incrementally extend the compatibility.
Let's add a basic frontend that shows some basic statistics and a list of recent requests. The frontend will use HTMX, constantly showing the latest metrics.
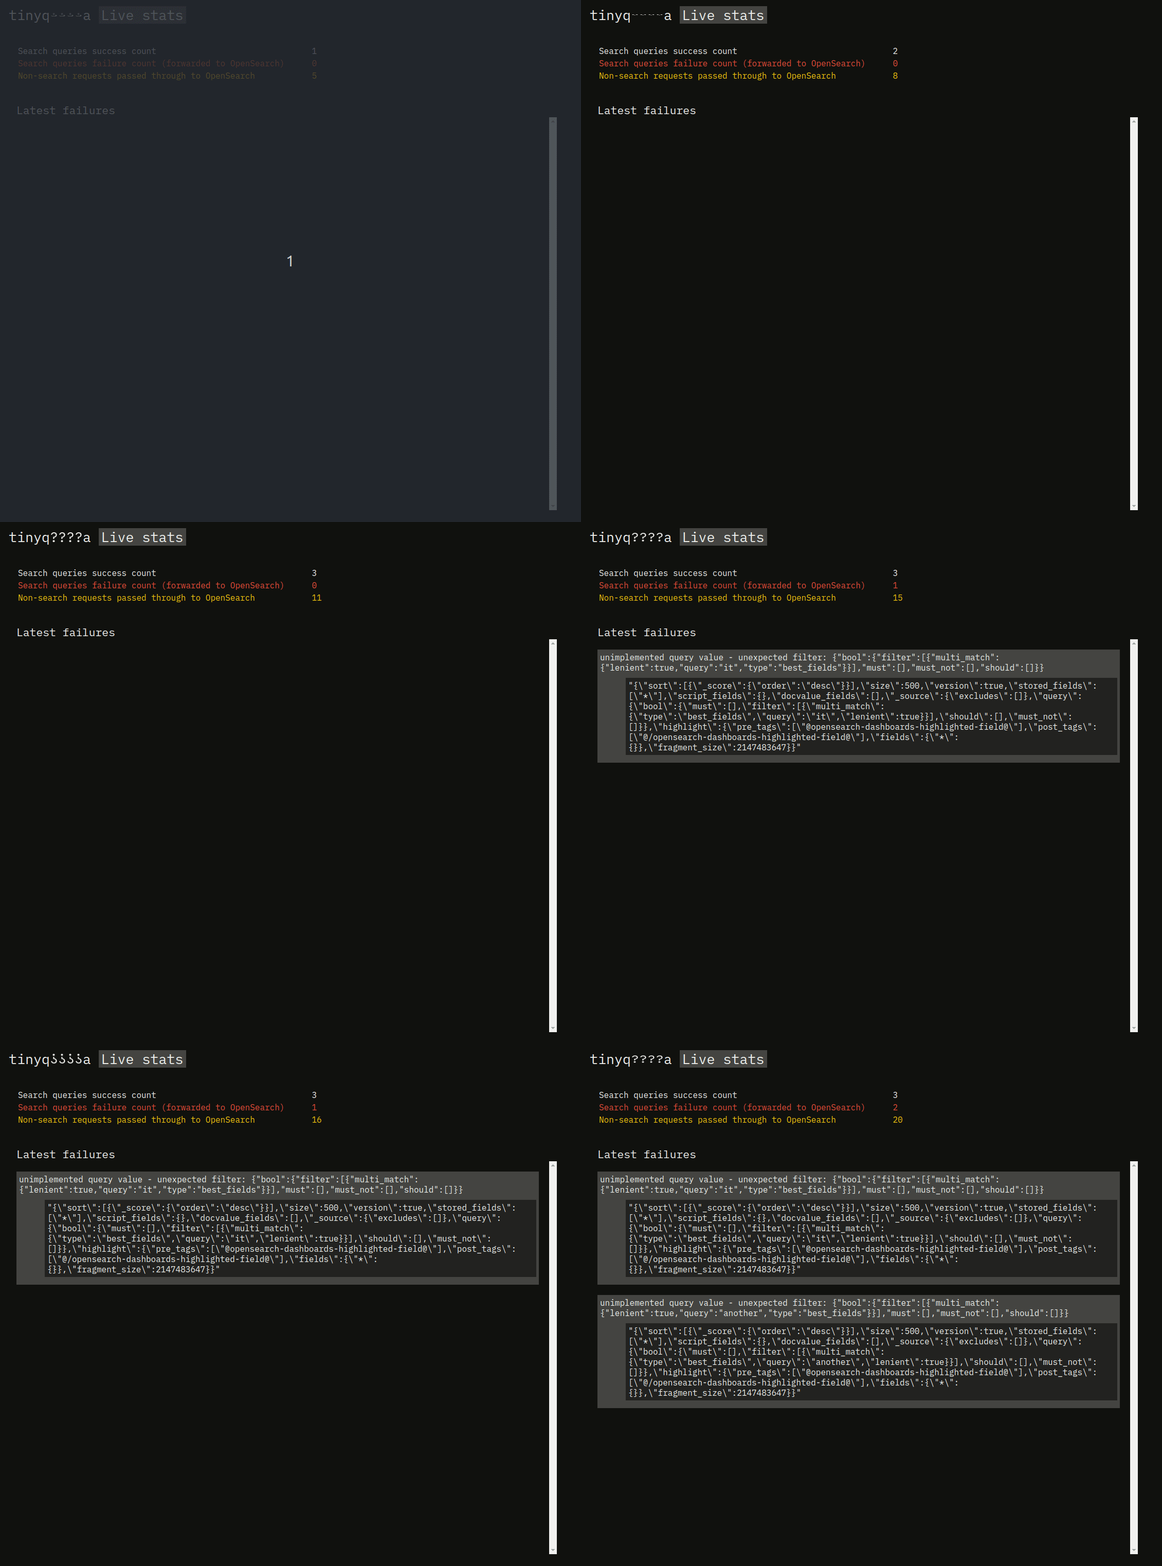
The failures in this short clip correspond to trying to execute a query with some filters, while succesful queries are the ones without any filters.
An example usage of multi_match filter looks like this:
{"filter":[{"multi_match":{"lenient":true,"query":"it chance","type":"best_fields"}}
This will match all documents that contain it or chance and we will implement only this basic behavior of this filter.
Note that the highlighting feature is not working since the implementation doesn't yet return a proper highlight response.
...or more accurately:
