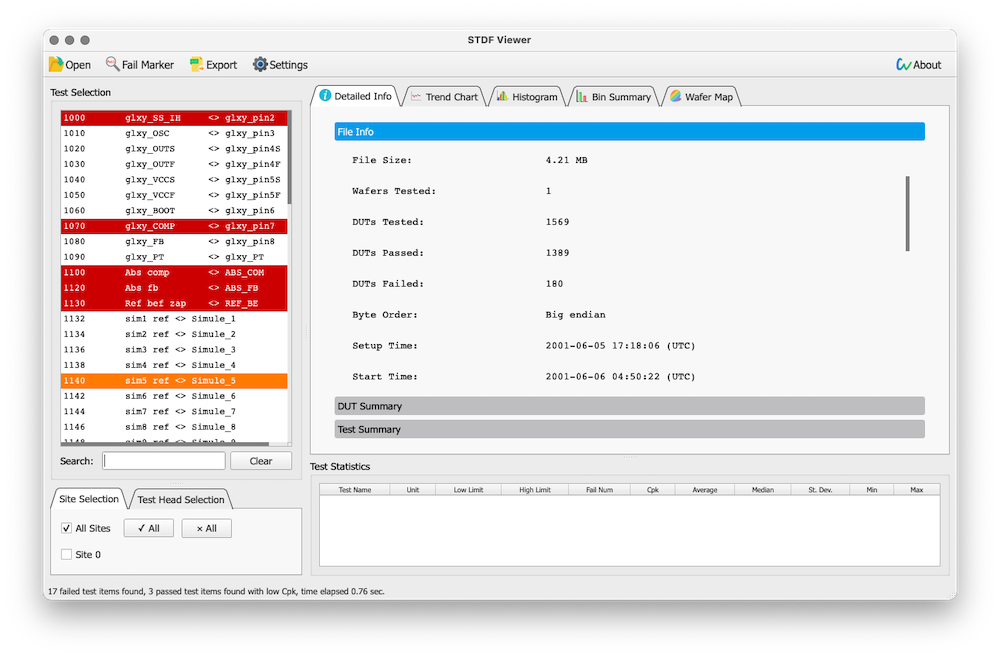
STDF Viewer is a free, fast and powerful GUI tool to visualize STDF (semiconductor Standard Test Data Format) data files.
Devloped by Noon Chen chennoon233@foxmail.com
| 中文版 |
- Build
- Usage
- Having issues?
- Acknowledgements
- License
- Download
- Contributions
- Install Python 3.9+ and Rust
- Install python modules,
maturinis required to buildrust_stdf_helper.
pip install -r requirements.txt
pip install maturin
- Build
rust_stdf_helper
cd ./deps/rust_stdf_helper
maturin build -f -r
- Install
rust_stdf_helper, the wheel is located intarget/wheels/.
pip install /path/to/whl/file
- You can run
STDF-Viewer.pydirectly, or using your favorite tool to bundle it to an executable.
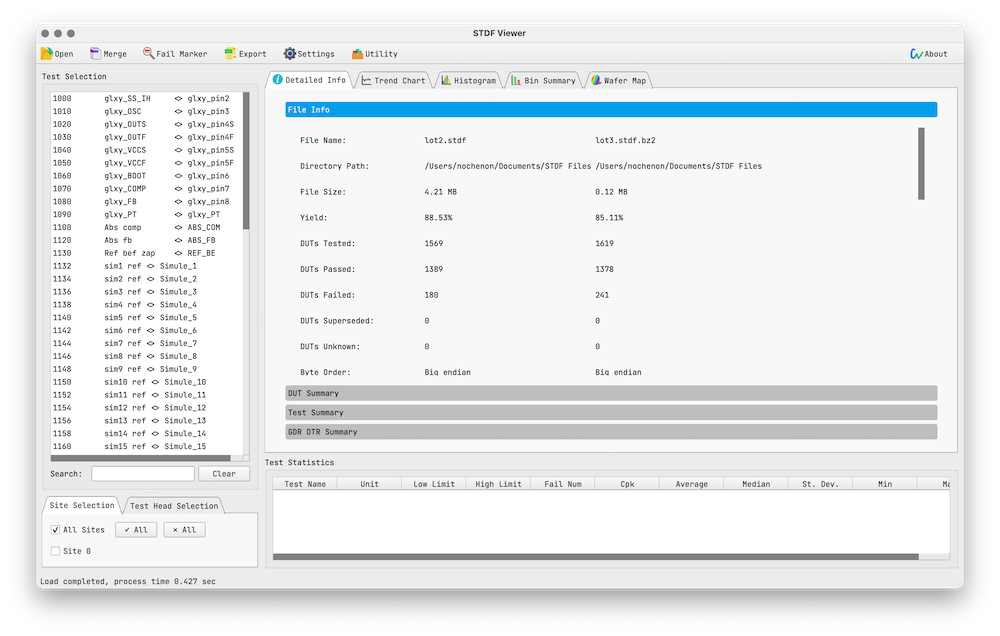
STDF Viewer supports files under STDF V4 and V4-2007 Specification, ZIP*, GZ and BZIP compressed STDF files can also be opened without decompression.
STDF files can be opened in 3 ways:
- Select STDF files in a file dialog by clicking
openbutton on the toolbar. - Right click on a STDF file and select STDF Viewer to open.
- Drag STDF files into the GUI to open.
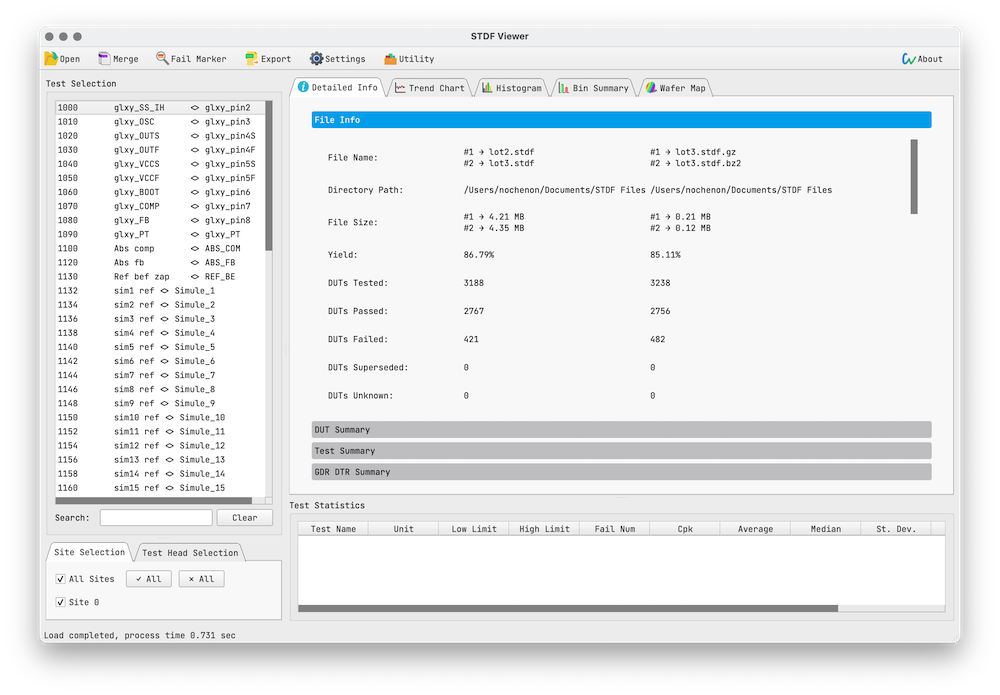
If multiple STDF files are selected, compare mode is automatically enabled, you will see multiple sections in a single plot
Note: ZIP format support is limited, works only if:
- ZIP file is not password protected.
- Contains only 1 file per ZIP.
ZIP file is created using(V4.0.0)DEFLATEcompression method, which is the default on popular OSs' native zip tool.
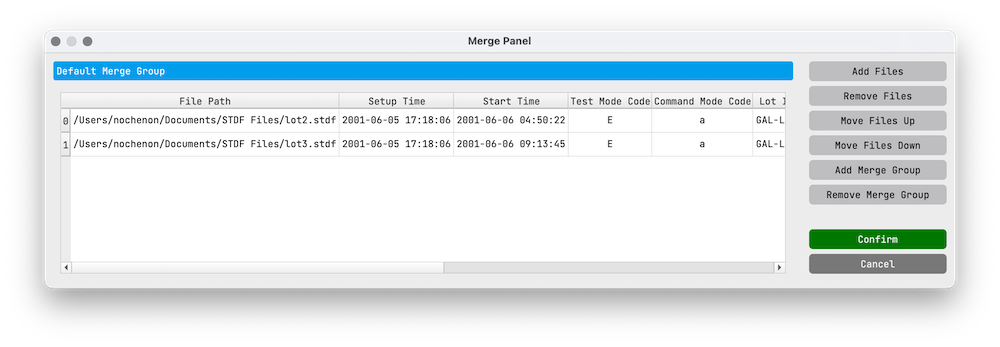
(Introduced in V4.0.0) Open the merge panel by clicking Merge button on the toolbar, user can add multiple files in merge groups,
files in a same group will be merged into a single file and index 0 is regarded as the first file in a group.
Adding multiple merge groups is also supported, in case you'd like to compare merge groups.
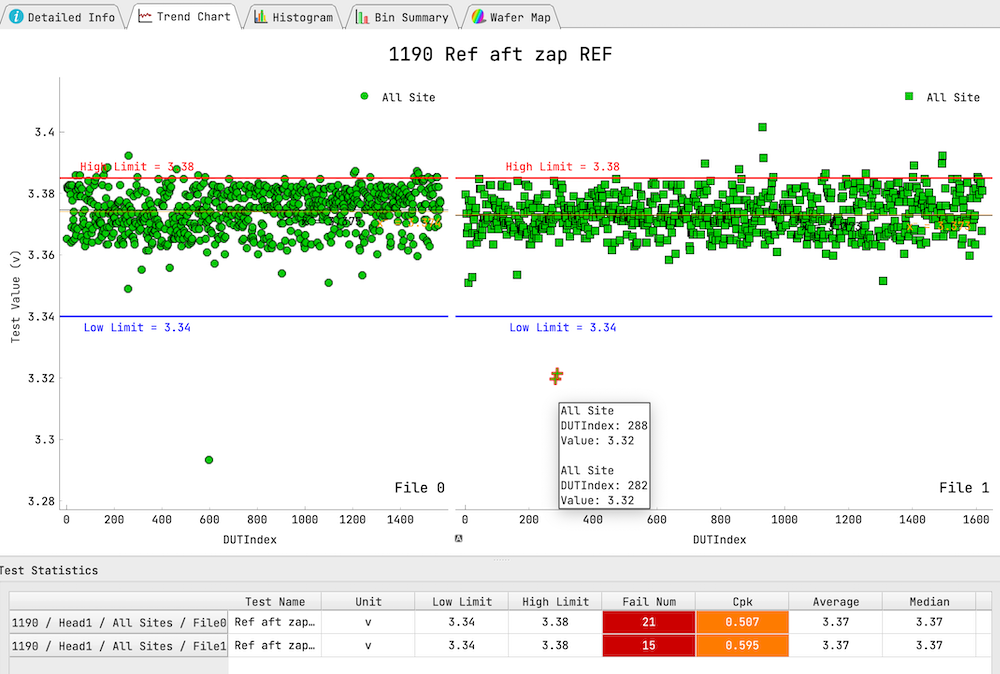
By clicking the Fail Marker button on the toolbar can paint all failed test items in red, if the Find Low Cpk is enabled in Settings, test items with Cpk lower than the threshold (can be set in Settings) will be painted in orange.
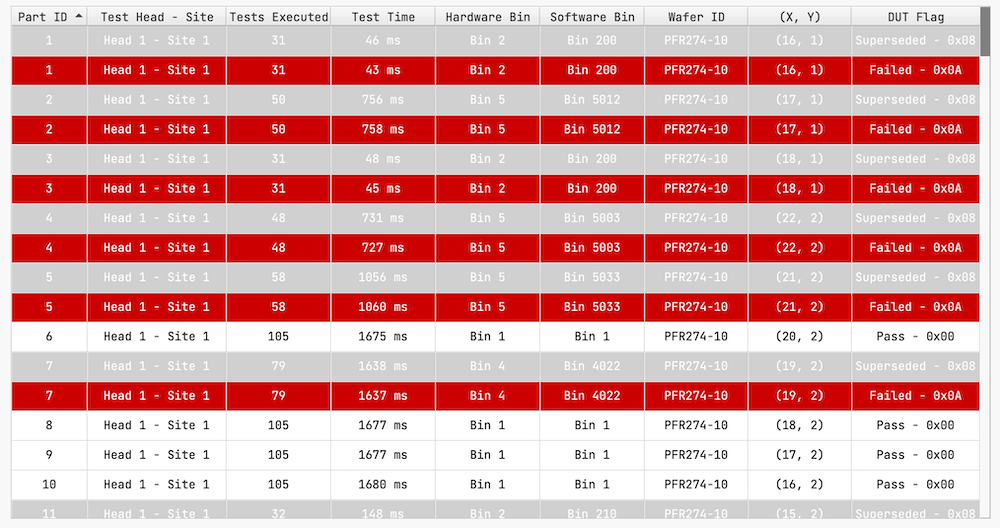
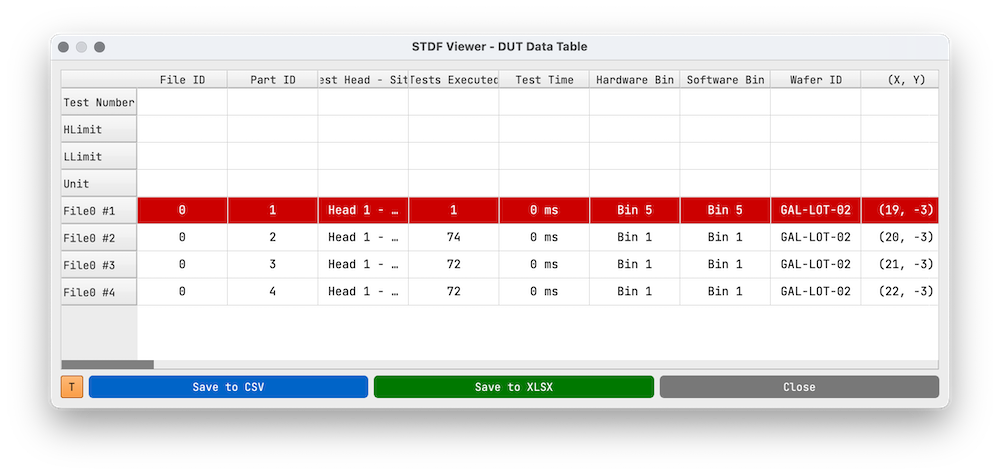
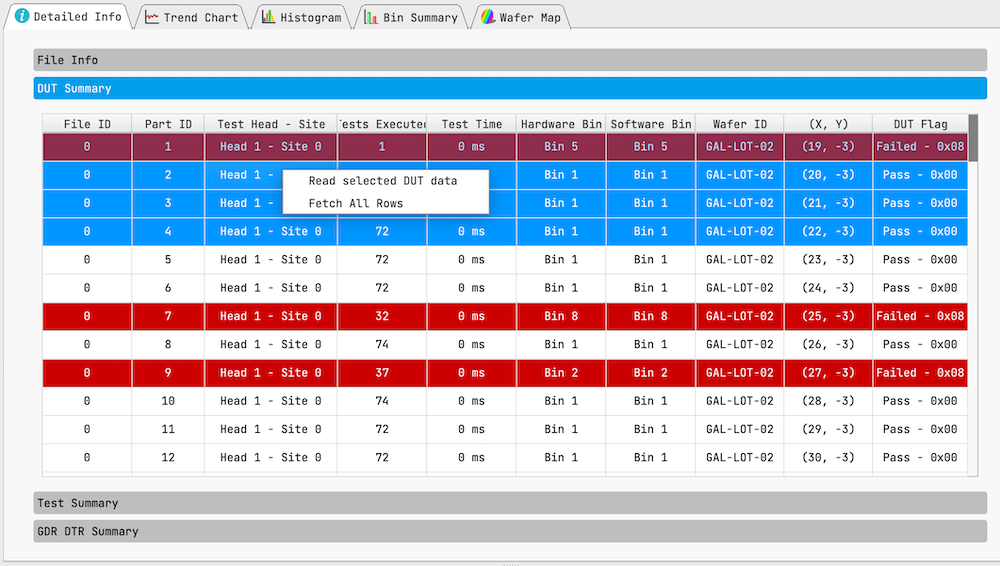
DUTs' info can be viewed in Detailed Info -> DUT Summary. Each line in the table represents a single DUT, and it will be marked in red if this DUT is failed.
(Introduced in V4.0.0) Superseded DUTs will be marked in grey. A normal stdf file will contains several K DUTs, in order to improve performance, DUT Summary will not load all DUTs to the table, but if you want to load all, right click on the table and select Fetch All Rows.
If STDF files contain multiple heads and/or sites, you may also filter out the DUTs of non-interest by selecting specific heads and/or sites in Site/Head Selection.
DUTs' info can be sorted by any columns. For instance, the screenshot below showing the result of sorting the DUTs by Part ID.
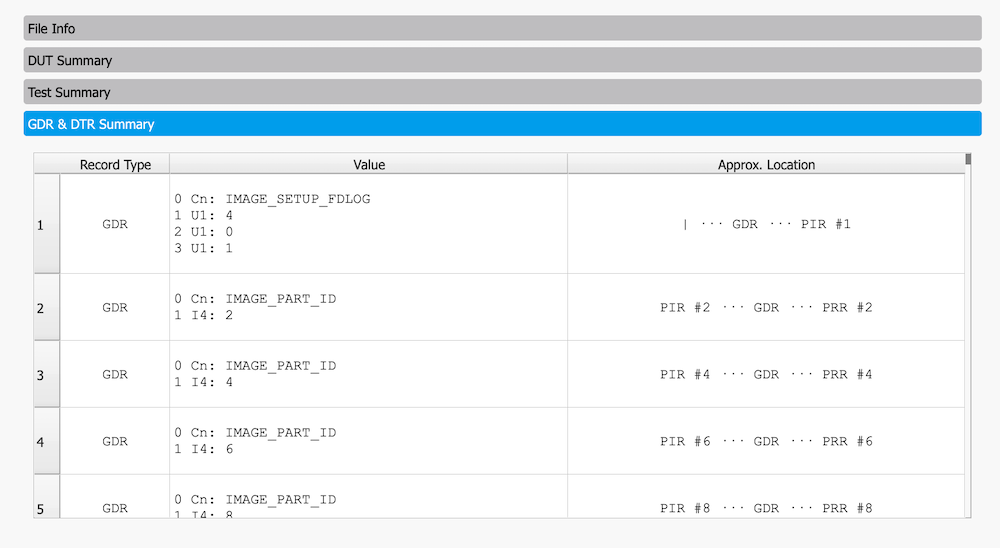
All the GDR (Generic Data Record) and DTR (Datalog Text Record) will be listed in Detailed Info -> GDR & DTR Summary. The precise location of GDR & DTR is hard to trace, the relative location compared to PIR/PRR is given instead.
For GDR, each line in the Value column represents a V1 data, which is displayed in the format of {V1 index} {V1 data type}: {V1 data}.
Same as DUT Summary table, use Fetch All Rows to load all data into the table.
Note: Data of Bn & Dn type is shown in HEX string.
Importance Notice: Functional Tests (FTR) have no test value, instead, the test flag is used as the test value for drawing trend charts and histograms
All test items in the STDF file will be shown in the Test Selection, in which you can select single or multiple test item(s). The search box below can help you find test item(s) more easily.
Statistic (Cpk, mean, std dev, etc.) of the test items in the selected heads and sites is displayed in Test Statistics.
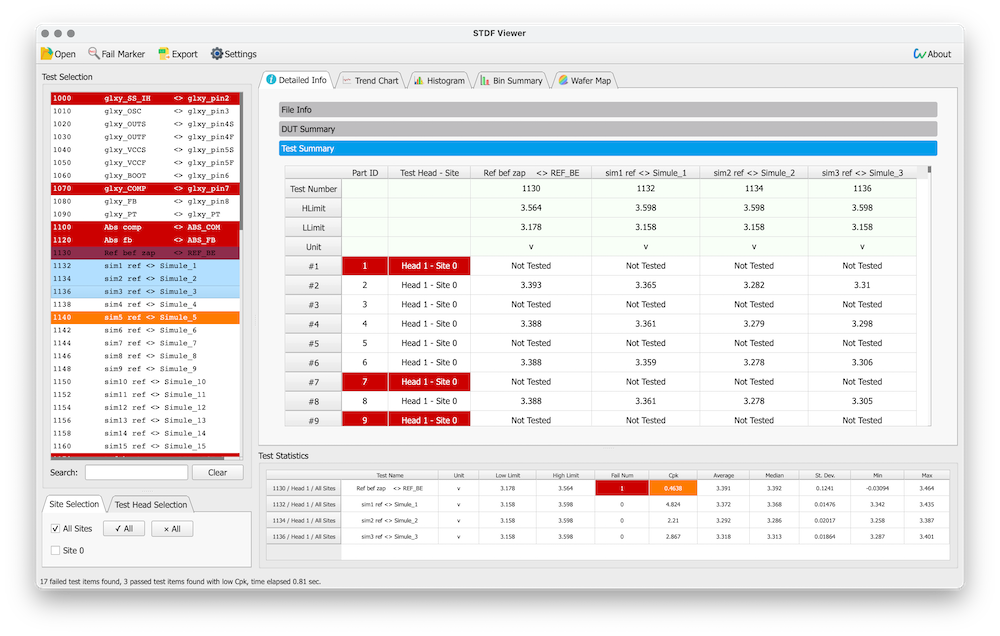
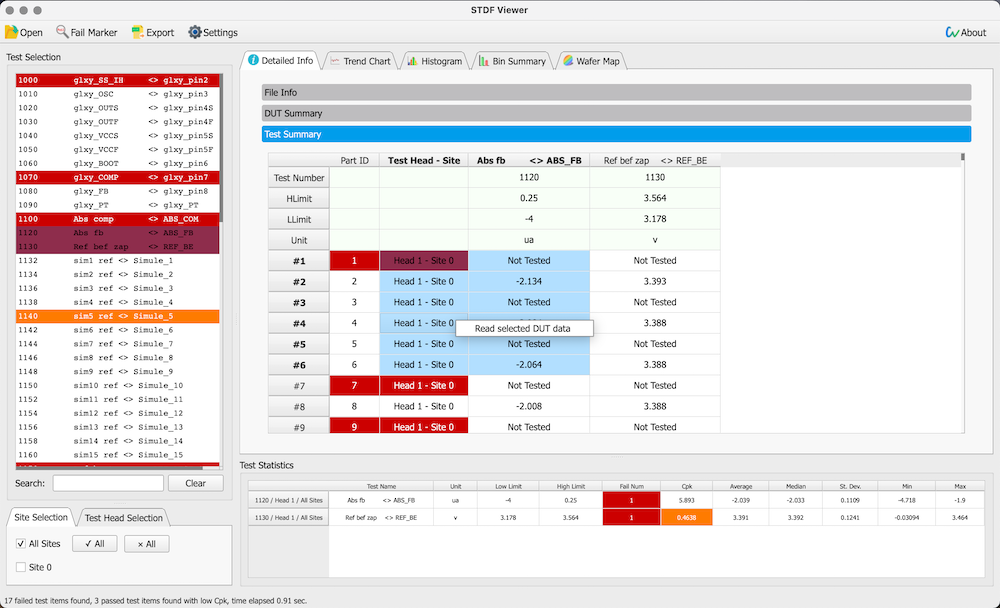
Select test item(s) and then navigate to Detailed Info -> Test Summary. Each row is a DUT that's been tested in the selected heads and sites, data of selected tests will be appended to the rightmost column.
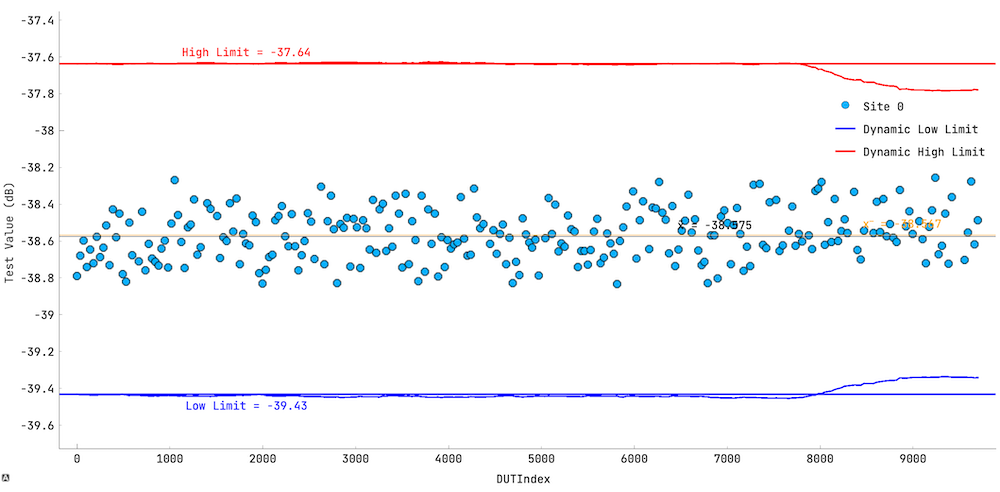
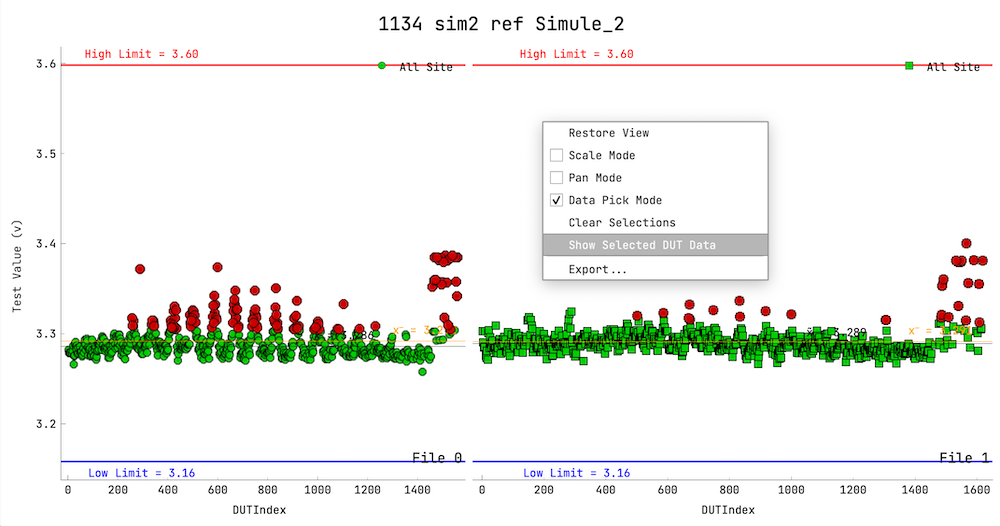
Display interactive trend charts of test item(s), y axis is the value of the test item, x axis is the index of DUTs that's been tested in selected head and site. You can hover over the point to show more information.
If the test have PAT enabled, e.g. high/low limits in PTRs are changing over duts, the dynamic limits will be shown instead.
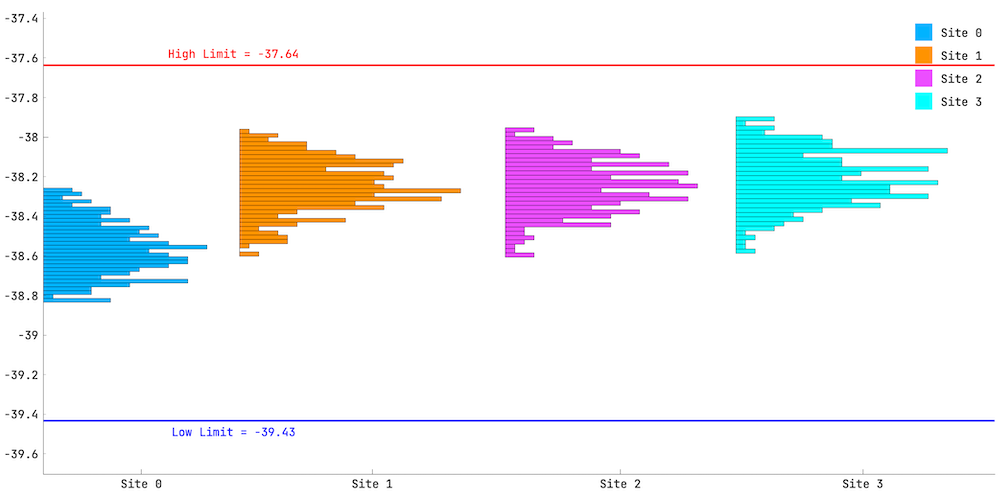
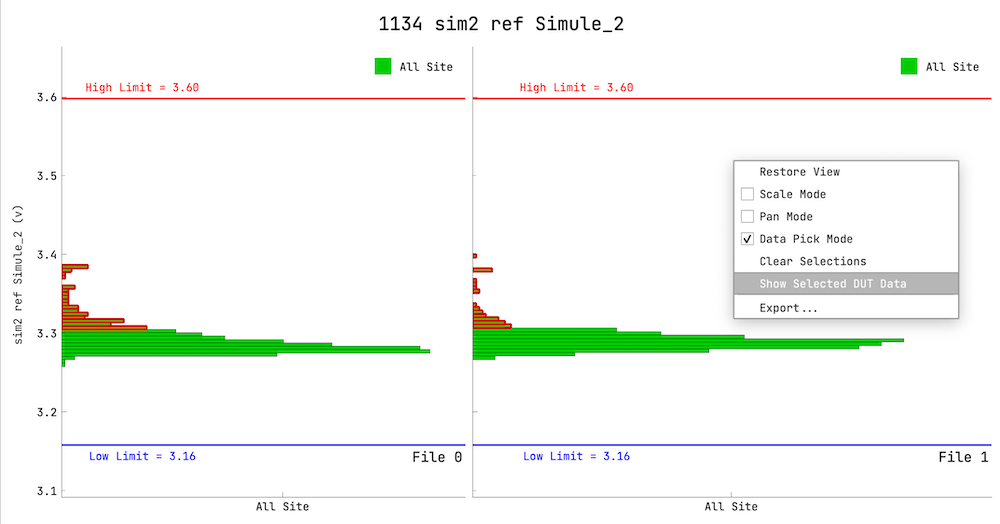
Display interactive histograms of test item(s), y axis is the test value distribution. you can hover over the rectangle to display its data range and dut counts.
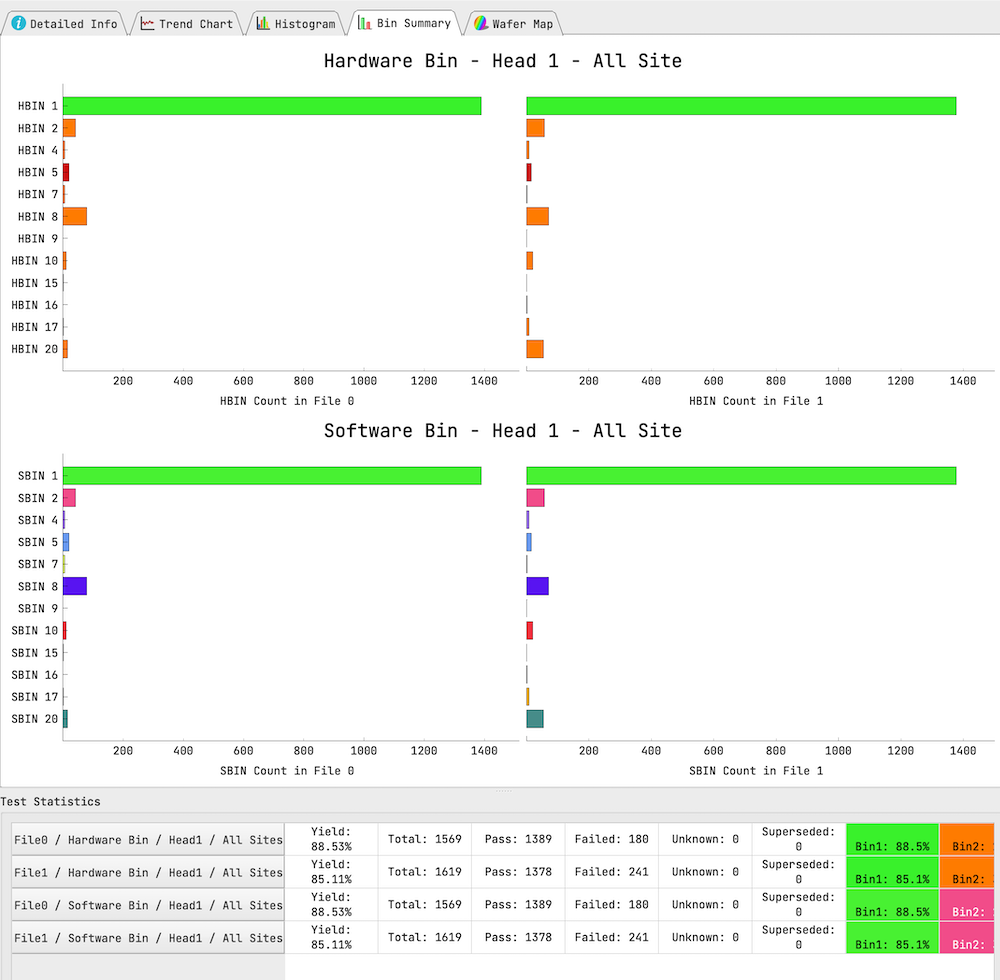
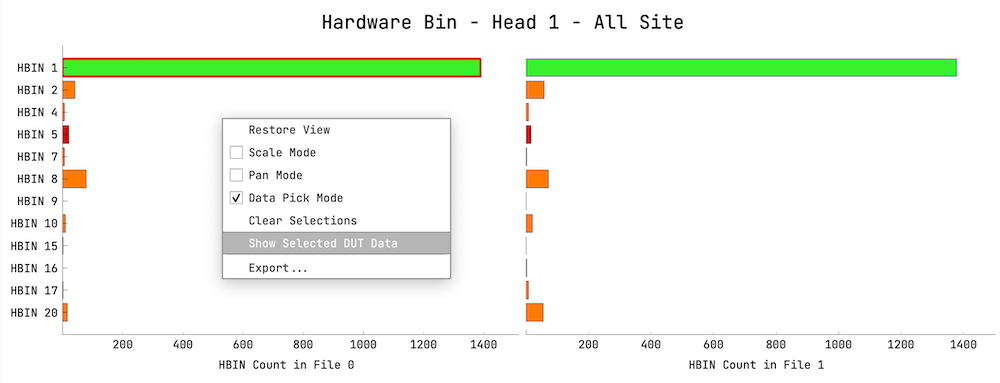
Display histograms of dut counts of each hardware bin and software bin in selected heads and sites.
Test Statistic table displays the dut counts, bin name, bin number and precentage, bins with DUT counts of 0 will be hidden.
If STDF files contain wafer information (WCR, WIR, WRR records), the Wafer Map tab will be enabled.
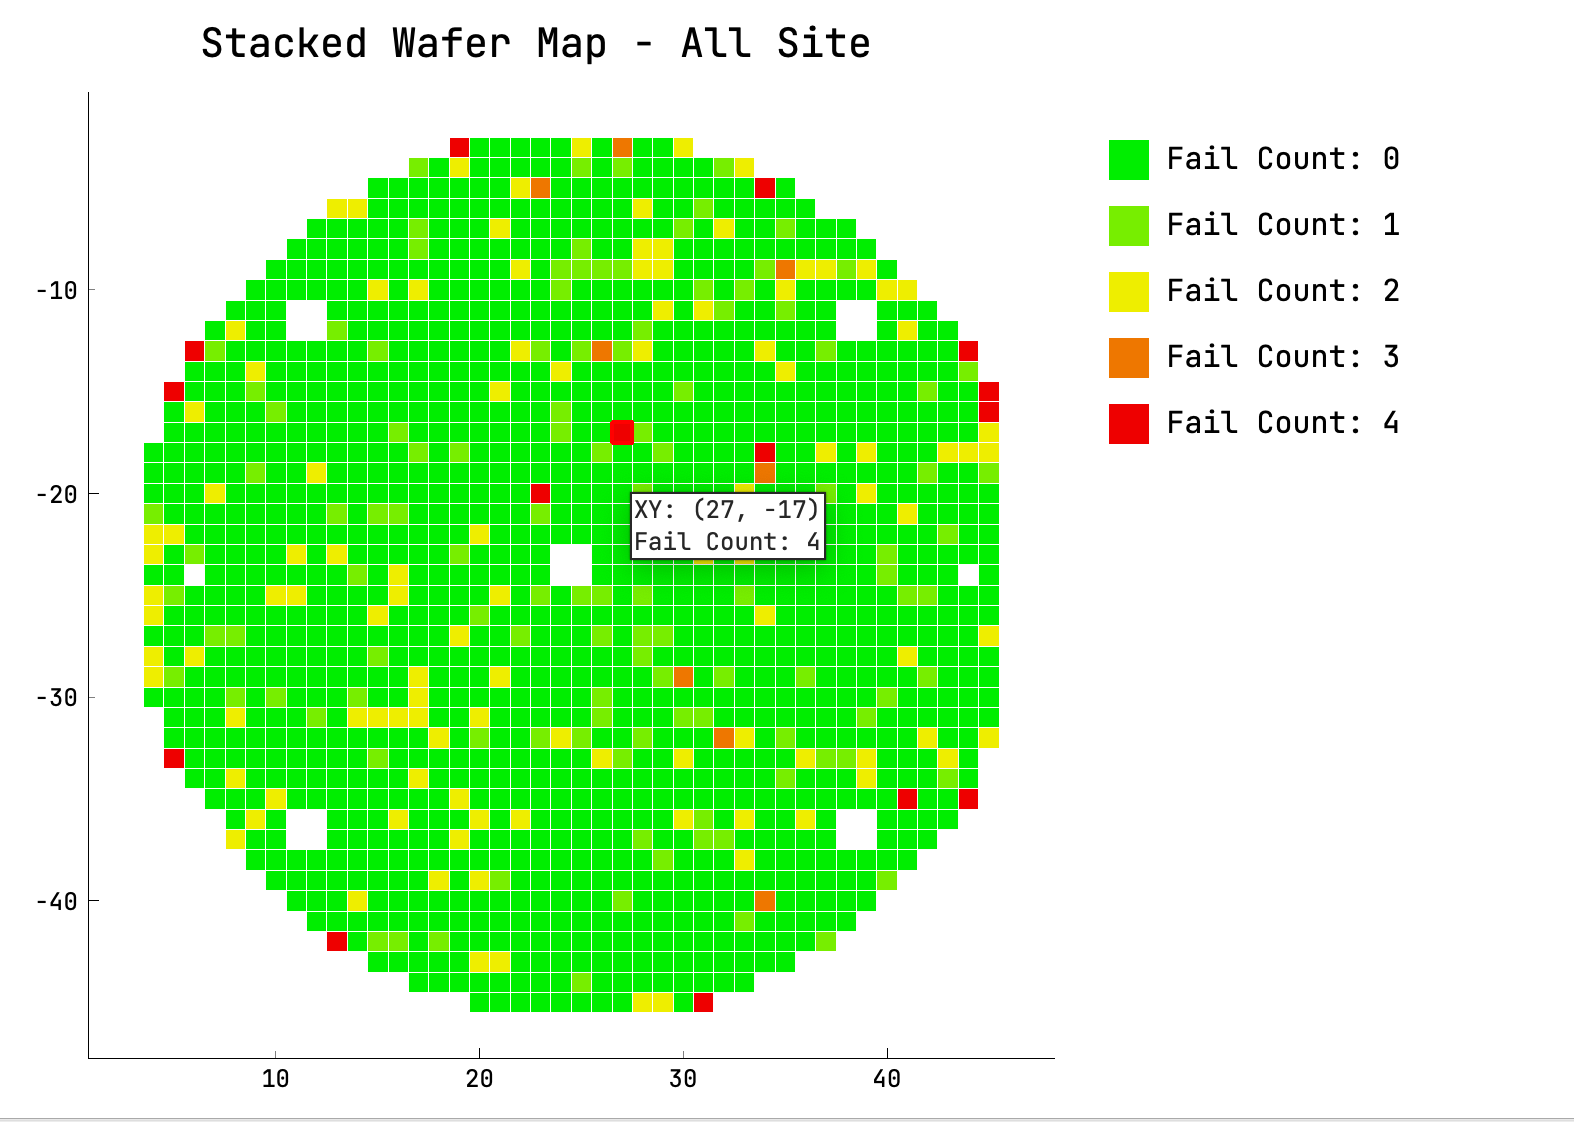
There is a stacked wafer map at the top of Wafer Selection that summarizes the total count of fail dut in each (X, Y) coordinates of all wafermaps in the current file.
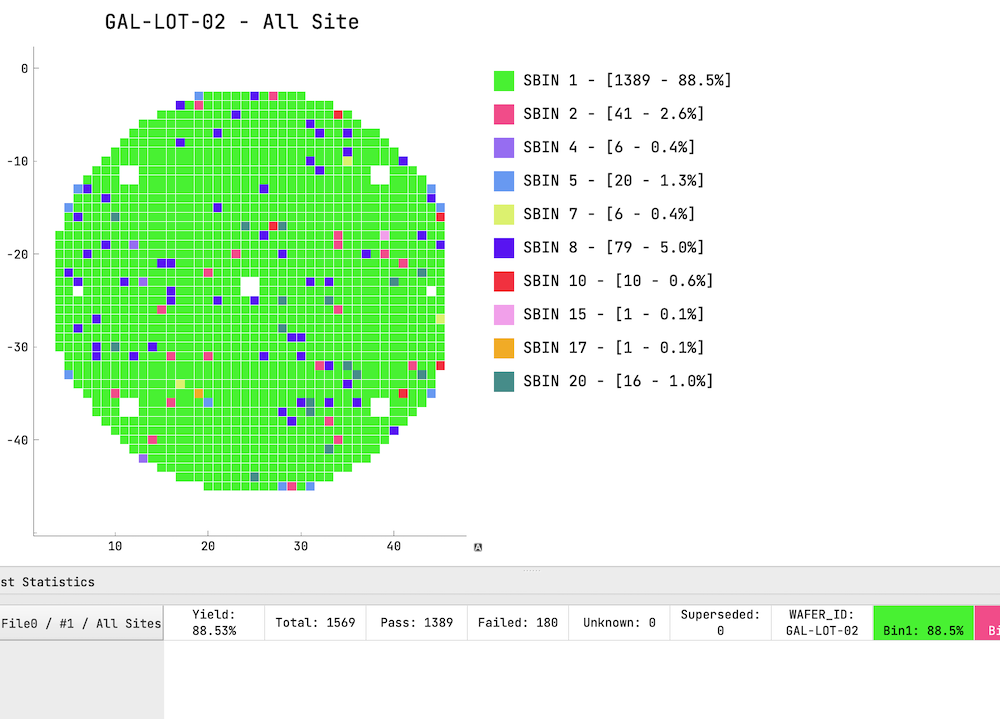
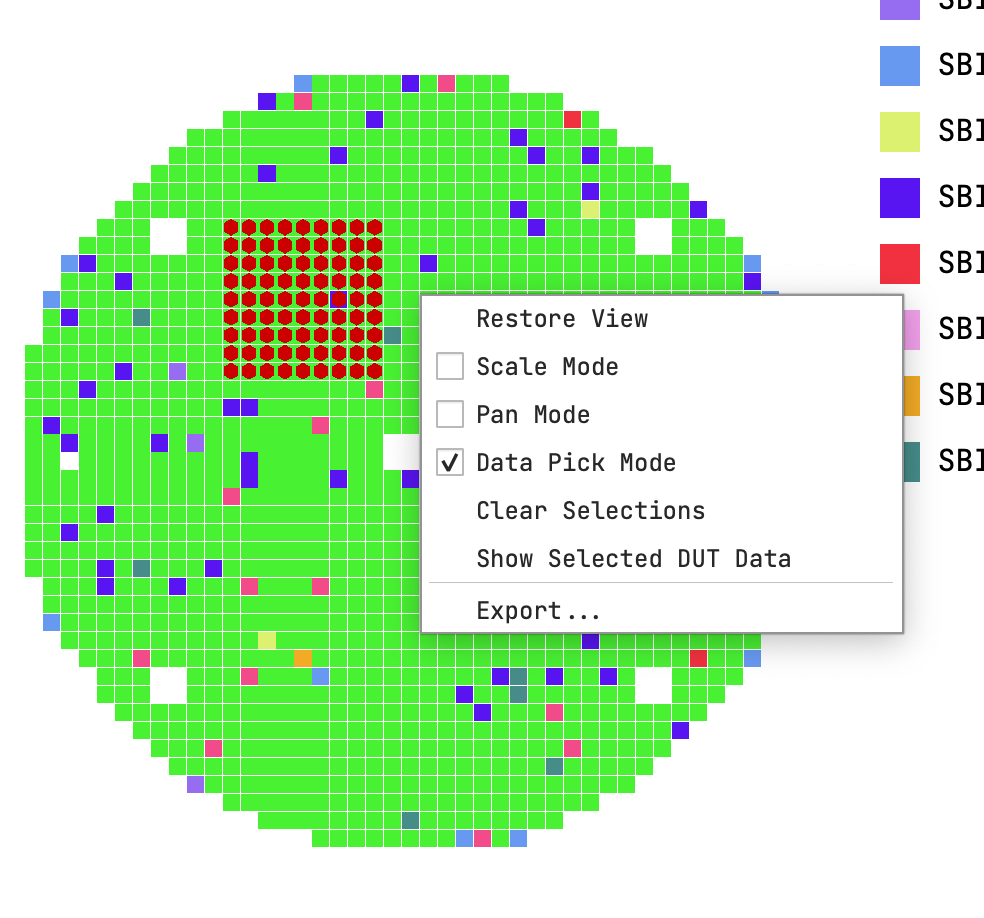
Other entries in Wafer Selection represents the wafer maps in the file, color of each die is determined by its software bin.
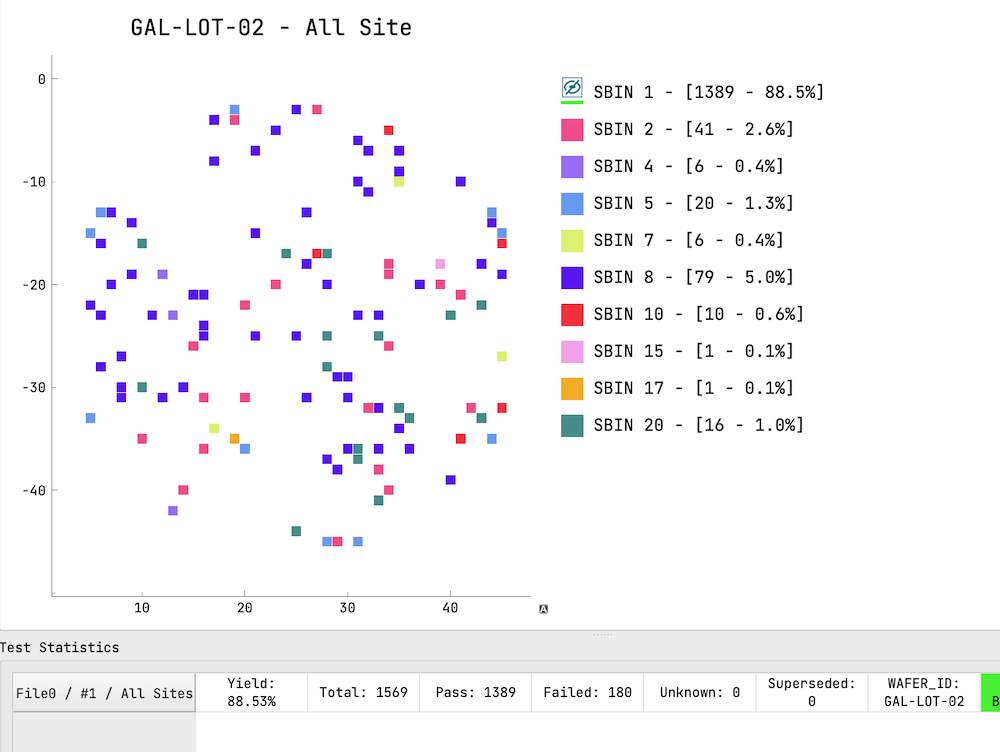
You can hide some software bins by clicking icons in the legend.
In some cases, it would be helpful to see the detailed test results of some DUTs, as shown below. It can be achieved by several methods in the STDF Viewer.
Select row(s) of interest and right click, click Read selected DUT data in the context menu.
Select cell(s) of interest and right click, click Read selected DUT data in the context menu.
Right click on a plot and select Data Pick Mode, select a region of interest then right click and select Show Selected DUT Data. Remember you can use legend icon to hide some data to help you select.
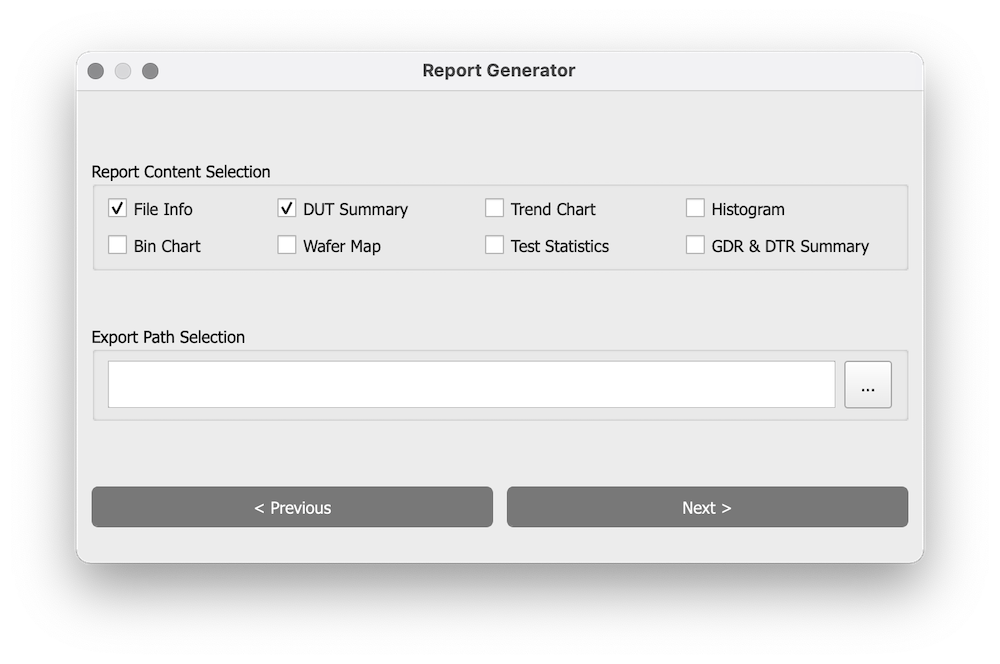
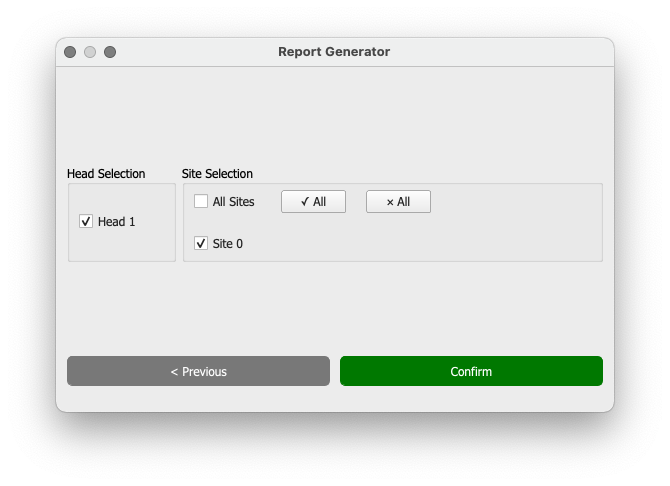
Almost all information displayed on STDF Viewer can be exported to a Excel report.
Each checkbox in Report Content Selection will be saved in a individual sheet in the report.
File Info: File properties, MIR, MRR, ATR, RDR and SDR inifo.DUT Summary: Content in DUT Summary table, test data will be added if test items are selected.Trend Chart: Trend Plot + Statistics.Histogram: Histogram Plot + Statistics.Bin Chart: Bin Plot + bin summary.Wafer Map: All Wafermap Plots.Test Statistics: Statistics of all selected test items.GDR & DTR Summary: All GDR and DTR info.
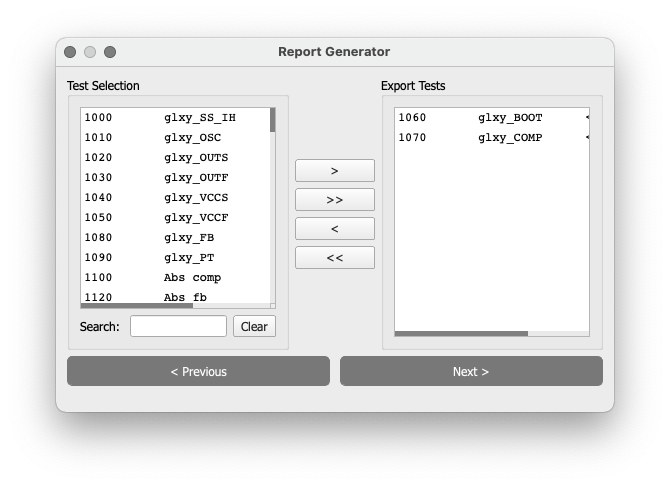
The numbers of figures/data in the report are based on numbers of tests in Export Tests and selected Heads and Sites.
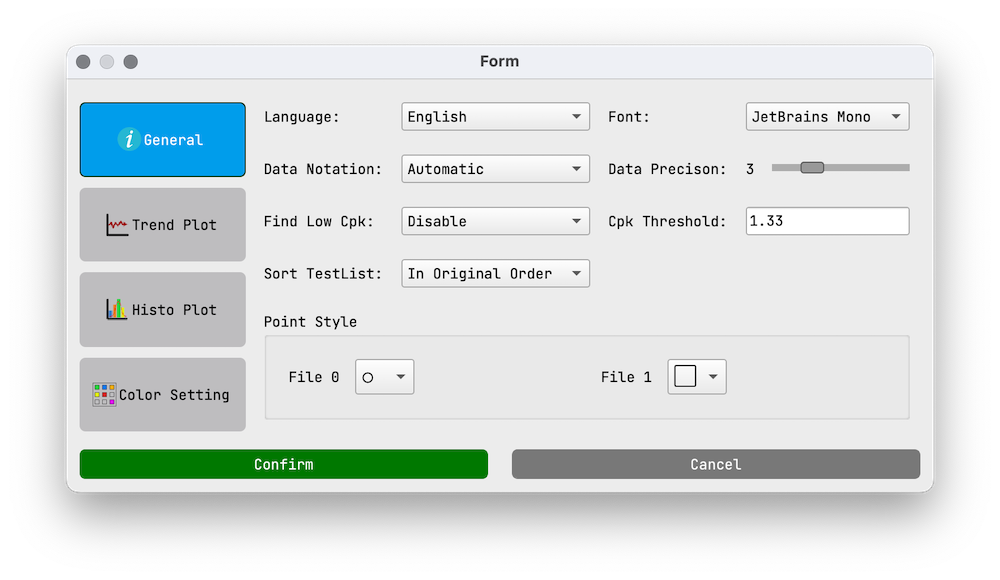
STDF Viewer offers a global setting UI, which can change the appearance of figures, colors of each sites/bins, etc. in STDF Viewer or the exported report.
The description should be self-explanatory, feel free to play it around.
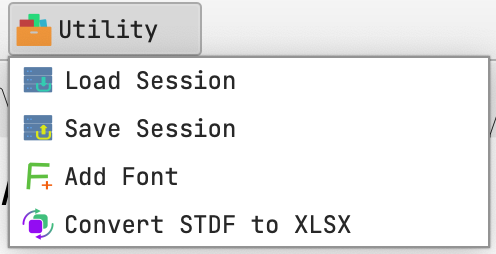
There is a Utilities button on toolbar from V4.0.0.
You can save current parse cache as a session so that you don't have to reload STDF files again, it can be helpful if you need to access some STDF multiple times.
This process is much simpler then previous releases. All you need to do is select a .ttf font and select it in Settings!
This tool can dump STDF records into a xlsx file, it can be used for debugging.
If you have encountered any error, follow these steps to create a report:
- Open STDF-Viewer and click
Aboutin the top-right corner.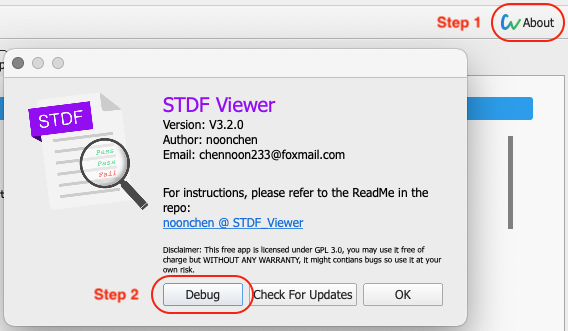
- Click
debugbutton to show the debug panel.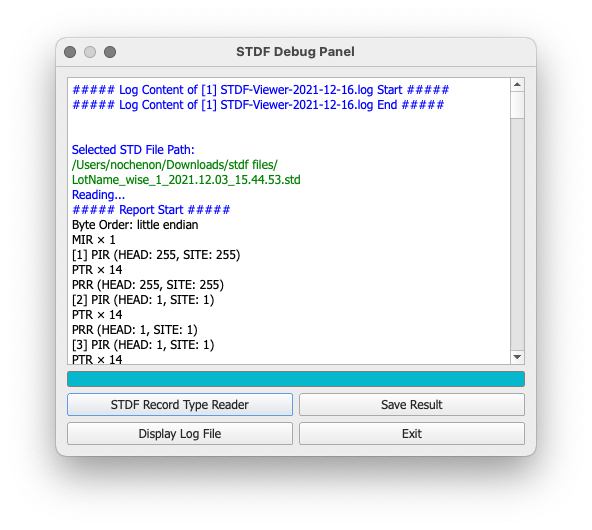
- Click
Display Log Fileto print all the error logs on the screen; If the error is file-related, clickSTDF Record Type Readerand select the file that triggers the error. - Click
Save Resultand create an issue on github.
STDF Viewer uses code from the following open sources, much thanks to their authors.
Not used in version 4.0.0 and above:
Not used in version 3.0.5 and above:
STDF Viewer is licensed under GPL V3.0, which means the software is free but I don't take any responsibilites if anything goes wrong due to the usage of the STDF Viewer, it is always safe to be skeptical about the results or images on the STDF Viewer.
The icons that I designed for STDF Viewer is licensed under Attribution-NonCommercial 4.0 (CC BY-NC 4.0).
Pull requests and bug reports are always welcomed.
