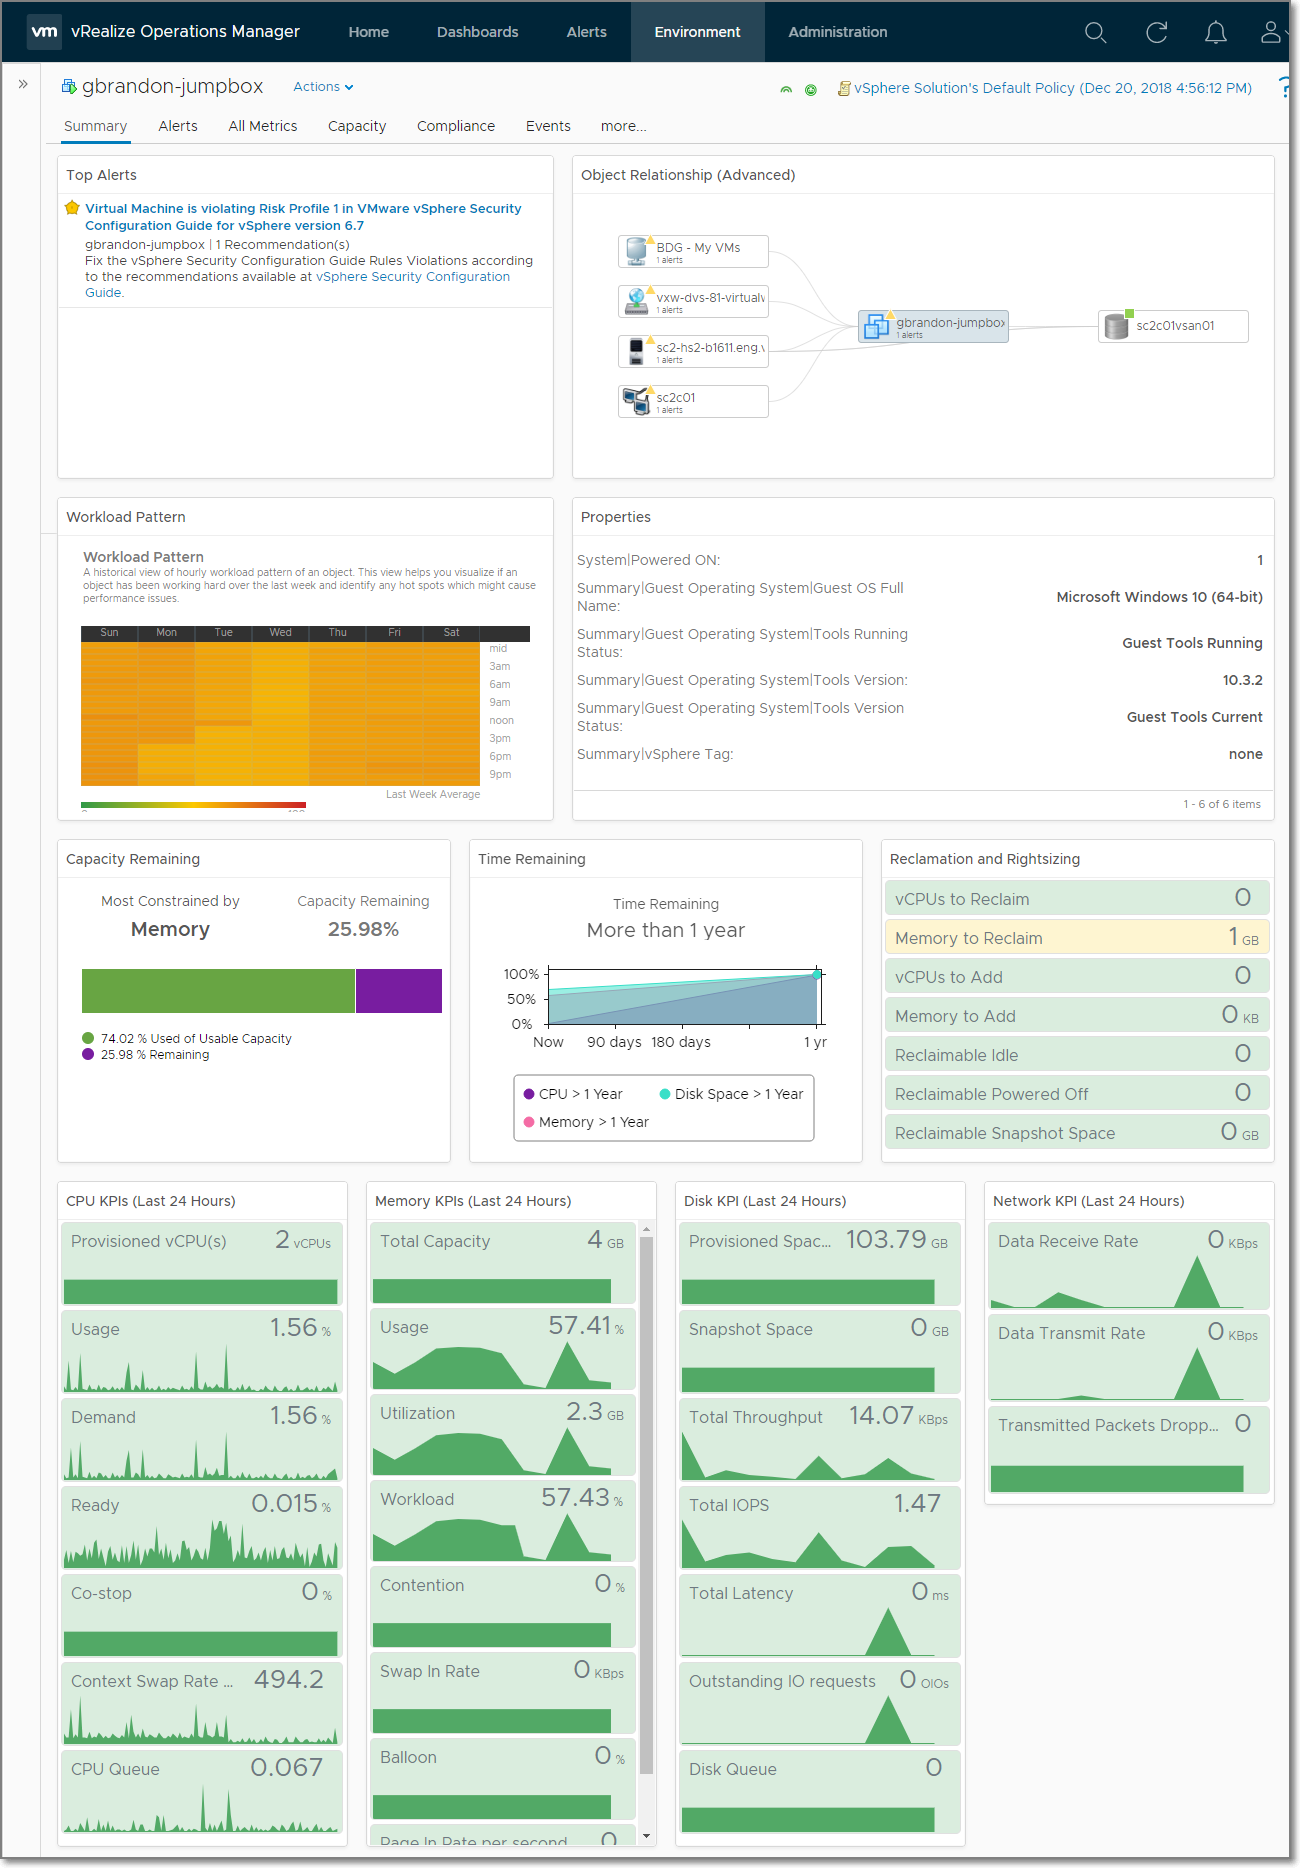
Custom VM Summary Dashboard for vRealize Operations 7.0, 7.5, and 8.0
This dashboard is designed to replace the out of the box summary dashboard for Virtual Machine objects in vRealize Operations. It's intended to give a high level overview of a virtual machine by showing alerts, capacity, and performance KPIs to help quickly identify areas of concern for additional troubleshooting.
Dashboard
Installation
- Import the dashboard at
Dashboards/Actions/Manage Dashboards/Import Dashboards.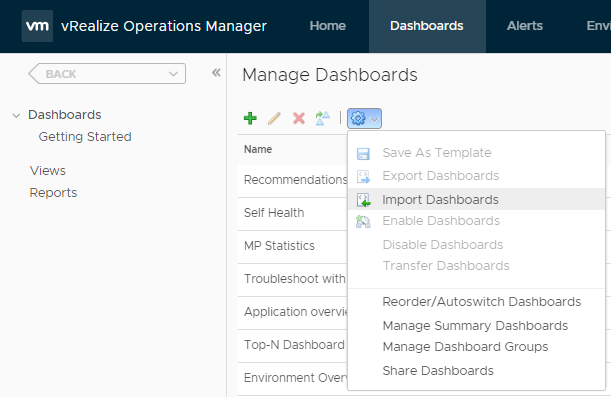
- Click
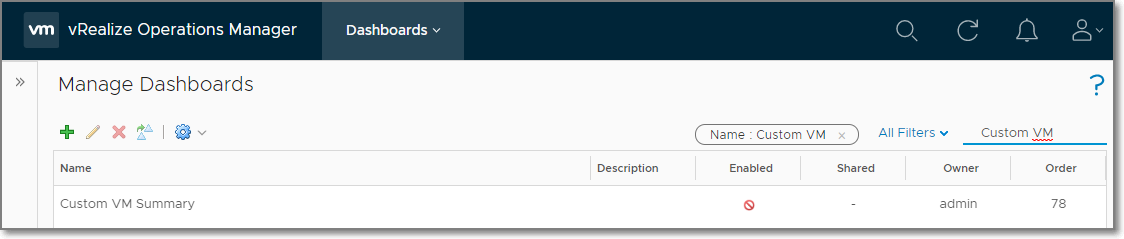
Browse...then select the file named Dashboard - Custom VM Summary.zip - The dashboard should now be available in in the dashboard list. Note: The dashboard should show as disabled as it will not be usable as a typical dashboard.
- Click the gear icon then select
Manage Summary Dashboards.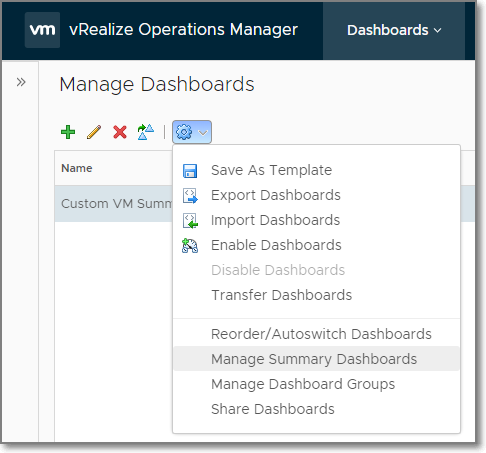
- Search for
Virtual Machine, selectVirtual Machine, then clickAssign a dashboard.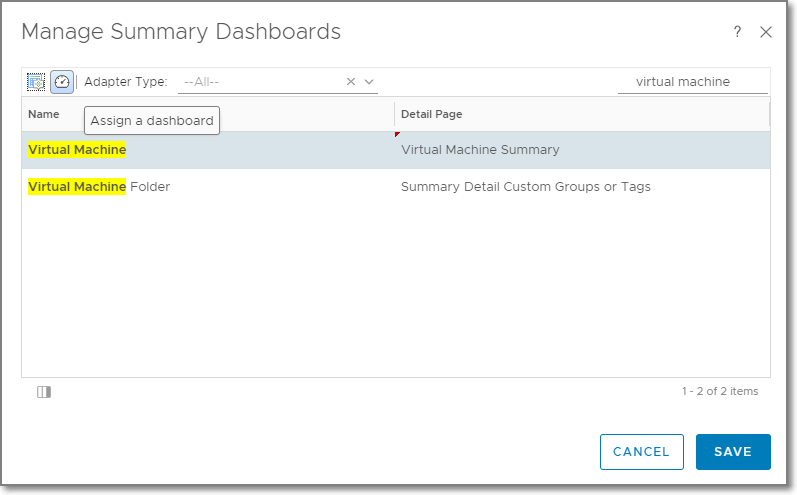
- Select
Custom VM Summarydashboard from the list then clickOK.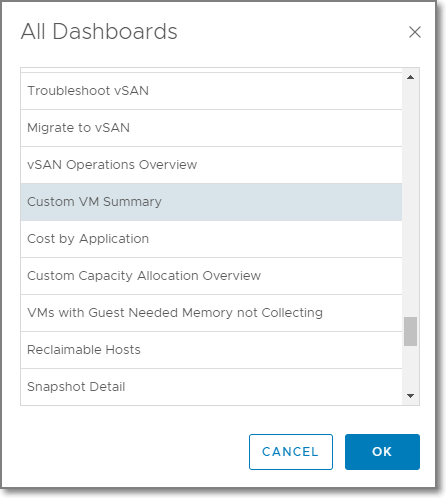
- Click
Save.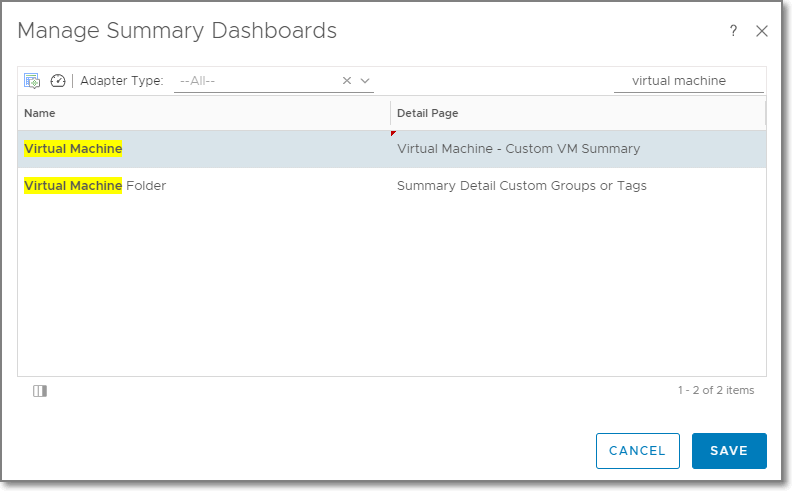
- Navigate to a Virtual Machine and view the new custom summary dashboard.
Support
This dashboard requires vRealize Operation 7.0, 7.5, or 8.0 Advanced or Enterprise edition.
Please open an issue for feedback.