Seer - a gui frontend to gdb for Linux. (Ernie Pasveer epasveer@att.net)
This project is actively worked on. The aim is a simple, yet pleasing gui to gdb.
Please report any bugs or desired features to my email or create a task in my github project page.
* Linux
* C++17
* QT5
* QT5 QtCharts
* gdb with "mi" interpreter
Examples of the various Seer views and dialogs.
The main view for Seer looks like:
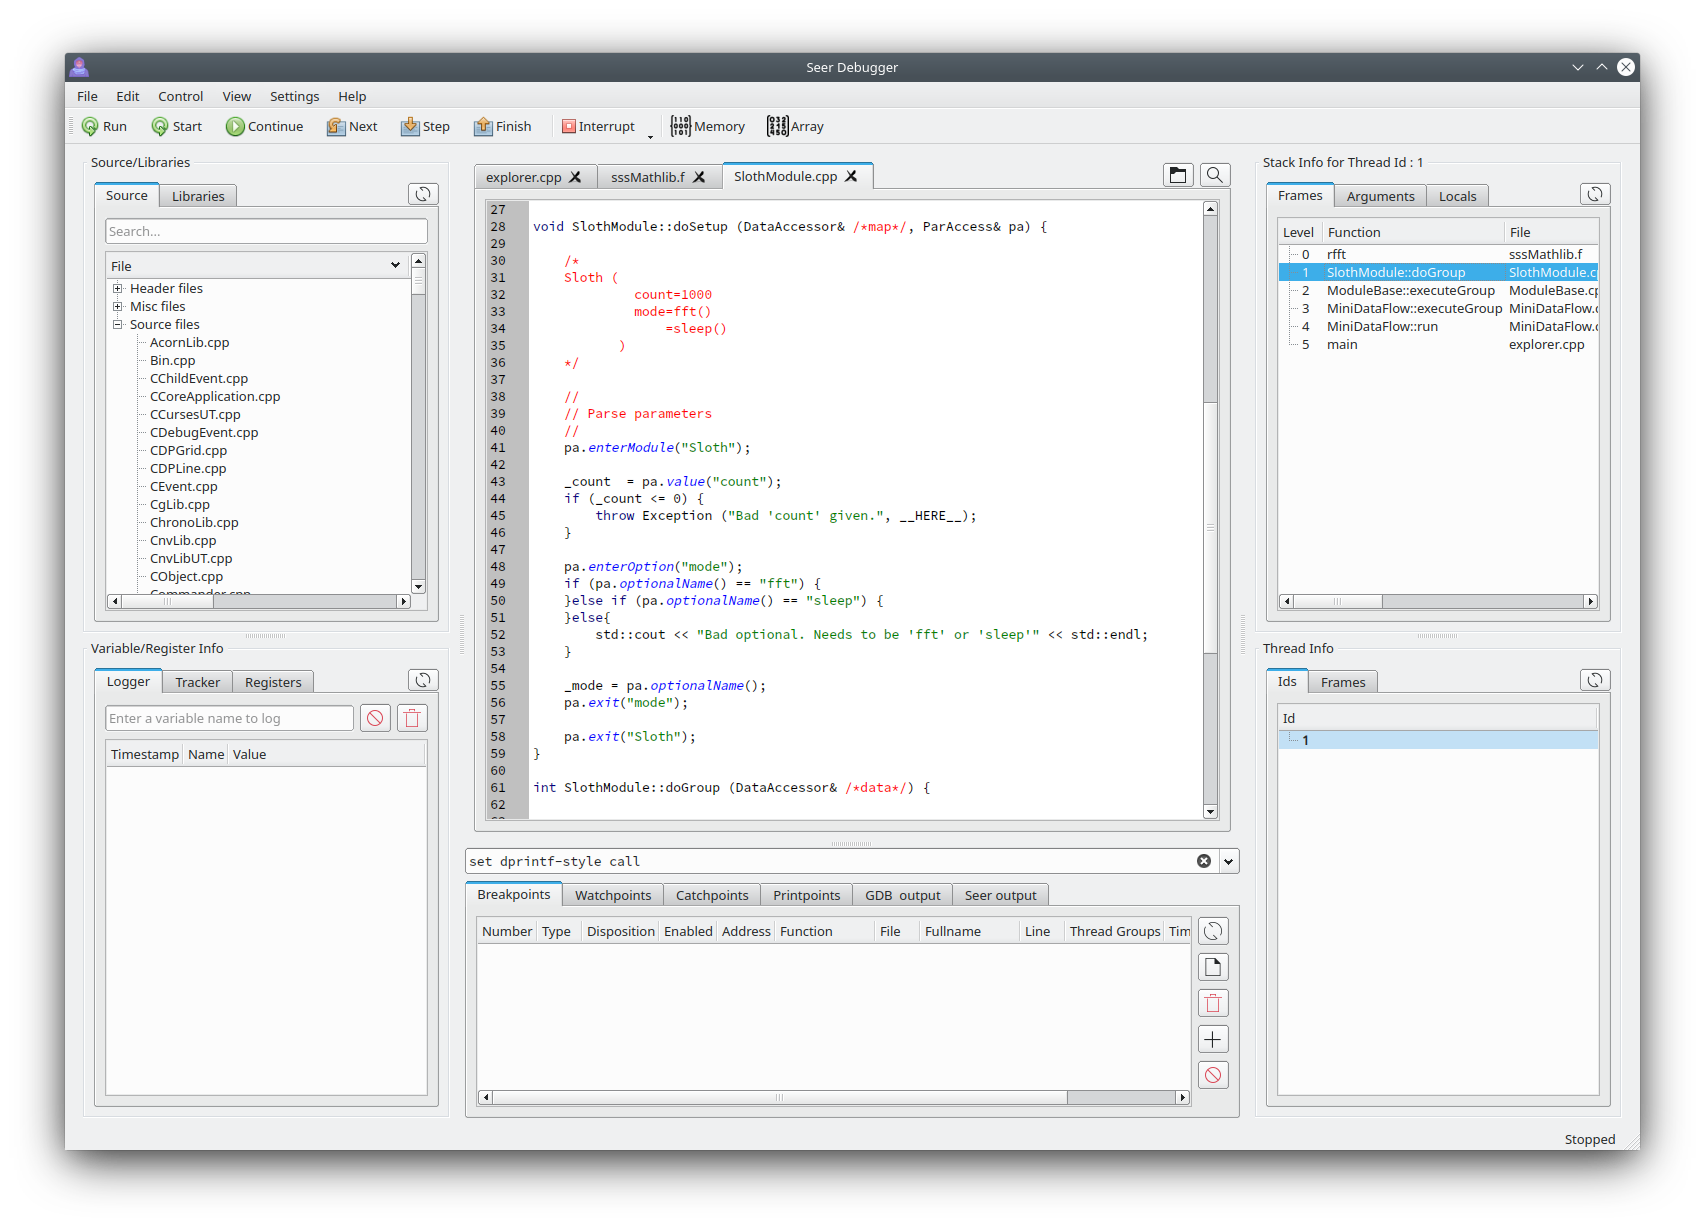
* Source/Libraries
    * The list of source/header files that were used in the program.
    * The list of shared libraries referenced by the program.
    * The list of source/header files can be searched in. This will "shrink" the list of files shown.
    * Double clicking on a file will open it in the Code Manager.

* Variable/Register Info
    * Show variable and register values.
    * "Logger" - log the value of a variable. Manually enter it or double click on the variable in the file
        that is opened in the code manager.
    * "Tracker" - create a list of variables to show the value for whenever gdb reaches a stopping point.
      (step, next, finish, etc.) When the stopping point is reached, all variables in the list will show
      their potentially new value.
    * "Registers" - show the values of all cpu registgers.

* Code Manager.
    * The large area of the middle part of the Seer gui.
    * Source files are opened in this view.
    * Text in a file can be seached for with ^F.
    * Variables can be added to the "Logger" by double clicking the variable name.
      Double click with CTLR key pressed will prepend variable with "*".
      Double click with SHIFT key pressed will prepend variable with "&".
      Double click with CTRL+SHIFT key pressed will prepend variable with "*&".
    * Variables can be added to the "Tracker" by selecting the varible name and RMB and select
      "Add variable to Tracker".
    * Variables can be added to the "Memory Visualizer" by selecting the varible name and RMB and select
      "Add variable to Memory Visualizer".
    * A breakpoint/printpoint can be created by RMB on a specific line.
    * Can execute to a specific line by RMB on a specific line.
    * Tabs in this view can be detached by double-clicking a tab.

* Breakpoints, Watchpoints, Catchpoints, Printpoints, manual gdb commands, and logs.
    * The area below the Code Manager.
    * Manual commands.  Manually enter a gdb or gdbmi command.
      The commands are remembered for the next Seer use.
    * Breakpoint manager. Create and manage breakpoints.
    * Watchpoint manager. Create and manage watchpoints.
      A watchpoint monitors when a variable is accessed (read, write, read/write).
    * Catchpoint manager. Create and manage catchpoints.
      A catchpoint stops execution on a C++ throw/rethrow/catch call.
    * Printpoint manager. Create and manage printpoints.
      A printpoint is like a breakpoint but it allows you to print variables at
      that printpoint. See gdb's 'dprintf' call.
    * GDB output. A log of any output from the gdb program itself.
    * Seer output. A log of any output from the Seer program itself. As diagnostics.
    * Tabs in this view can be detached by double-clicking a tab.

* Stack frame information.
    * Stack frame list. A frame can be double clicked to change the scope (the current function).
    * Stack frame arguments. For each frame, print the arguments passed to each function.
    * Stack locals. For the current function, print the values of the local variables.

* Thread information.
    * Thread ids. A list of all threads. Double click on a thread id to change the scope (the current thread).
    * Thread frames. For each thread, list its stack frames.
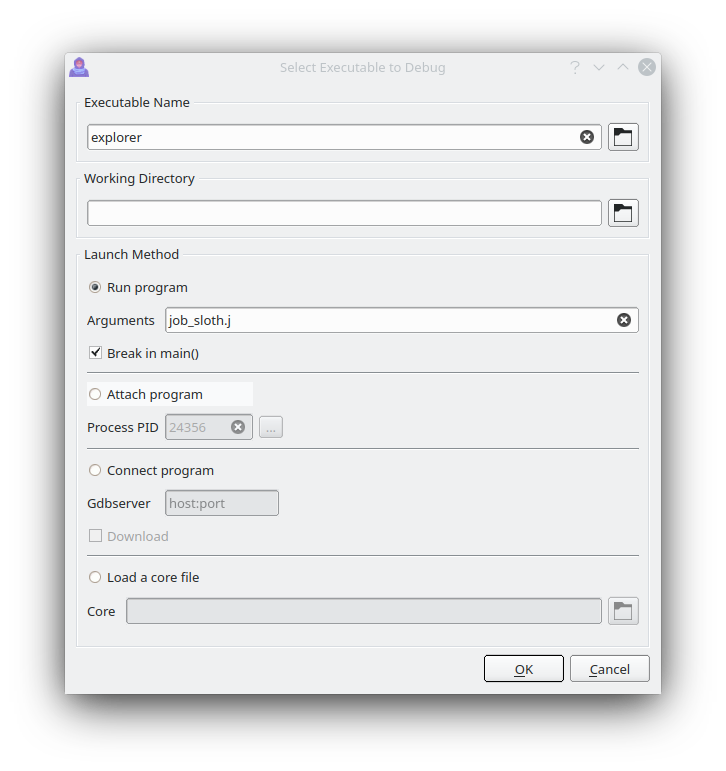
When the open exectable dialog is invoked, it looks like this :
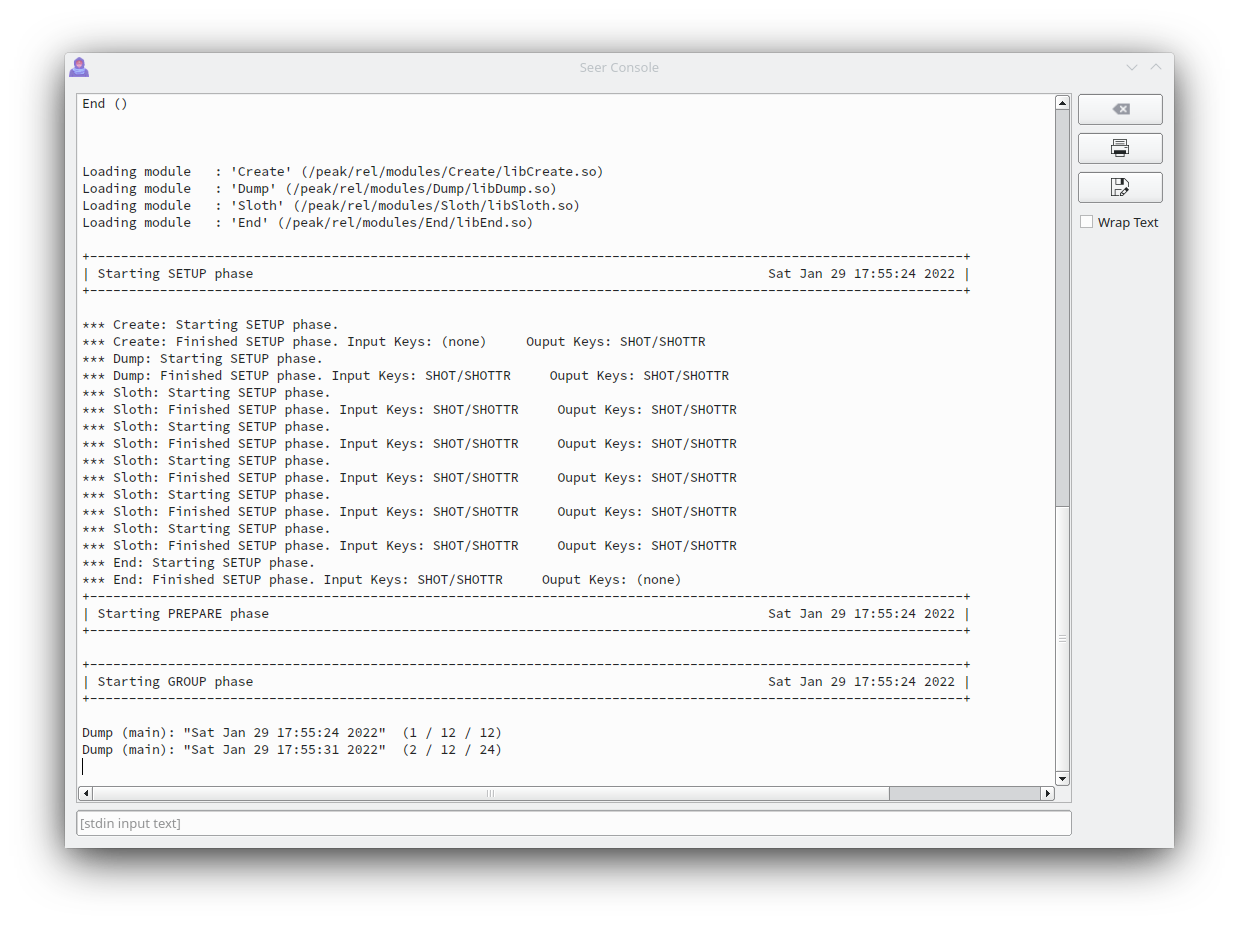
All text output from the executable will go to the Seer console. Text input for the executable can be entered via the console too.
When looking at the contents of raw memory in the Memory Visualizer, it looks like this :
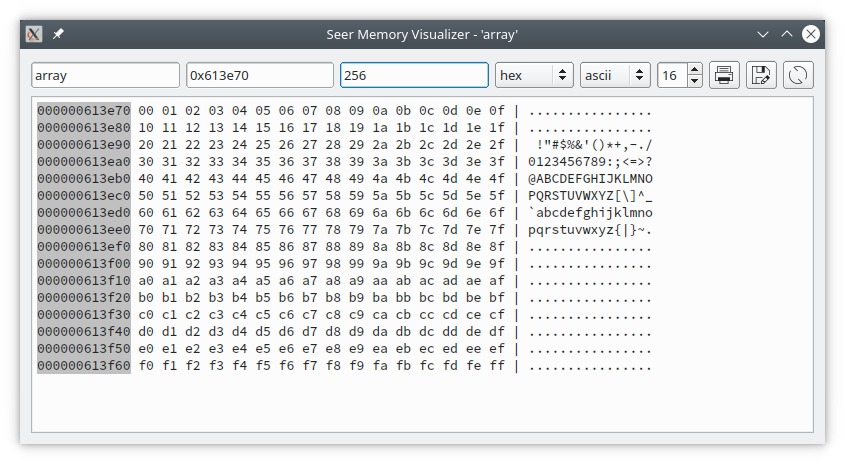
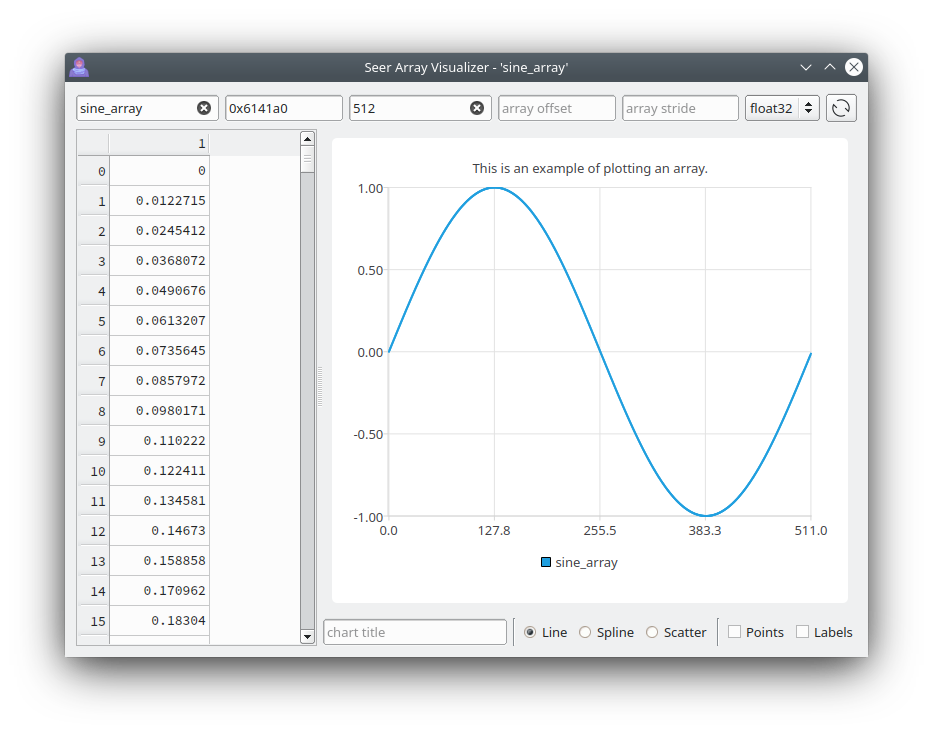
When looking at the contents of arrays in the Array Visualizer, it looks like this :
Seer is meant to easily start the program to debug from the command line. gdb has multiple methods for debugging a program. So Seer natually does too.
% seer --start myprog arg1 arg2             # Debug myprog with its arguments. Break in main().
% seer --run   myprog arg1 arg2             # Debug myprog with its arguments. Run it immediately without breaking.
% seer --attach <pid>  myprog               # Debug myprog by attaching to the currently running pid.
% seer --connect <host:port> myprog         # Debug myprog by connecting to the currently started gdbserver process.
% seer --core <corefile> myprog             # Debug a corefile for myprog.

% seer                                      # Bring up a dialog box to set the program and debug method.
% seer myprog arg1 arg2                     # Bring up a dialog box to set the debug method.
A breakpoint file can be read for --start and --run modes. This file contains previously saved breakpoints (breakpoints, catchpoints, printpoints, etc.)
% seer --run -b myprog.brk  myprog arg1 arg2   # Debug myprog with its arguments.
                                               # Run it immediately and break at points describe in
                                               # myprog.brk
Download the latest code using 'clone'.
% git clone https://github.com/epasveer/seer
Setup cmake and build
% cd seer/src
% mkdir build
% cd build
% cmake ..

% make seer
Copy the seer binary to your bin directory of choice. One of the below. May need root access.
% cd seer/src/build
% cp seer ~/bin/seer
% cp seer /usr/local/bin/seer
% cp seer /usr/bin/seer
% rehash
Or use the 'install' make target. Which will usually copy it to /usr/local/bin. May need root access.
% cd seer/src/build
% sudo make install
Send an email to epasveer@att.net for any bugs or features. Or create a task
in my github project page.