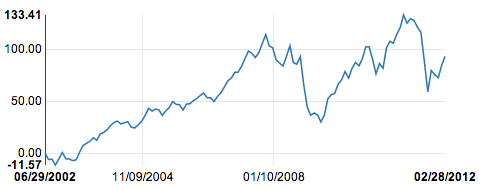
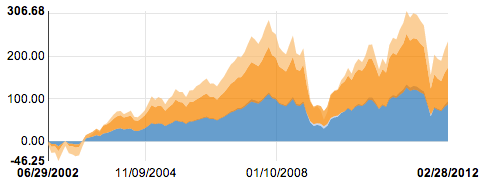
##Angular.js Directives for nvd3.js, d3.js charts
=========================
<nvd3-line-chart
    data="exampleData"
    width="600"
    height="350"
    showXAxis="true"
    showYAxis="true"
    xAxisTickFormat="xAxisTickFormat_Date_Format()"
    yAxisTickFormat="yAxisFormatFunction()">
</nvd3-line-chart><nvd3-stacked-area-chart
data="exampleData"
width="600"
height="350"
showXAxis="true"
showYAxis="true"
xAxisTickFormat="xAxisTickFormat()">
</nvd3-stacked-area-chart>


