A Dashboard providing insights of Food Security and more in countries.
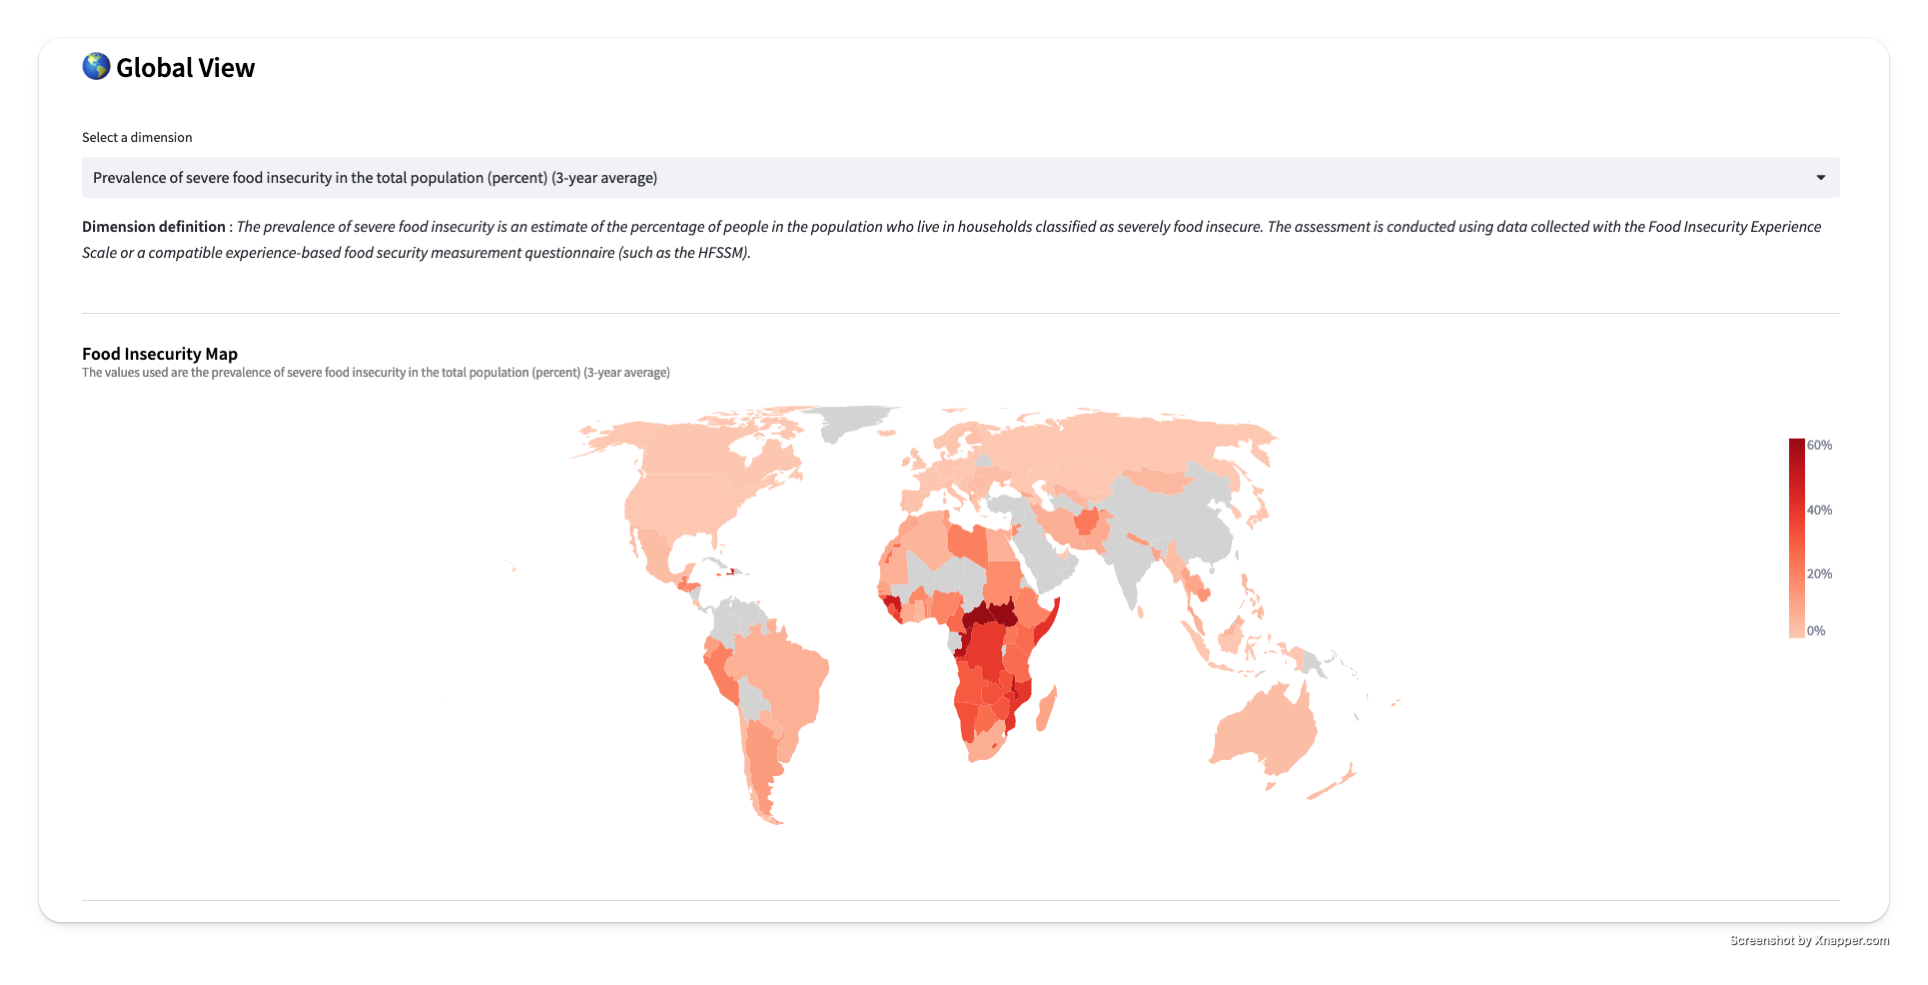
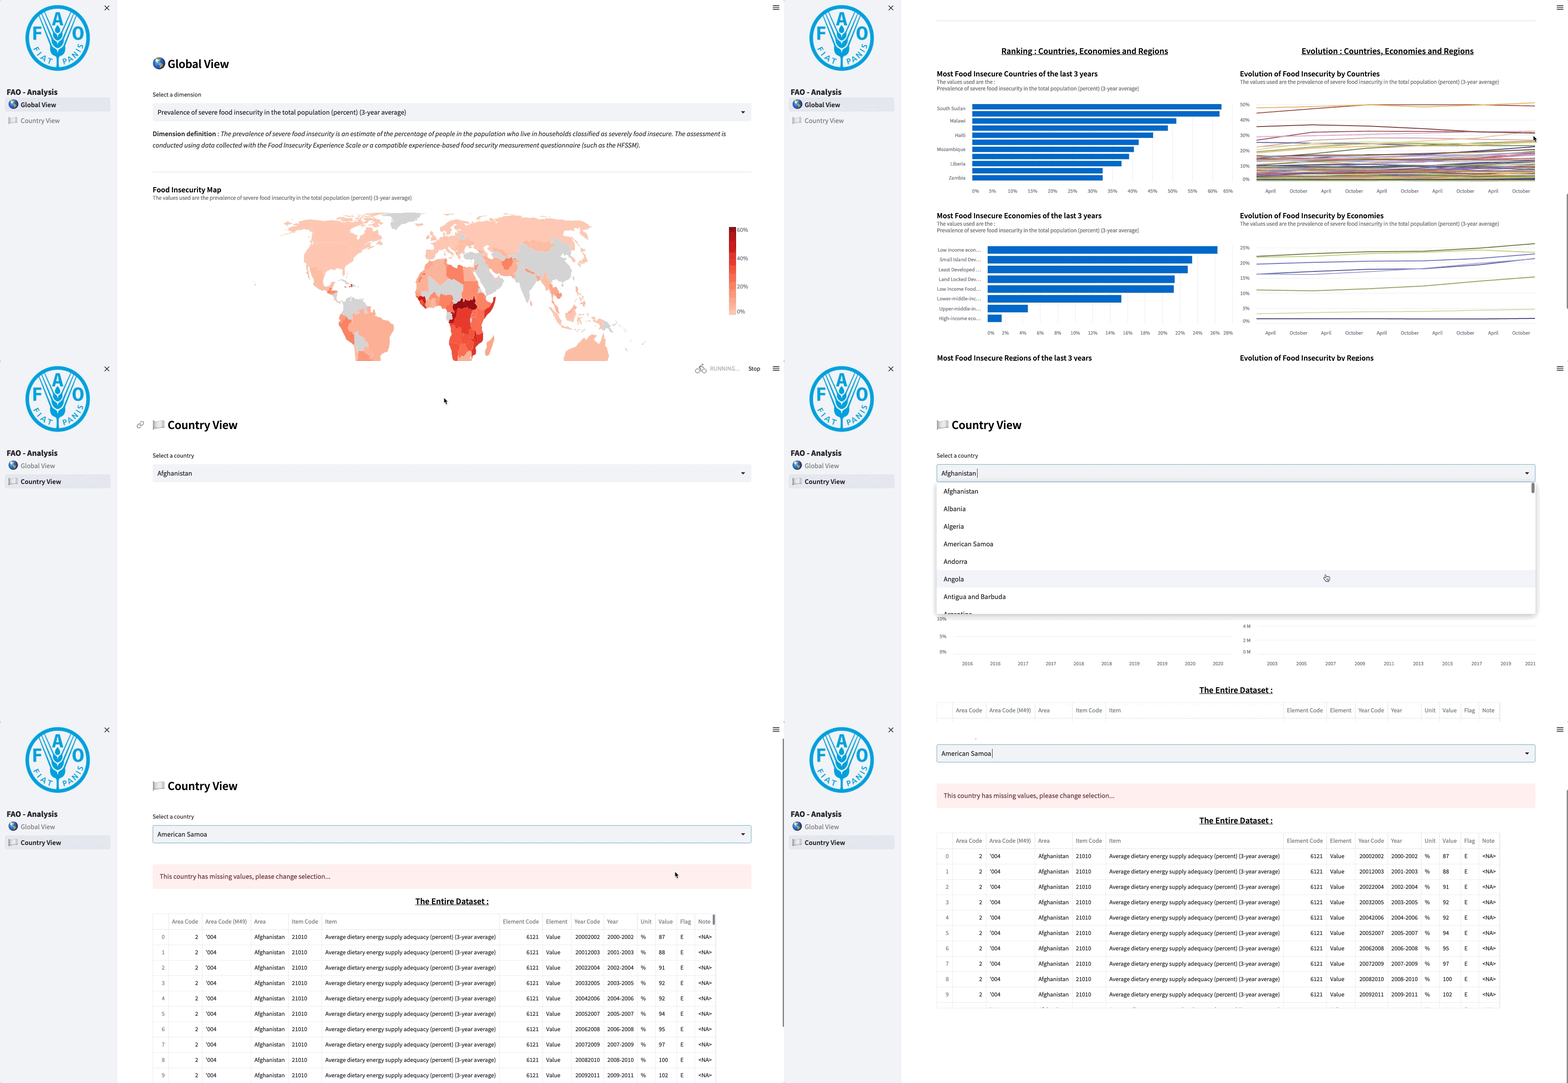
This dashboard is designed to provide an overview of the food security in the world based on public data that I present later. It consists of several different parts, each of which provides a different type of information. The main dashboard page displays information about all the countries, such as a map, ranking bar charts, evolution metrics and line charts. It also includes the possibility to select two dimensions : Food Insecurity and the Number of People Undernourished. You can have a description of those dimension when you select it.
The second page of the dashboard provides a more detailed view of the metrics by providing a select box with countries. It includes charts and a table with all the data that you can inspect in details. Some countries do not have the necessary data, if it's the case, it displays a warning bow.
Overall, this dashboard provides a comprehensive view of the food security in the world, even with missing data. It allows users to quickly identify areas of strength and weaknesses but could be improved with more dimensions and comparisons with other variables.
About The Data :
The dashboard uses data from the Food and Agriculture Organization that you can find here. They are updated frequently.
I built Google Cloud Functions to store those data into a Google Cloud Storage (Bucket). This is done by downloading the data from their website and stored into a specified bucket for more. I added a Cloud Scheduler to trigger the functions monthly.
Here is how the dashboard looks like :


