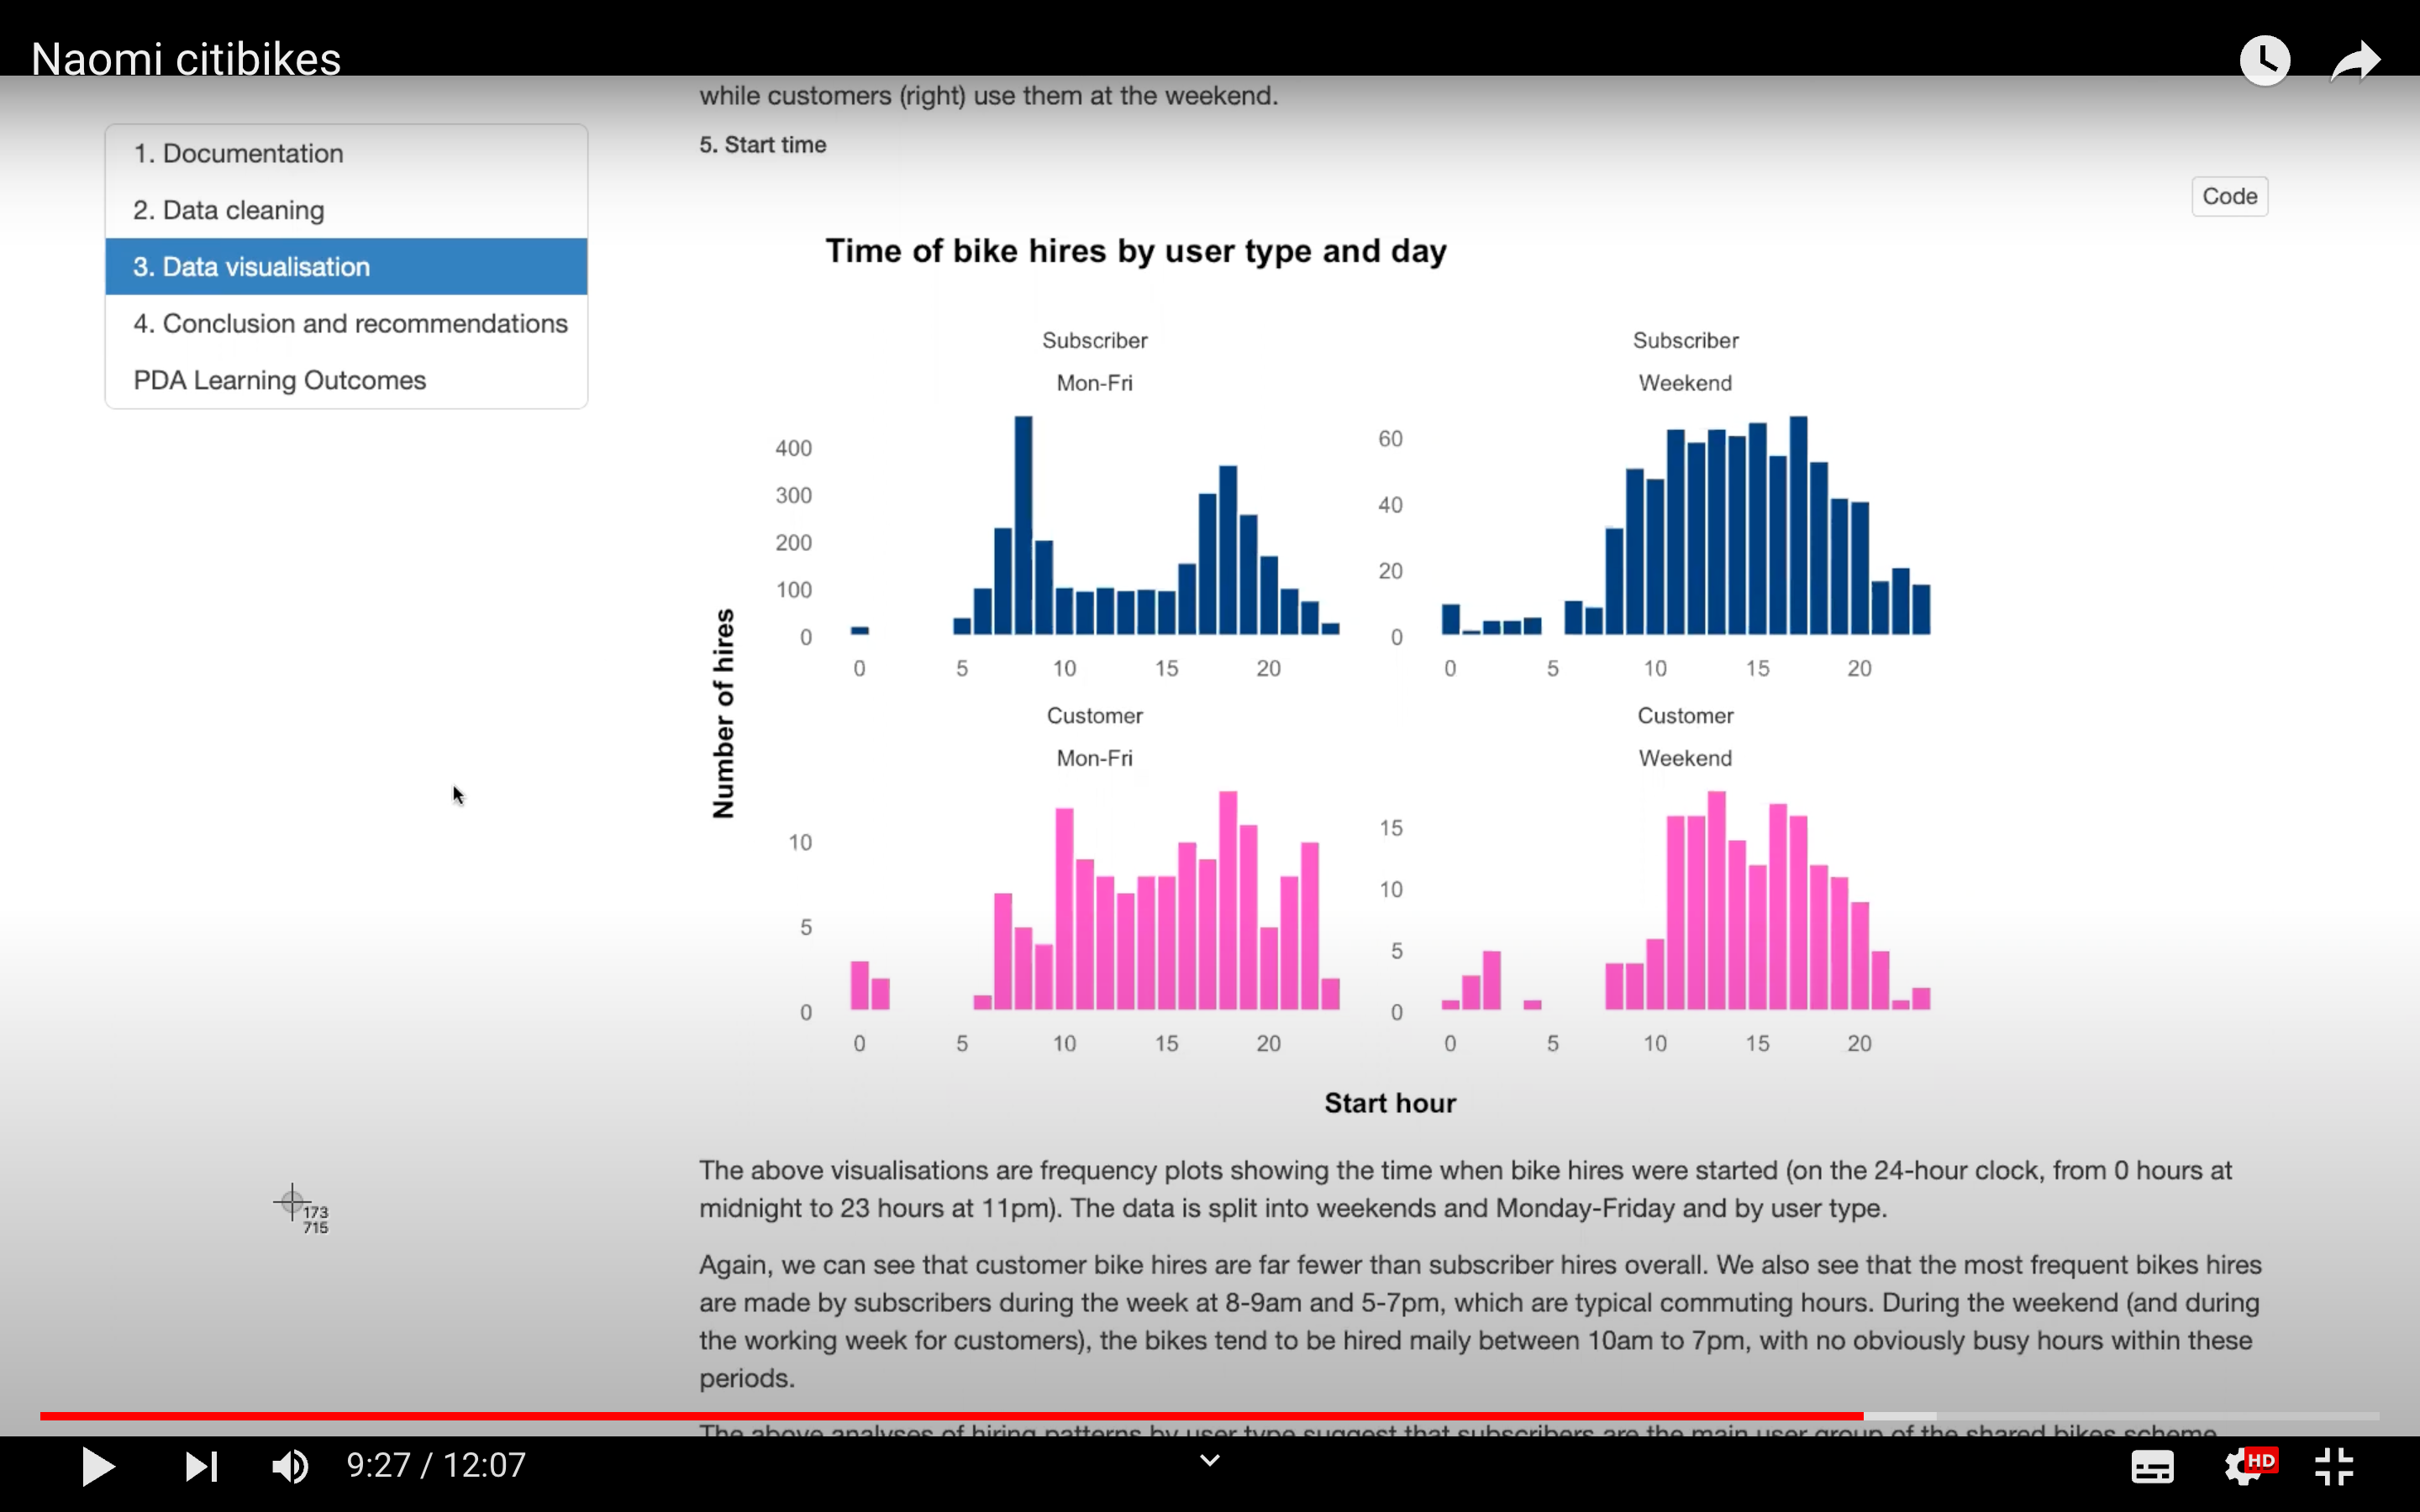
Coursework and evidence from NYC Citi bikes project for SQA PDA in Data Science.
This project was to produce an analytic report containing business insights for a non-technical audience, aimed at business executives involved with the NYC Citibikes scheme. The report, and a presentation of its contents, were produced over 4 days as a solo project for the CodeClan Professional Data Course (July 2023) and as evidence for the PDA qualification.
The recorded presentation can be viewed on YouTube:
The video is ~12 minutes and shows me scrolling through and explaining the .html report included in this repository.
The data used is a time series data frame available from tsibbledata package: nyc_bikes contains information about 4,268 individual hires of 10 bikes in 2018 as a sample from NYC's Citibikes scheme.
The data includes information about the start and end location and time of the hire, and the user type and demographics: where type is subscriber (annual membership) or customer (1 or 3-day pass) and demographic data is the user's year of birth and gender.
Project files include:
- nyc_bikes/
- analysis/
- analysis_pda_report.Rmd - final analysis report, including information about the business domain and data flow, data ethics and quality, data wrangling and cleaning steps, and visualisations and statistics. Insights and business-relevant recommendations are noted throughout and summarised at the end.
- exploration_playground.Rmd - a supporting notebook with additional exploration and plots, not all have been included in the report.
- analysis/
PDA evidence: 3.7 Writing documentation for function/program
Additional variables were added, with calculated rider age and bike hire duration, as well as extracted date-time elements from the start and end times.
The data is mostly clean in its raw state, so the only cleaning steps involved recoded to NA a few unreasonable values for rider age and hire duration.
A tibble format of the wrangled and cleaned data was also made to use in summary statistics (without the timeseries index column, start_time).
Through analysis of bike hire frequency and bike hire duration (KPIs for bike hire service) according to user demographics, user type, hire location, dates and times, I have found insights about:
- Who uses the bikes
- Where hires begin
- The busiest time periods
- Patterns in how different types of users use the bikes
