The objective of the Plugin is to make it easier for Pulsar customers to query the NS1 API for Performance and Availability data of their pulsar Applications and Jobs.
This is a backend datasource plugin, and it uses the public open source NS1 API library for GoLang. You can find the library here
This is a work in progress, and currently querying Performance and Availability data are supported.
As of now this plugin must be installed as a local plugin. We are working on having the plugin published in Grafana's open source plugin catalog.
You need to download the plugin from the repository under the Releases section. Unzip
the file and follow the instructions on Install Plugin
As of now the plugin is unsigned, and therefore you will have to enable the loading
of unsigned plugins on your Grafana instance.
The configuration screen will only ask for a valid NS1 API key. This key will be used to query the NS1 API. Also, the key will be stored securely by Grafana in local storage.
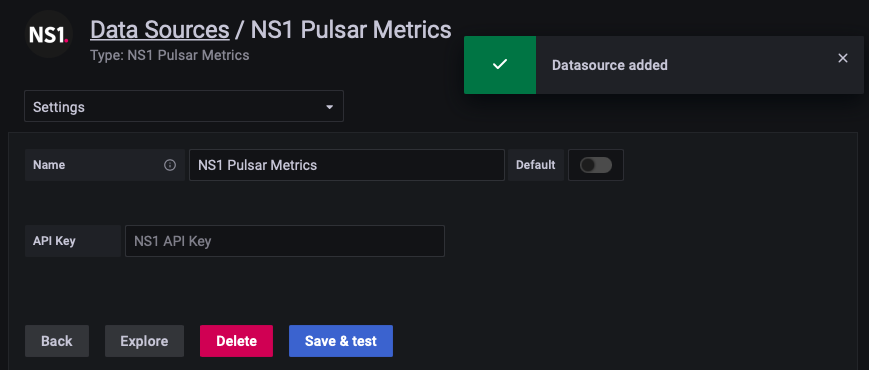
Once you enter your API Key, click on the Save and Test button. The Plugin will
verify your Key against the NS1 API.
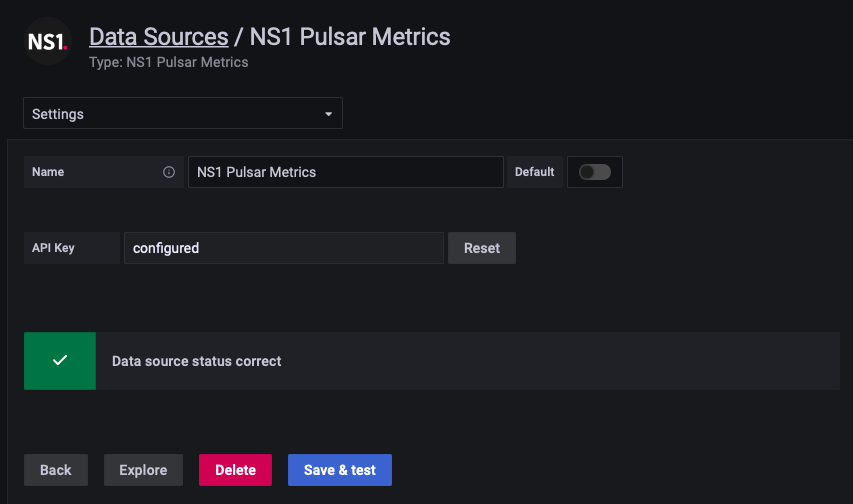
After the key is verified, you can hit the Back
button and continue with your dashboard creation.
For the backend part you can follow the instructions from the Grafana documentation. To build for all architectures, execute
mage -v buildAllFor the frontend part:
yarn install
yarn build
If something goes wrong when building the frontend, try to delete the node_modules and the yarn.lock file: rm -rf node_modules yarn.lock. Then repeat the commands (yarn install, yarn build).
After creating a dashboard, select as Data source pulsar-datasource. This will bring
the Pulsar Query Editor.
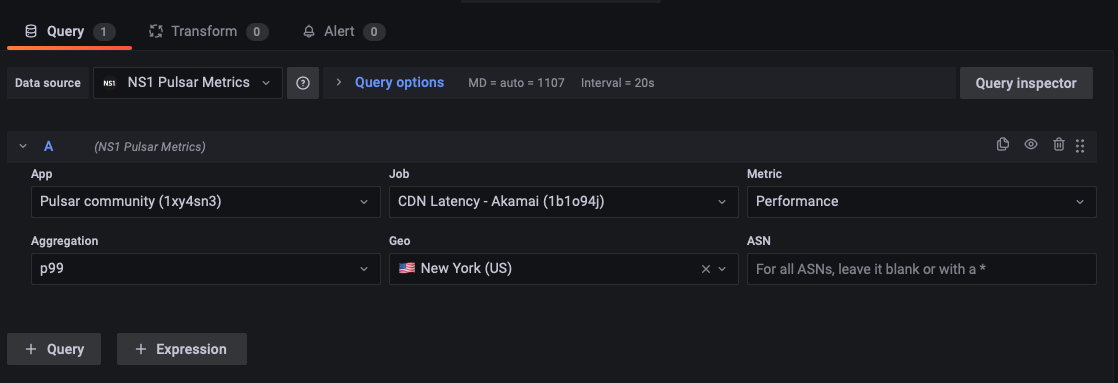
It is possible that the first time you use the Pulsar Datasource with the Query Editor you may experience a little delay, as the backend is loading the Applications and Jobs. Further usage won't show this behavior, as this data will be cached by the Plugin.
Once the Query Editor is loaded, you may be able to select a Pulsar App and a Job belonging to the App. Next is to select the metric type, Performance (Latency) or Availability, and the Aggregation. These are the minimum parameters to get data, but be aware that you may need to specify GEO and ASN to have meaningful data. If you don't specify at least a GEO code, you will be fetching the global behavior of the selected Job, and that may not be optimal.
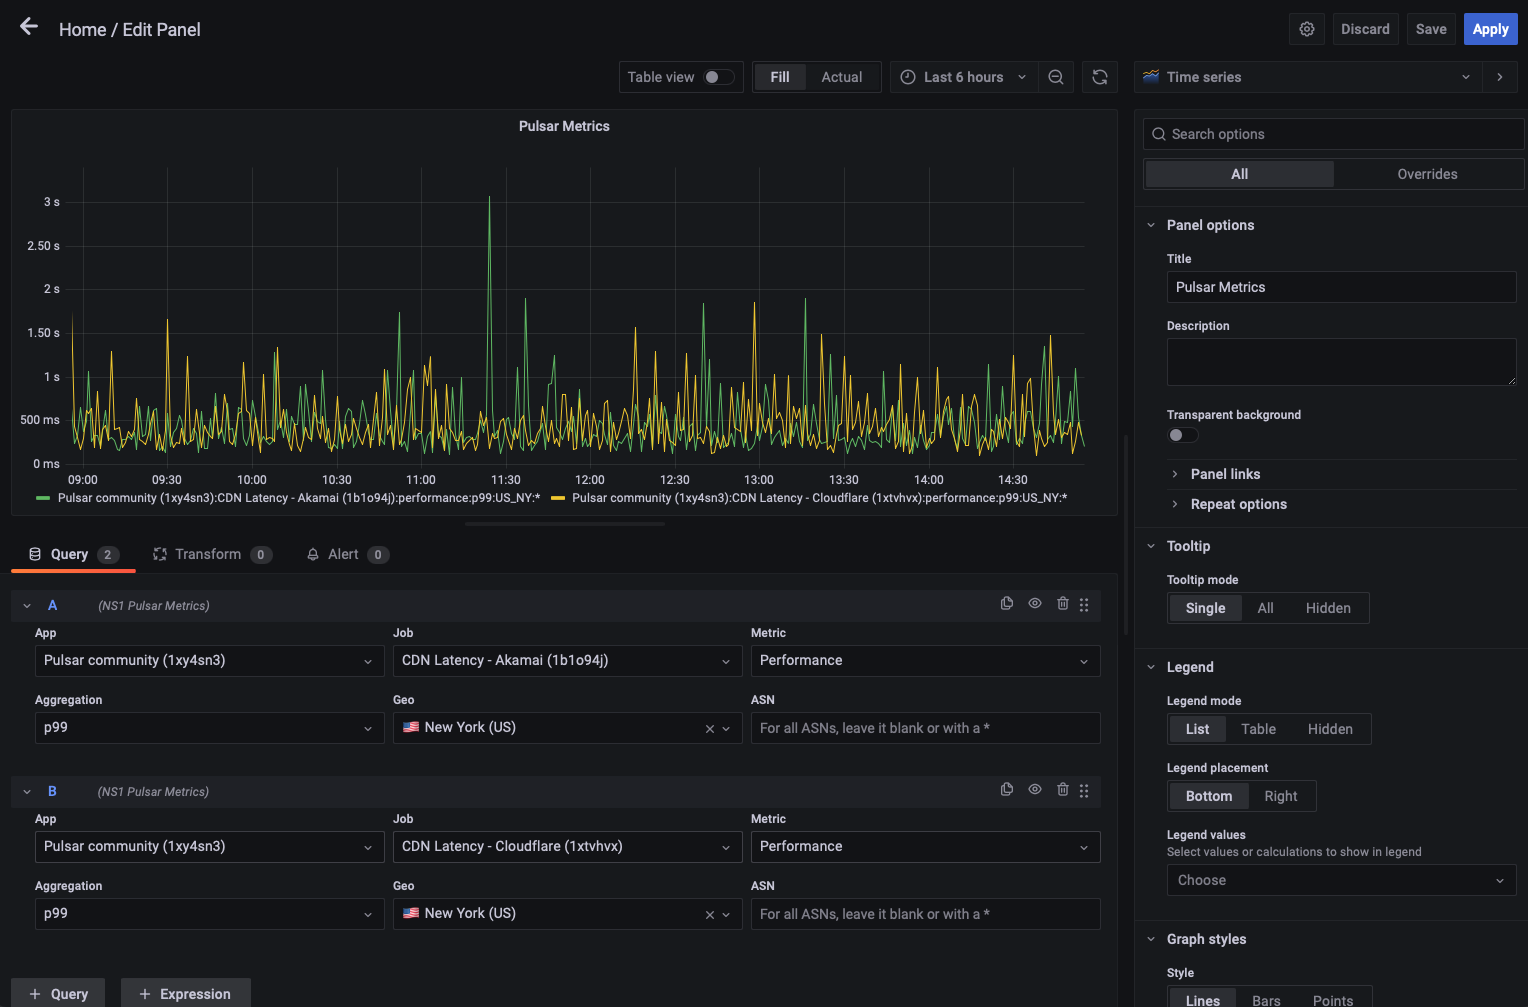
You can add as many queries as you want, but you will usually add as many as the number of active jobs you have configured.
Please report any problems found on the repository issues section.