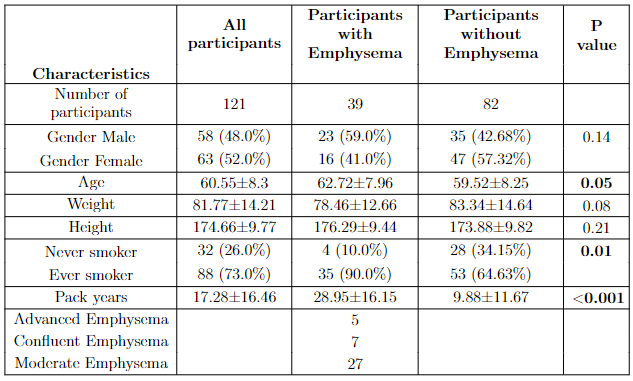
This tool creates a demographics table from attributes extracted from LifeLines data. Participants in each group of interest are specified (here emphysema groups). A table like the one shown below will be created.
The code for the emphysema experiment can be found here here
For the BMI experiment the code can be found here
Figure: Results from running the script for the emphysema experiment
Below a detailed description of the code (based on the BMI script - a modified version of the emphysema)
The provided Python script reads BMI data from Lifelines cohort and REDCap, performs data cleaning (eg. compares age values between the two datasets), and calculates various statistics. This includes BMI distribution, demographic characteristics, and statistical tests comparing low and high BMI groups.
- Lifelines BMI data loaded from two CSV files (
high_BMI_lifelines_final.csvandlow_BMI_lifelines_final.csv). - REDCap BMI data loaded from a CSV file (
BMI_6-6-2023.csv).
- Renames the column
agetoage_at_scanin both Lifelines datasets. - Concatenates high and low BMI Lifelines datasets into a single DataFrame (
BMI_lifelines). - Removes rows from REDCap dataset where
participant_weightorparticipant_lengthis missing. - Keeps only rows in REDCap dataset where
nodule_id_n10is not NaN. - Selects only rows in REDCap dataset with participants present in Lifelines cohort.
- Extracts gender information from REDCap export to avoid errors.
- Maps numeric gender values to
MaleandFemale. - Creates separate DataFrames for high and low BMI groups.
- Defines a function
calculate_ageto calculate age based on birth date and scan date. - Applies this function to calculate
age_at_scancolumn in REDCap dataset. - Compares and corrects discrepancies between Lifelines and REDCap age data.
- Calculates and prints various demographic statistics.
- Checks for missing values in gender, smoking attributes, and confirms correctness of certain calculations.
- Calculates and prints p-values for statistical tests comparing demographic characteristics between high and low BMI groups.
- Calculates BMI values for each participant using the formula BMI = weight / (height^2).
- Removes NaN values and outliers from BMI data.
- Performs a t-test to compare BMI distributions between low and high BMI groups.
- Prints number of participants in low and high BMI groups and their BMI ranges.
- Generates a histogram of BMI distribution and saves it as a PNG file.
- Outputs detailed demographic statistics DataFrame (
df_statistics) and saves it as an Excel file (demographics_BMI_statistics.xlsx). - Outputs histogram of BMI distribution as a PNG file (
BMI_distribution.png).
- Some participants were manually removed due to specific criteria, such as having at least 10 nodules.
- The script performs statistical tests and outputs p-values for gender, age, weight, height, smoking status, and pack years.
- BMI distribution histogram includes average BMI and standard deviation, along with lines indicating highest and lowest BMI values in each group.
Pull requests are welcome. For major changes, please open an issue first to discuss what you would like to change.


