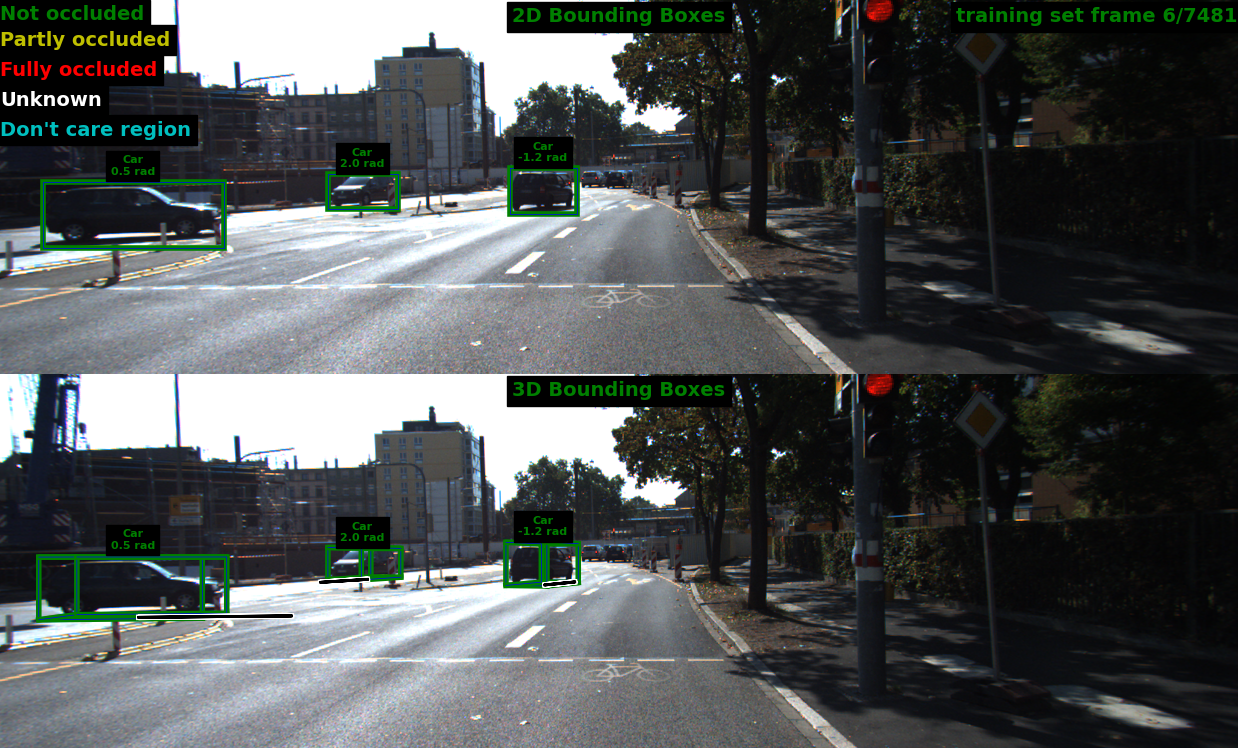
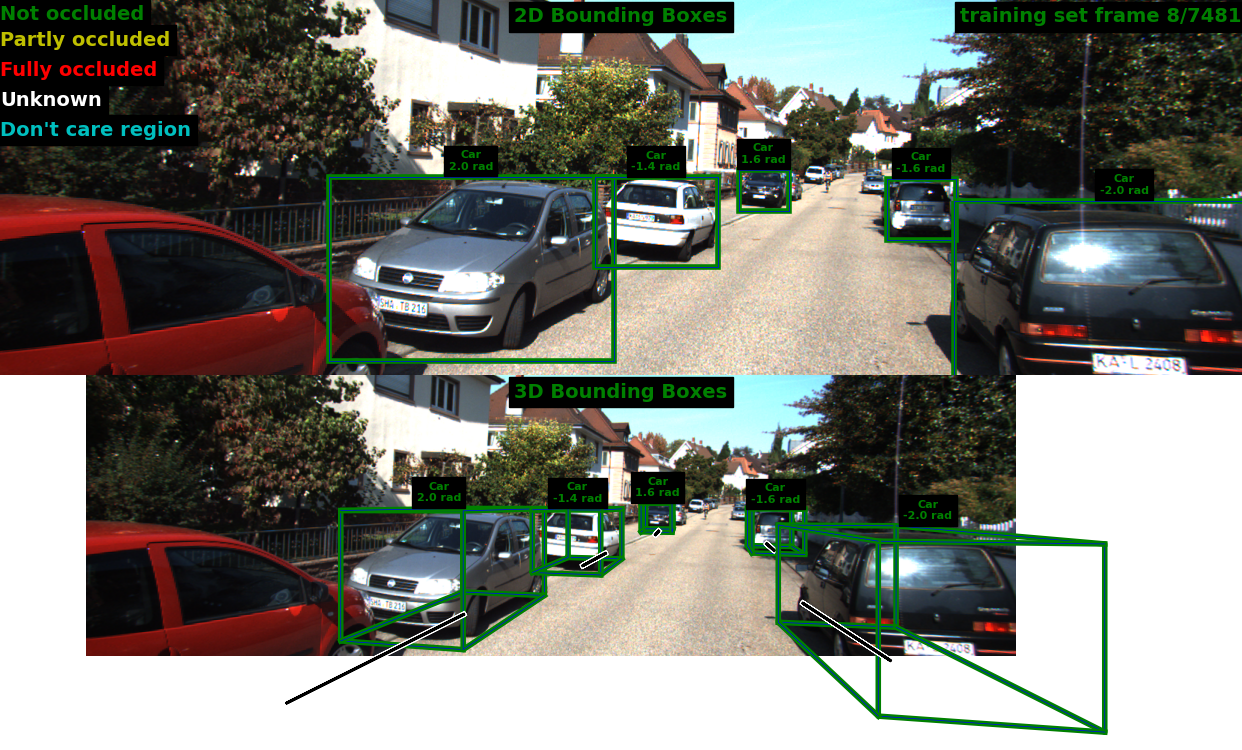
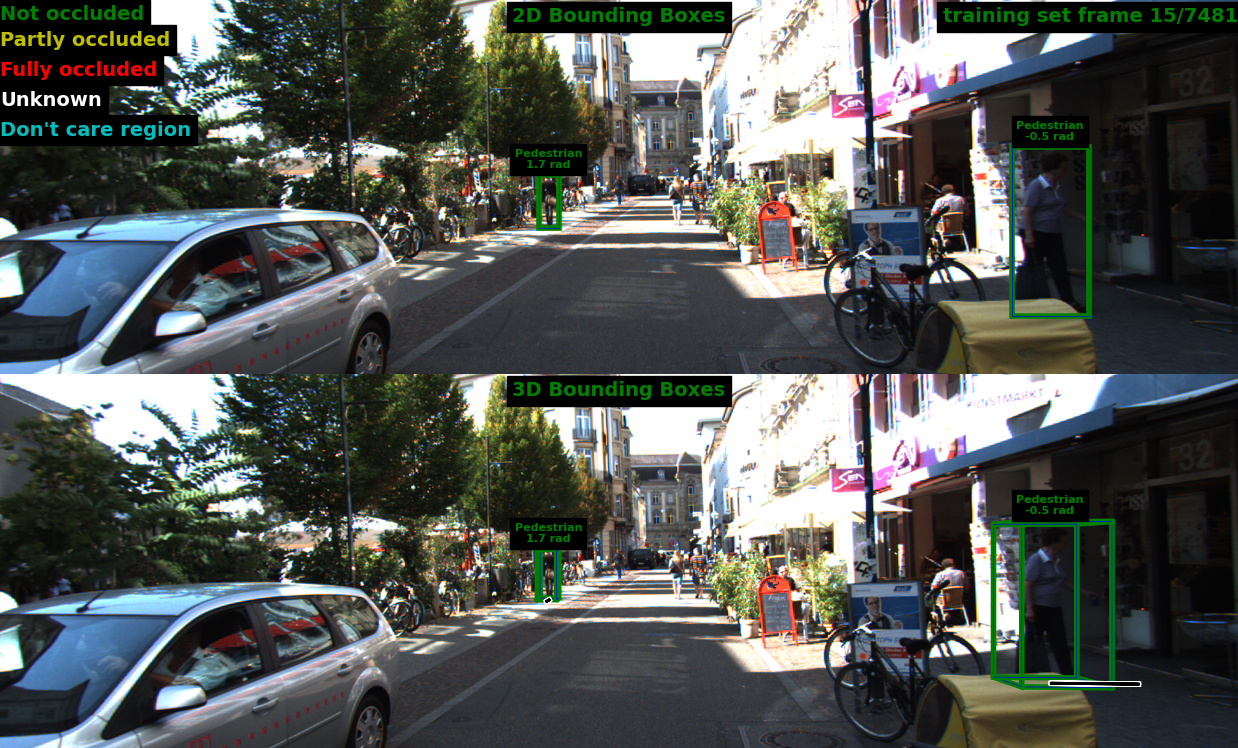
This code helps visualize KITTI 3D object detection results based on KITTI DevKit. Data could be downloaded from official website and organized as follows:
<kitti-dataset-root>
|--training
  |--calib
    |--000000.txt
    |--000001.txt
    |--...
  |--image_2
    |--000000.png
    |--000001.png
    |--...
  |--label_2
    |--000000.txt
    |--000001.txt
    |--...
  |--pred_2
    |--000000.txt
    |--000001.txt
    |--...
|--testing
  |--calib
    |--000000.txt
    |--000001.txt
    |--...
  |--image_2
    |--000000.png
    |--000001.png
    |--...
Place predictions in /pred_2 folder to see results.
Dependencies
python == 3.8.10
matplotlib==3.5.2
numpy==1.23.0
pandas==1.4.3
Pillow==9.2.0
tqdm==4.64.0
Clone this repository
git clone git@github.com:QQQQ00243/KITTI-3D-Object-Visualization.git
cd KITTI-3D-Object-Visualization
Run
python run_demo.py --root-dir <root-of-dataset> --dataset <train-or-test> --output-dir <directory-to-save-plots> --pred <see-predictions>By default, a folder named outputs will be created, where .png file with same index as its corresponding label file will be saved.
Below are the results for GUPNet (Geometry Uncertainty Projection Network for Monocular 3D Object Detection).


