Literally Interpreting esPalOMA parameters
mamba env create -f env.yamlIf you want to run the dashboard (python board.py), you also need to generate
the data files. This can be done simply with make:
makeThis runs the default all recipe, which in turn runs the following commands to
generate the JSON files read by the dashboard.
python query.py -d datasets/industry.json -o data/industry
python query.py -d datasets/industry.json -o data/industry -f
python msm.py -d datasets/filtered-opt.json -o data/msm
Then you can run the histogram dashboard with this command:
python board.pyThis yields plots like that shown below, where you can click on bars in the histogram to display the corresponding molecules at the right.
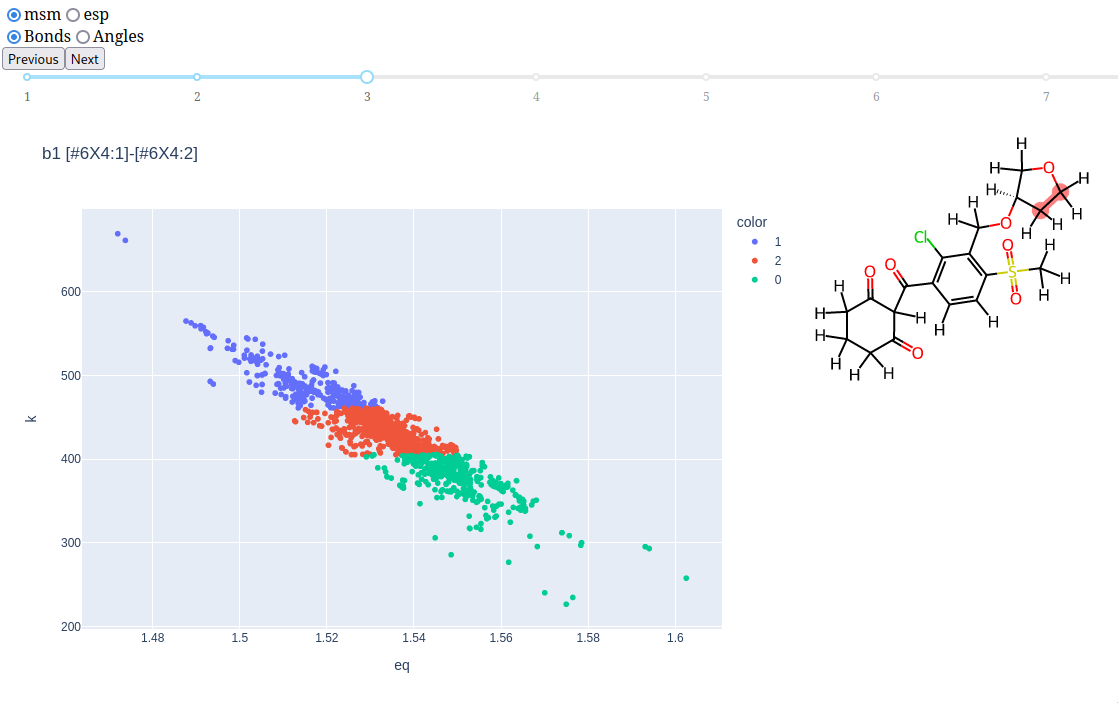
There is also a dashboard with 2D plots of equilibrium values and force constants together. Run this one with
python twod.pyThis produces a dashboard like the one shown below, where the slider allows you to select the number of KMeans clusters depicted in the graph, and clicking on data points again displays the corresponding molecule.

