A minimalist Python package to draw decision boundaries in machine learning. Very limited, but it covers the common case of two-featured points with a binary label.
You need your data as two NumPy matrices: a collection of 2D points, and a collection of binary labels.
import numpy as np
x = np.random.rand(10, 2)               # (N, 2) matrix of values
y = np.random.randint(2, size=(10, 1))  # (N, 1) matrix of values, each either 0 or 1
Then you need a classification function that takes a matrix of 2D points, and returns a matrix of binary labels:
def my_classification_function(points):                        # takes a matrix of (N, 2)
return (x[:, 0] + x[:, 1] > 1).astype(int).reshape(-1, 1) # returns an (N, 1) matrix of binary labels (each either 0 or 1)Call the show method, passing your data, and the classification function as a lambda:
import decision_boundary
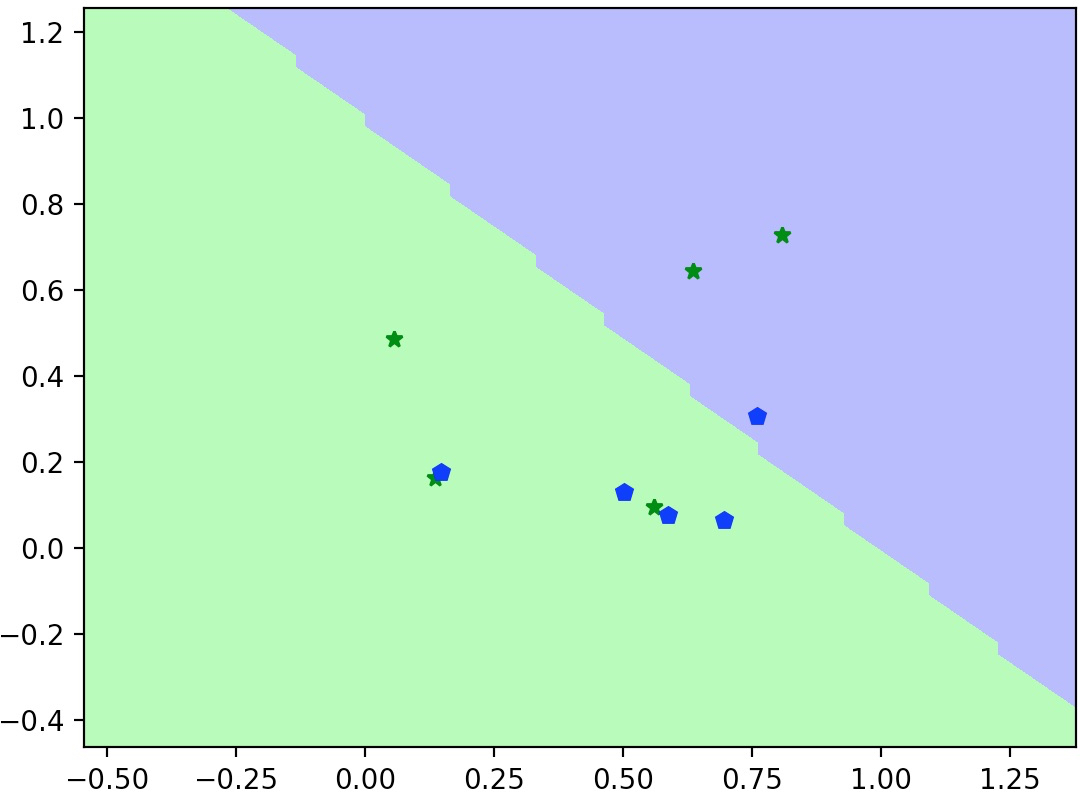
decision_boundary.show(data.X_all, data.Y_all, lambda points: my_classification_function(points))You'll get something like this:
You can specify the boundary's graphic resolution, and the chart's padding as a percent of the data range:
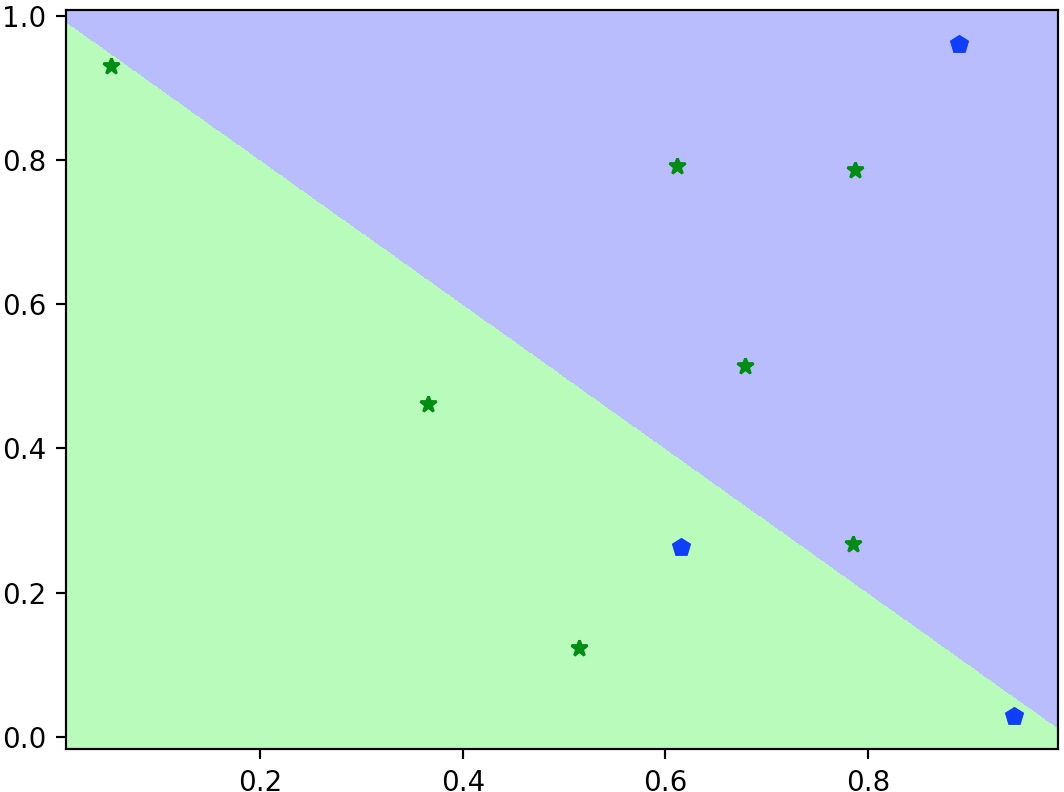
decision_boundary.show(data, labels, lambda points: my_classification_function(points), resolution=50, padding_percent=80)The line above results in a lower-resolution, zoomed out chart: