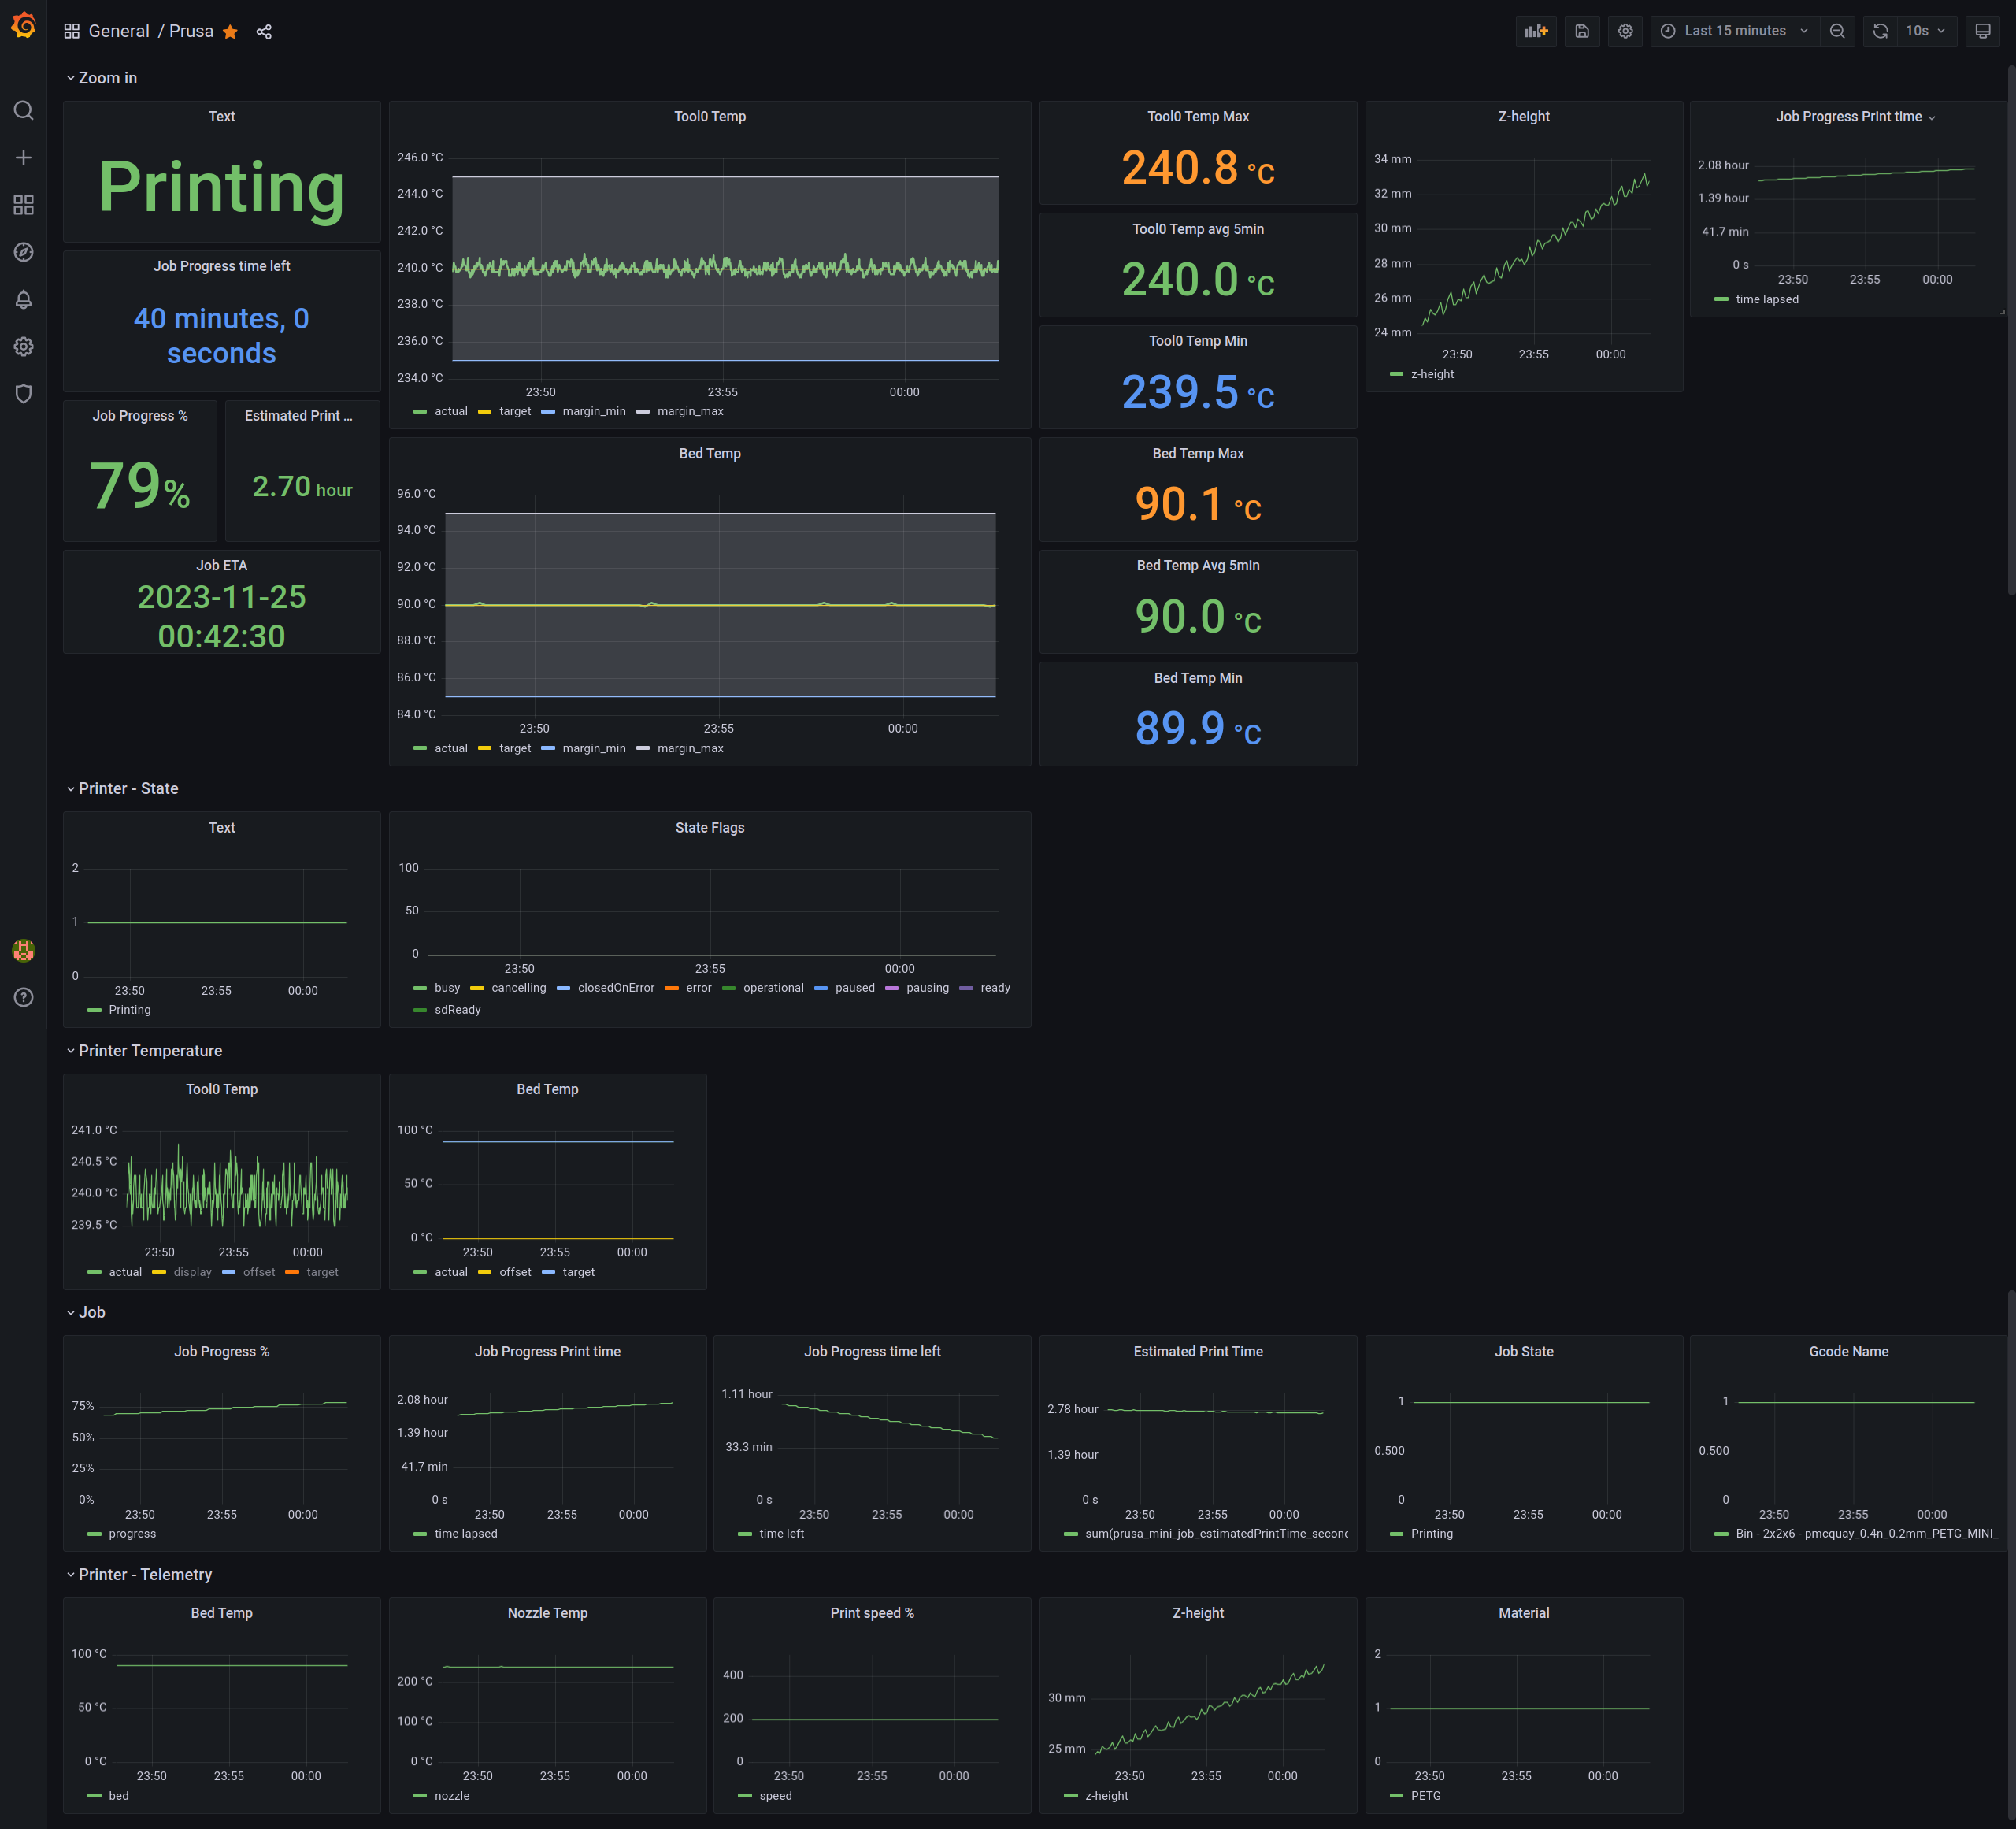
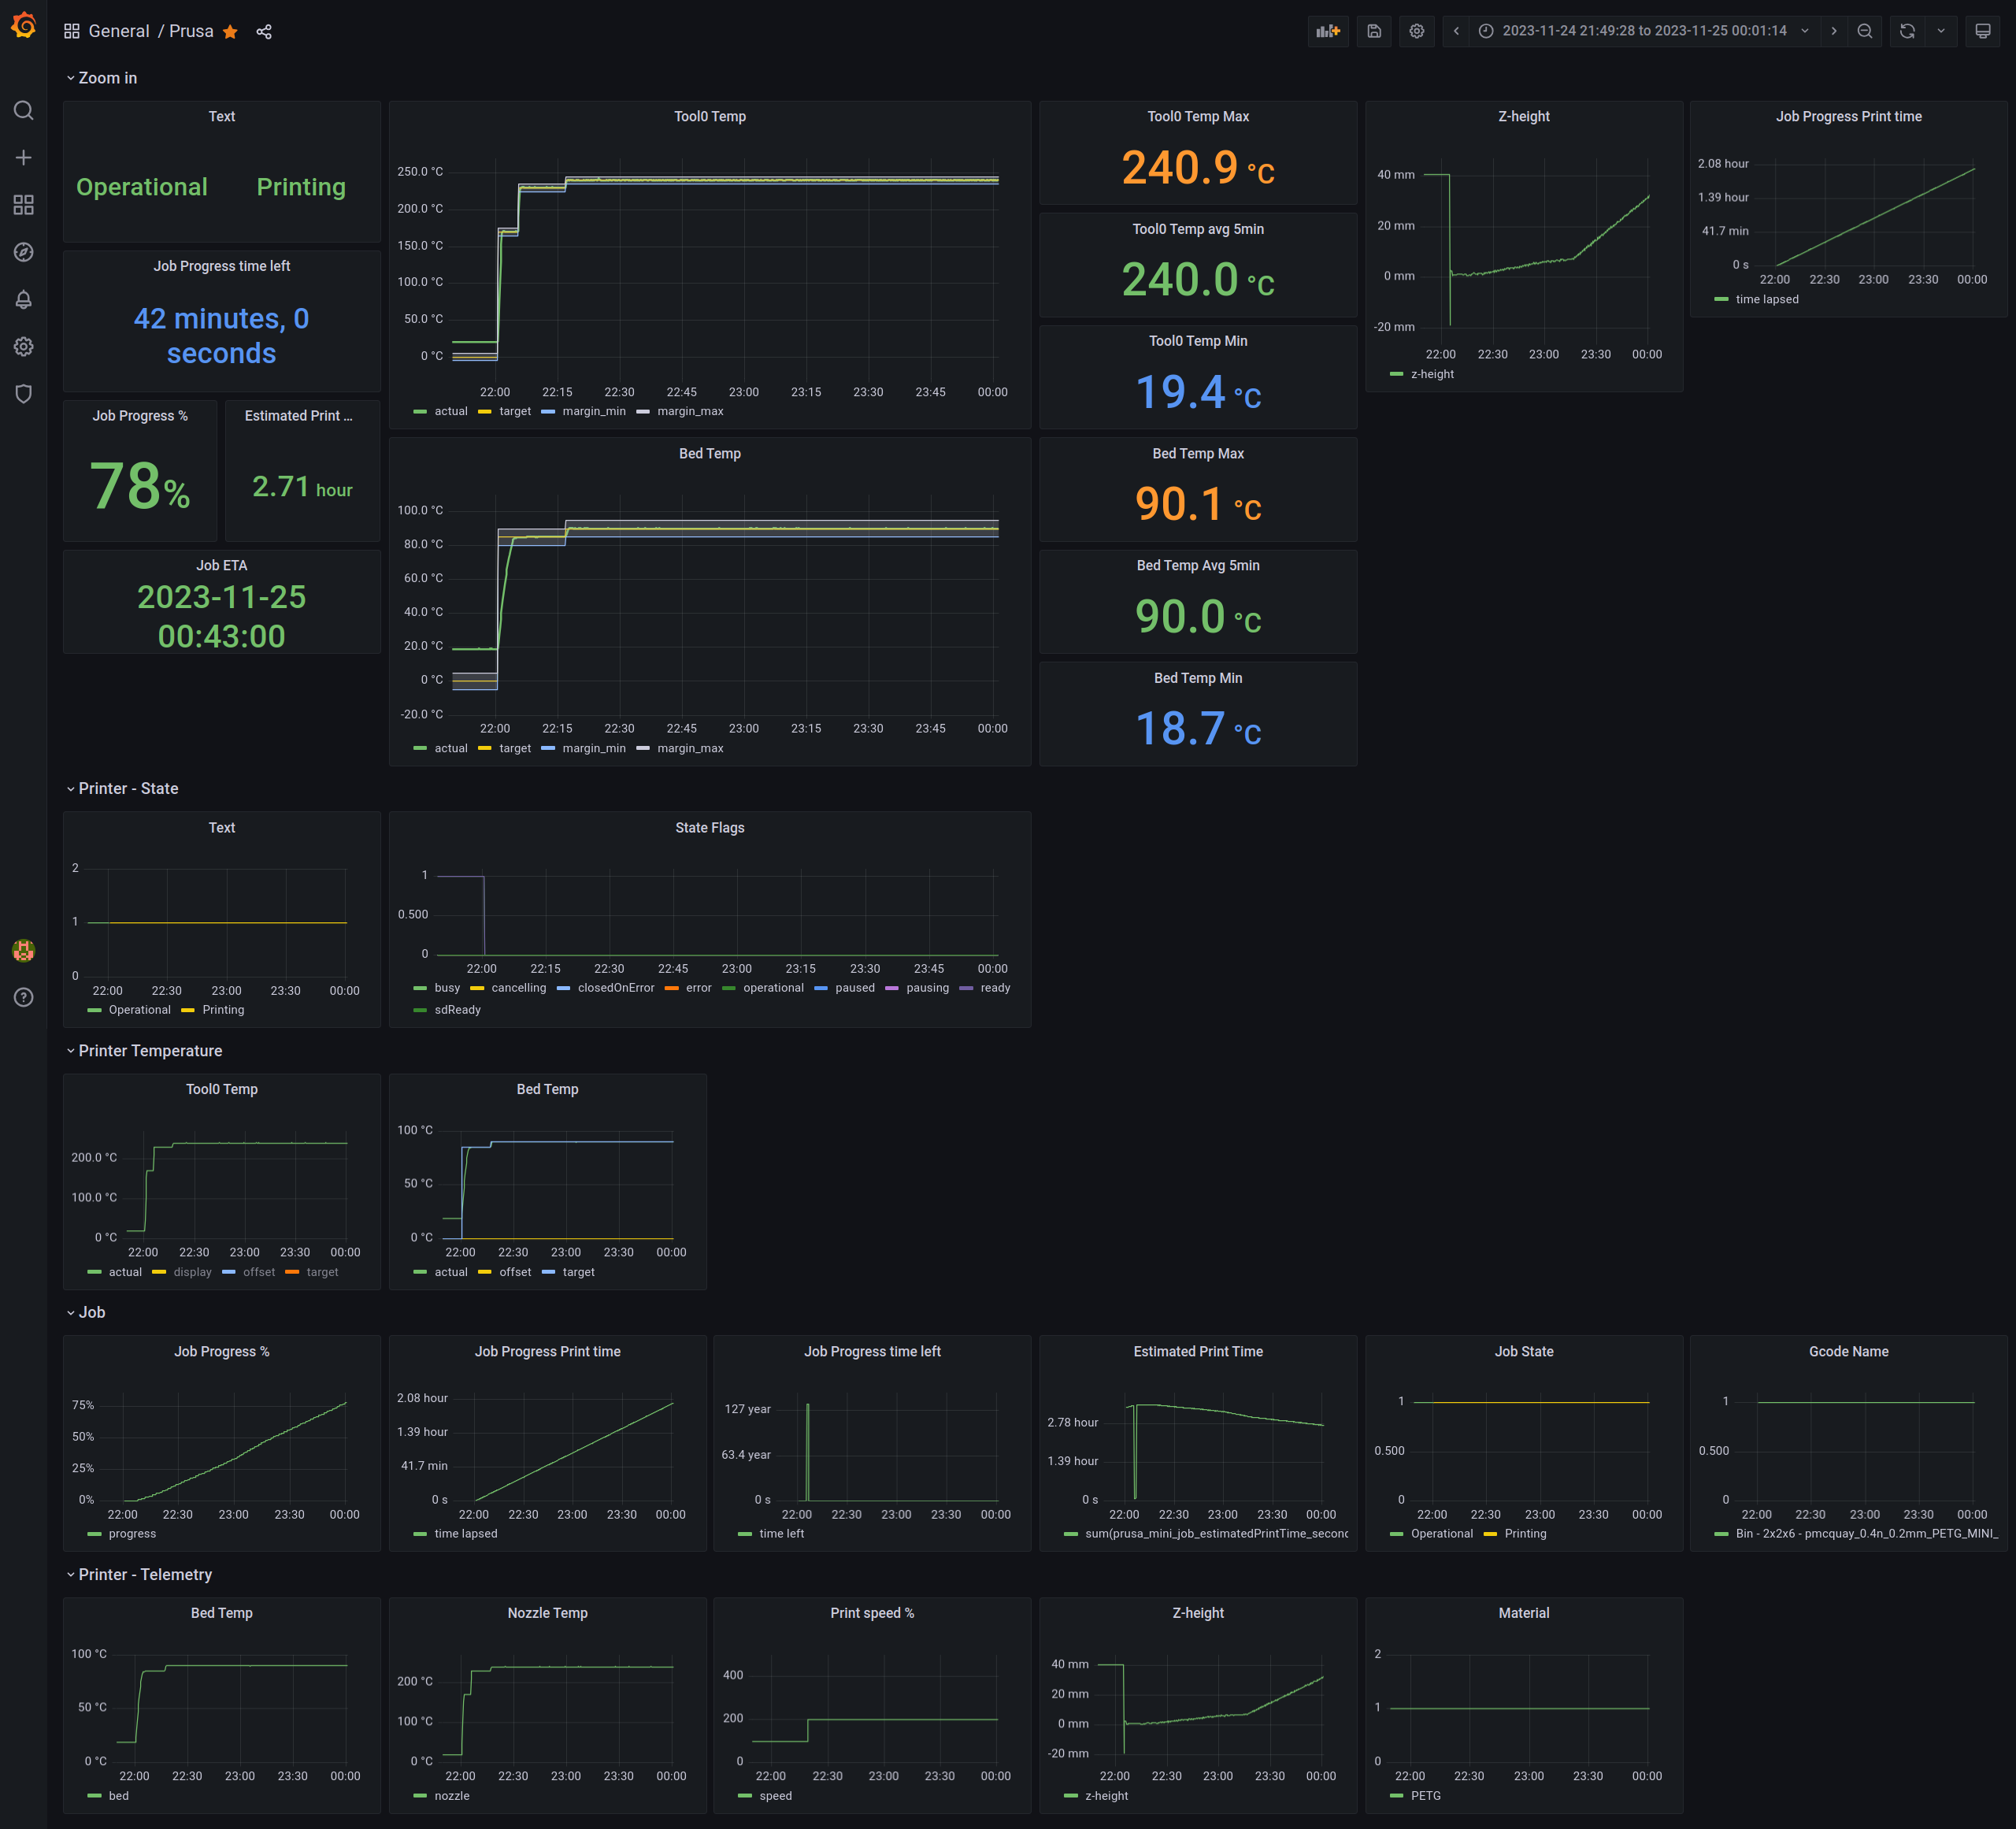
Configuration to use json-exporter for Prometheus to scrape metrics from Prusa3D Mini/
This was created as alternative to pstrobl96/prusa_exporter, because I tried to use it when it was supporting only newer firmware. So I decided to try json-exporter.
-
Works with Prusa Mini+ firmware 4.4.1 and 5.1.2 (and probably anything in between of those versions), but should be easy to adjust to other printers, if they expose certain data over API in JSON format.
-
for now it supports only one printer instance (especially in dashboard), because I have only one printer. Feel free to create PR.
-
prometheus scrapes printer status every second, doing it more frequently becomes problematic, and even this sometimes can lead to missing metrics
-
k8shelm values file to use, you need prometheus-operator to use ServiceMonitors. -
grafana,json-exporterandprometheusare used by docker-compose -
prusa_api- example json responses from the printer for easier writing code whithout the need of having working printer.
Below example assumes you use Prusa Mini with given firmware version.
-
go to the Prusa LCD display menu
-
Setting - Network - PrusaLink, write down Current API Key (
PRUSA_API_KEY) -
ensure device got IP address (
PRUSA_MINI_HOST_ADDRESS), write it down, will be needed later -
ensure that your 3D printer has static IP address in the network
-
in the configs in this repo:
- printer address is
PRUSA_MINI_HOST_ADDRESSor192.168.1.25 - printer API key is
PRUSA_API_KEYorhgyJKWXmhvEaPnK
- printer address is
-
if needed replace
PRUSA_MINI_HOST_ADDRESSin with your printer address, so if your printer address is192.168.0.20then:... targets: - name: prusa-mini-version url: http://PRUSA_MINI_HOST_ADDRESS:/api/version
becomes
...
targets:
- name: prusa-mini-version
  url: http://192.168.0.20:/api/version
-
as above replace
PRUSA_API_KEYwith your printer key, such as if your api key isDeaDBeeFheaders: X-Api-Key: PRUSA_API_KEY
becomes
      headers:
        X-Api-Key: DeaDBeeF
and so on, I hope you get the idea :D
- turn on the 3D printer
- ensure configs are updated (printer IP and API key)
- run
docker-compose upand go to Prometheus at 127.0.0.1:9009, and see if Status > Targets are green, otherwise there is a problem between prometheus and json-exporter or json-exporter and printer. - go to Grafana at 127.0.0.1:3000 and use user:
adminand passwordadminto log in, check existing dashboard if it shows anything. - copy dashboard, save as new, edit and save, export and add to directory path
under
grafana/dashboards/but then you may need to change dashboard it in json file (usually at the very end of the file) to avoid duplicates - Grafana should reload dashboards automatically every 10 seconds
In dashboard in templating list, add example section as in here
I know.

