Example of instrumenting a Go microservices application:
- Structured logging via zap
- Automatic endpoint monitoring exposing metrics to Prometheus
- Internal & distributed tracing via Jaeger
Deployments can be made via Docker and on Kubernetes. Additional instrumentation:
- Monitoring of demo app and internal Kubernetes components via Prometheus Operator
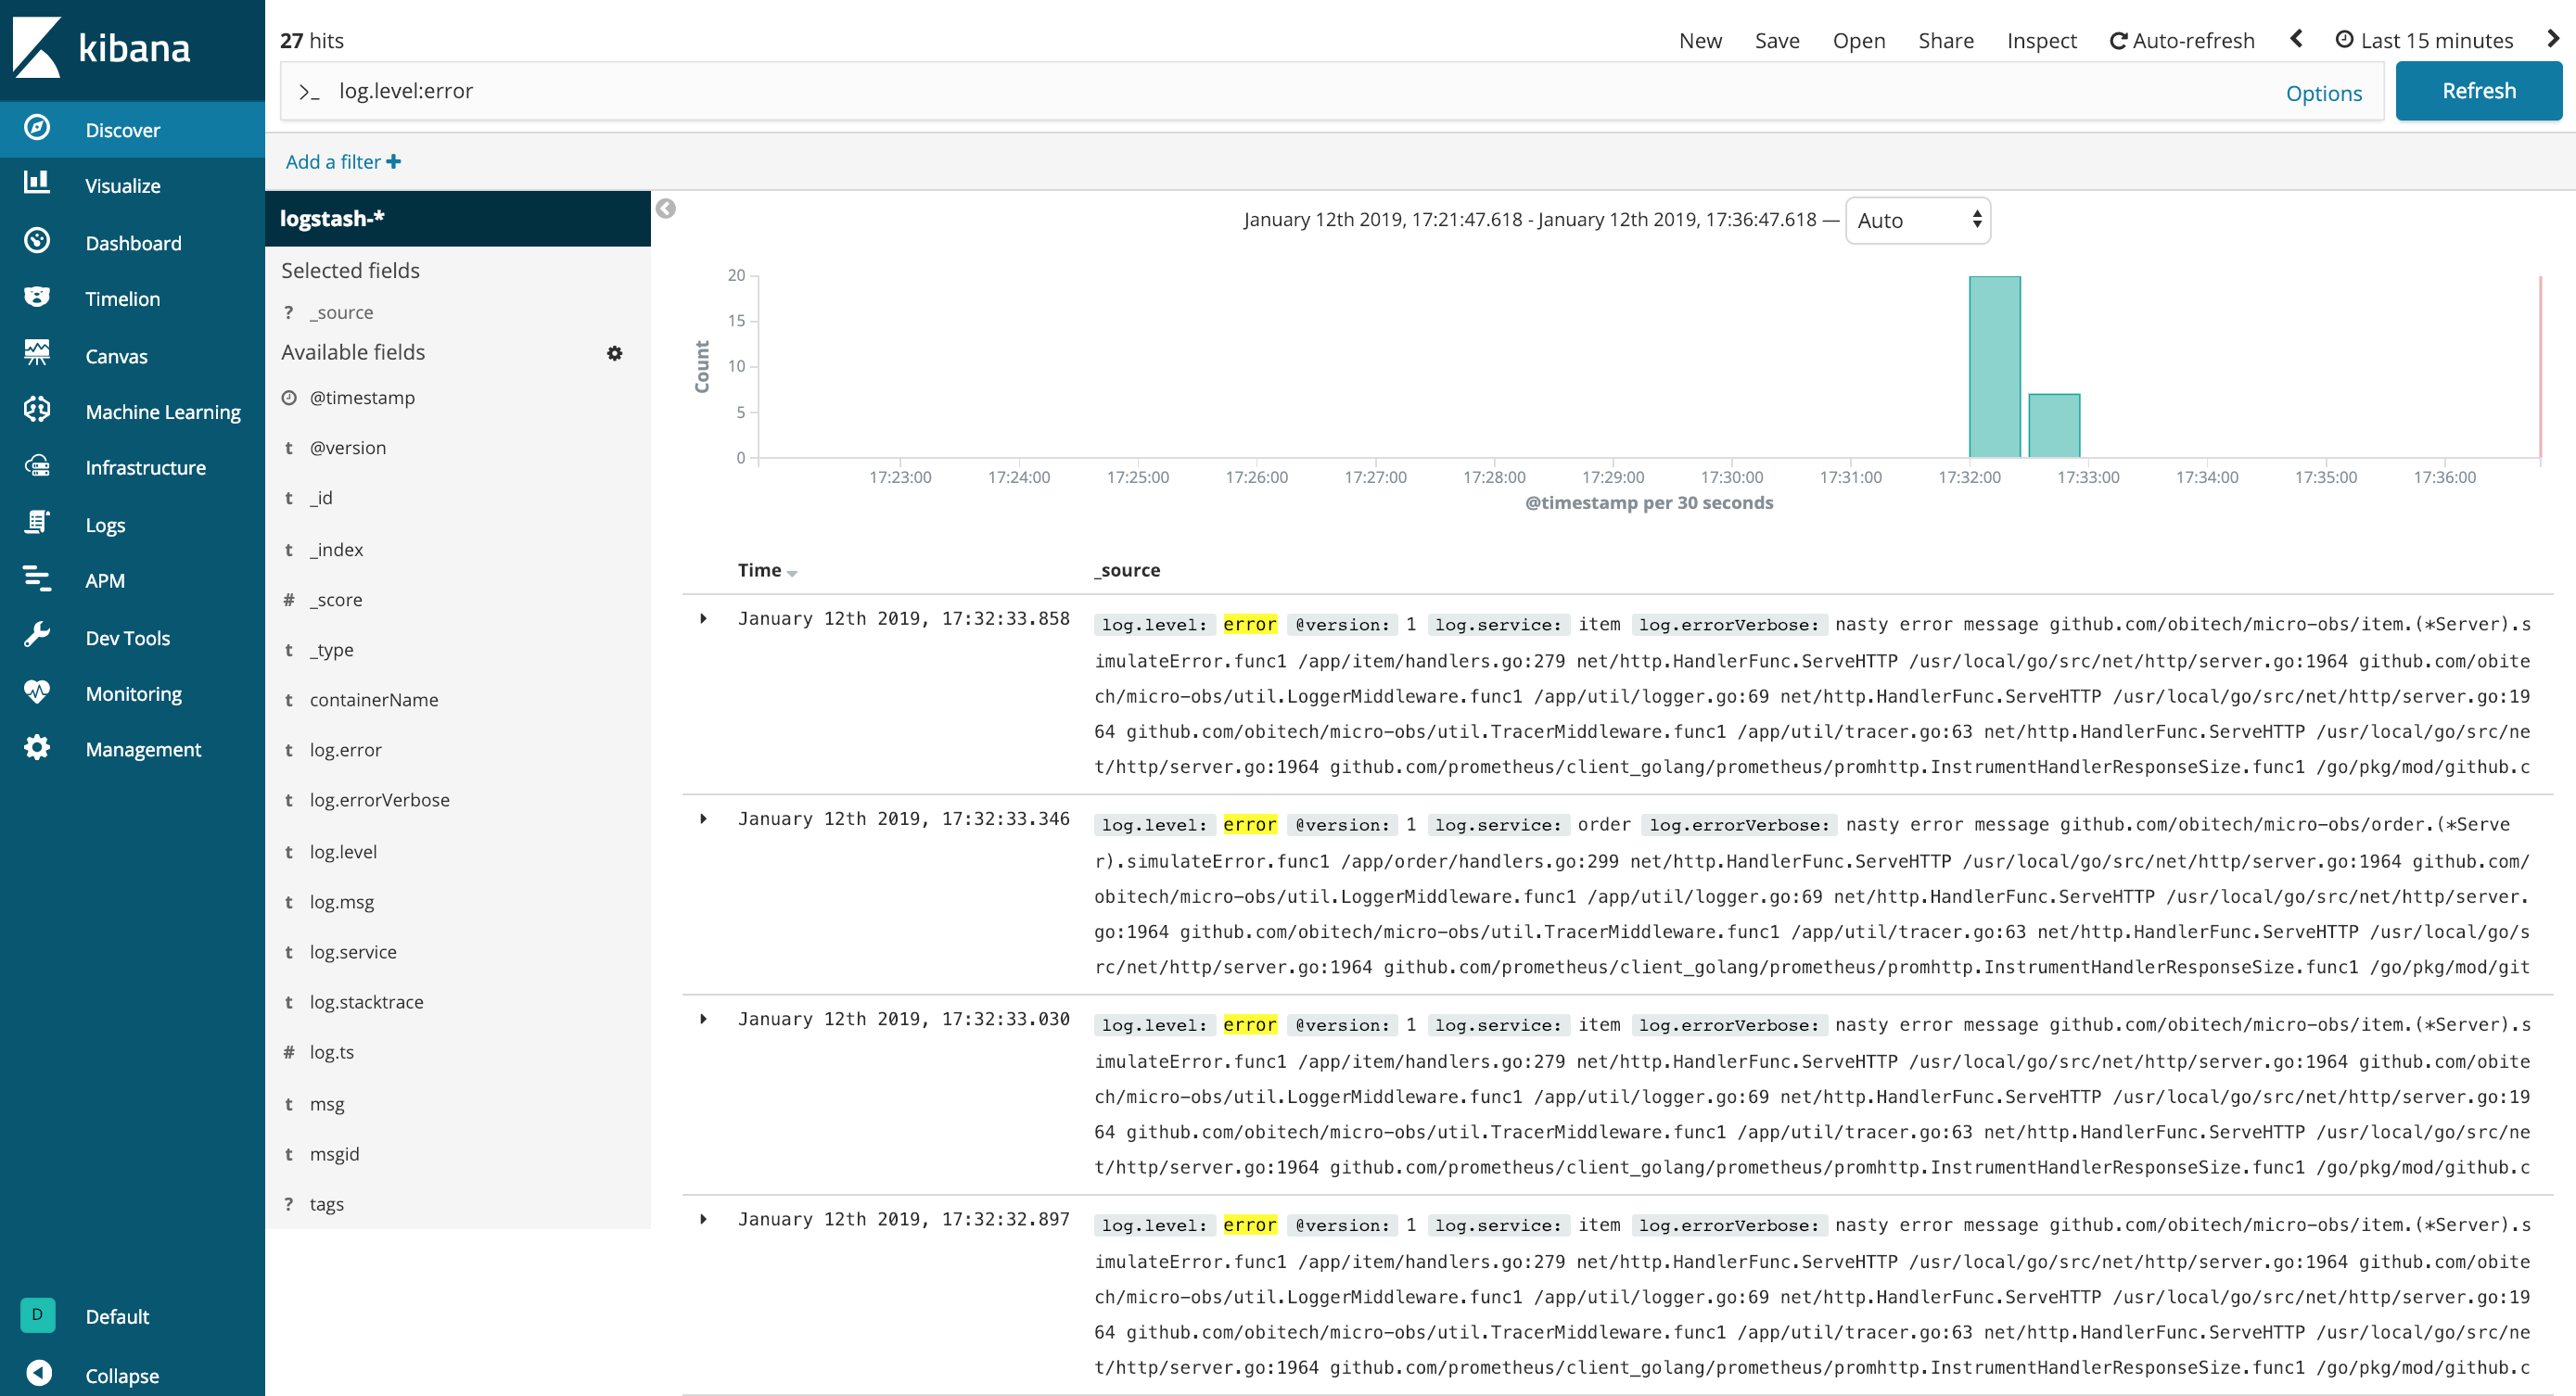
- Automatic container log aggregation via ELK Stack
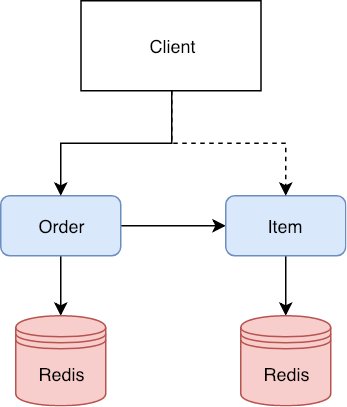
The example application consists of two services: item and order. Both service have a seperate redis instance as their primary data store. When an order gets placed, order contacts item to check if the wished items with the requested quantities are in stock:
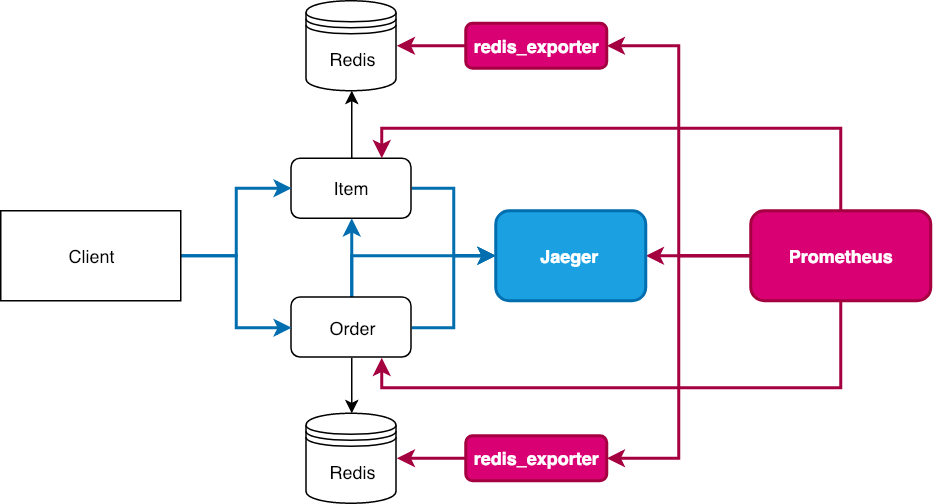
API endpoints of both services are instrumented via Prometheus and export the following metrics:
in_flight_requests: a gauge of requests currently being served by the wrapped handlerapi_requests_total: a counter for requests to the wrapped handlerrequest_duration_seconds: a histogram for request latenciesresponse_size_bytes: a histogram for response sizes
Additionally, all requests are traced via Jaeger:
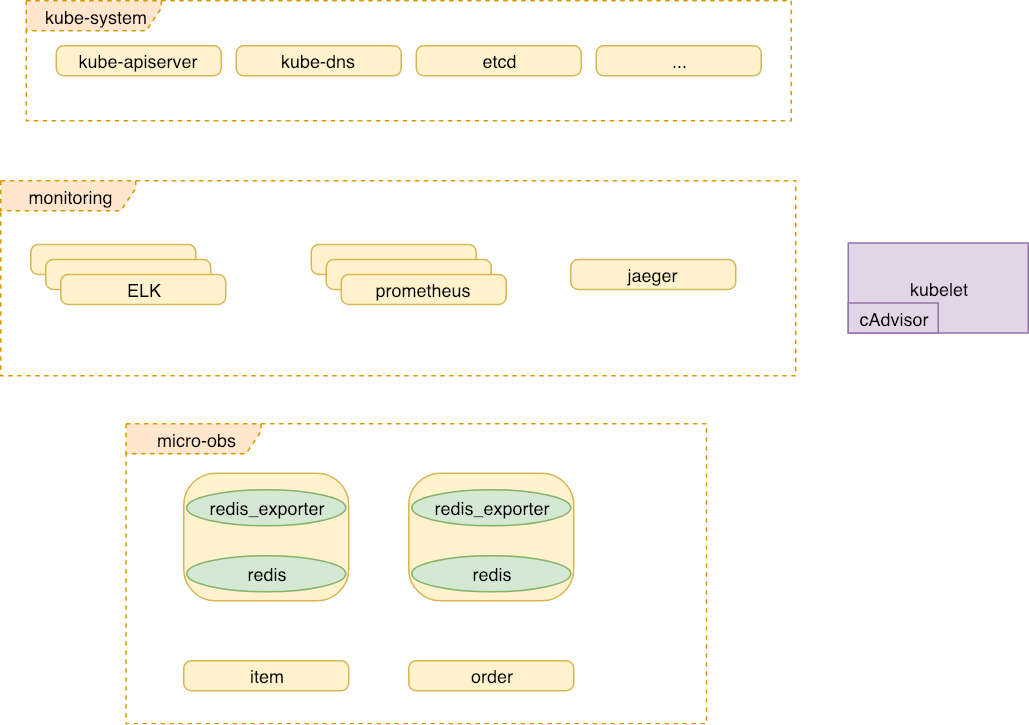
On Kubernetes, next to the application and node-specific metrics exposed via node_exporter, internal Kubernetes components are monitored as well:
kube-apiserverkube-dnsetcdkube-controller-managerkube-schedulerkubeletkube-state-metrics
Proemtheus is fully managed via the Prometheus Operator, allowing flexible deployment of new instances, rules, alertmanagers as well as convenient monitoring of Services via ServiceMonitors. A Mailhog instance is deployed to test the alerting pipeline.
For the ELK Stack, a Filebeat DaemonSet is watching all container logs on the nodes.
To build it from source you need Go 1.11+ installed.
This project uses Go Modules so you can clone the repo to anywhere:
git clone https://github.com/obitech/micro-obs.git
cd micro-obs/
Run make to test & build it:
make
# ...
Or make docker to build a Docker image:
make docker TAG=yourname/yourimage
# ...Make sure Docker and Docker Compose are installed.
Deploy the stack:
cd deploy/docker
docker-compose up -dMake sure Docker and Kubernets (via Minikube or microk8s, for example) are installed.
Deploy the monitoring stack first:
kubectl create -f deploy/k8s/000-monitoring --recursiveIt might take a while for the Prometheus Operator CRDs to be created. If the deployment fails, try running above command again.
Check if everything is up:
$ kubectl get pods -n monitoring
NAME                                   READY     STATUS    RESTARTS   AGE
alertmanager-main-0                    2/2       Running   0          1m
elasticsearch-f8dc4db44-l7ddn          2/2       Running   0          1m
filebeat-pnx76                         2/2       Running   0          1m
grafana-5bfbfb9665-nf9c9               1/1       Running   0          1m
jaeger-deployment-ff5c4dccc-tfxns      1/1       Running   0          1m
kibana-86c4b5577b-dxtpf                1/1       Running   0          1m
kube-state-metrics-58dcbb8579-hsw78    4/4       Running   0          1m
logstash-74479c885f-5lfcw              1/1       Running   0          1m
mailhog-778bd8484d-8vqfg               1/1       Running   0          1m
node-exporter-swtd6                    2/2       Running   0          1m
prometheus-core-0                      3/3       Running   0          1m
prometheus-operator-85bb8dc95b-wqpx6   1/1       Running   0          1m
Next deploy micro-obs stack:
kubectl create -f deploy/k8s/100-micro-obs/ --recursiveCheck if everything is up:
$ kubectl get pods -n micro-obs
NAME                           READY     STATUS    RESTARTS   AGE
item-54d9d7d554-2thtl          1/1       Running   0          1m
order-6549584969-k2cp8         1/1       Running   0          1m
redis-item-5bcf99c9f7-zdf2r    2/2       Running   0          1m
redis-order-68869c7986-4s7w2   2/2       Running   0          1m
First build the dummy CLI application:
make build-dummy| Service | Location |
|---|---|
| item API | http://localhost:8080/ |
| order API | http://localhost:8090/ |
| Jaeger Query | http://localhost:16686/ |
| Prometheus | http://localhost:9090/ |
| Grafana | http://localhost:3000/ |
Create some dummy data:
./bin/dummy data all
After creating dummy data, those transactions can be found in the Jaeger Query UI at http://localhost:16686:
Send some dummy requests:
./bin/dummy requests all / /aksdasd /items /orders /delay /error -n 100 -c 5
Start Grafana and upload the deploy/docker/dashboards/micro-obs.json dashboard:
After sending some requests, logs can be queried via Kibana running on http://localhost:5601:
| Service | Location | Internal FQDN |
|---|---|---|
| item API | http://localhost:30808 | http://item.micro-obs.service.cluster.local:8080 |
| item Redis | . | redis-item.micro-obs.service.cluster.local:3879 |
| order API | http://localhost:30809 | http://order.micro-obs.service.cluster.local:8090 |
| order Redis | . | http://redis-order.micro-obs.service.cluster.local:3879 |
| Jaeger Query | http://localhost:30686 | . |
| Prometheus | http://localhost:30900 | http://prometheus.monitoring.svc.cluster.local:9090 |
| Grafana | http://localhost:30300 | . |
| ElasticSearch | . | http://elasticsearch.monitoring.svc.cluster.local:9200 |
| Kibana | http://localhost:30601 | . |
| Mailhog | http://localhost:32025 | mailhog.svc.cluster.local:1025 |
Create some dummy data:
./bin/dummy data all -i http://localhost:30808 -o http://localhost:30809
After creating the dummy data, those transactions can be found in the Jaeger Query UI at http://localhost:30686:
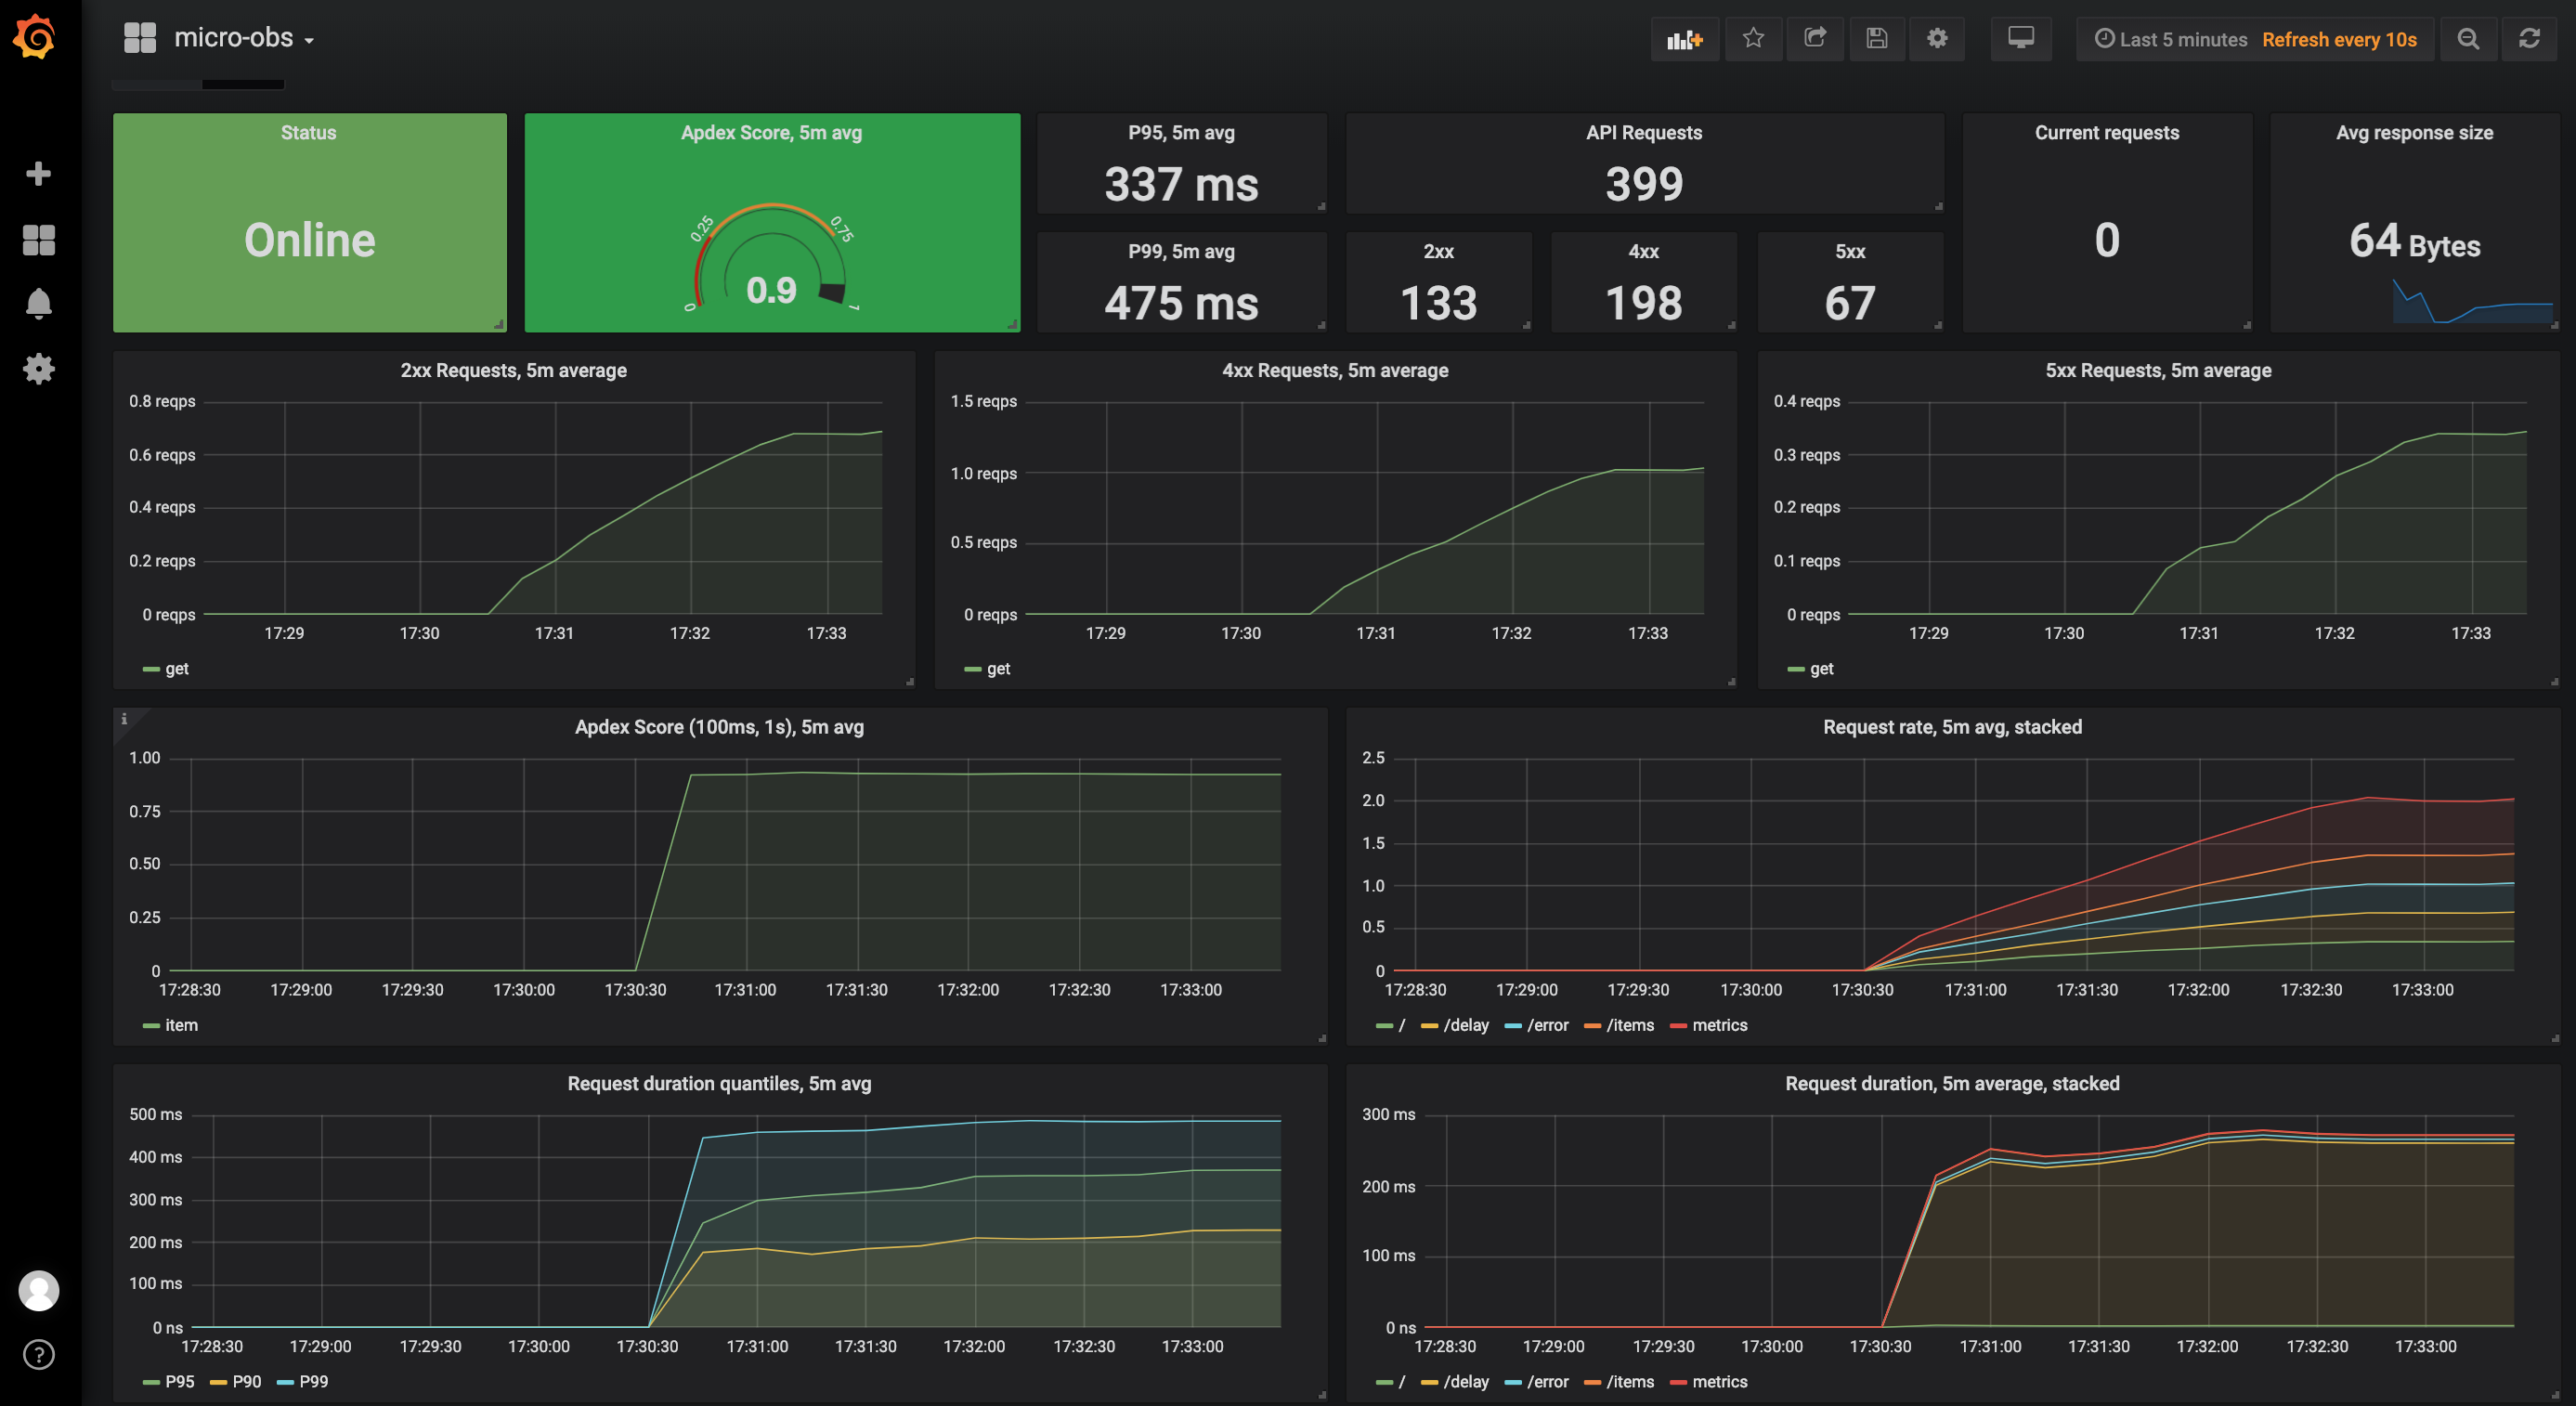
Both the Kubernetes' internal components as well as the micro-obs application (TODO) is being monitored by Prometheus. Some pre-installed Dashboards can be found in Grafana via http://localhost:30300 (default login is admin:admin):
TODO
| Method | Endpoint | Comment |
|---|---|---|
| GET | /healthz |
Returns OK as string |
| GET | /ping |
Returns a standard API response |
| GET | /items |
Returns all items |
| GET | /items/{id:[a-zA-Z0-9]+} |
Returns a single item by ID |
| DELETE | /items/{id:[a-zA-Z0-9]+} |
Deletes a single item by ID |
| POST | /items |
Sends a JSON body to create a new item. Will not update if item already exists |
| PUT | /items |
Sends a JSON body to create or update an item. Will update existing item |
Request:
POST http://localhost:8080/items
[
	{
		"name": "banana",
		"desc": "a yello fruit",
		"qty": 5
	},
	{
		"name": "water",
		"desc": "bottles of water",
		"qty": 10
	},
	{
		"name": "apple",
		"desc": "delicious",
		"qty": 15
	}
]
Response:
{
    "status": 201,
    "message": "items BxYs9DiGaIMXuakIxX, GWkUo1hE3u7vTxR, JAQU27CQrTkQCNr,  created",
    "count": 3,
    "data": [
        {
            "name": "banana",
            "id": "BxYs9DiGaIMXuakIxX",
            "desc": "a yello fruit",
            "qty": 5
        },
        {
            "name": "water",
            "id": "GWkUo1hE3u7vTxR",
            "desc": "bottles of water",
            "qty": 10
        },
        {
            "name": "apple",
            "id": "JAQU27CQrTkQCNr",
            "desc": "delicious",
            "qty": 15
        }
    ]
}| Method | Endpoint | Comment |
|---|---|---|
| GET | /healthz |
Returns OK as string |
| GET | /ping |
Returns a standard API response |
| GET | /orders |
Returns all orders |
| GET | /orders/{id:[0-9]+} |
Returns a single order by ID |
| DELETE | /orders/{id:[a-zA-Z0-9]+} |
Deletes a single order by ID |
| POST | /orders/create |
Creates a new order. Will query the item service first to check if passed items exist and are present in the wished quantity |
Request:
POST http://localhost:8090/orders/create
{
	"items": [
		{
			"id": "BxYs9DiGaIMXuakIxX",
			"qty": 2
		},
		{
			"id": "GWkUo1hE3u7vTxR",
			"qty": 8
		}
	]
}
Response:
{
    "status": 201,
    "message": "order 1 created",
    "count": 1,
    "data": [
        {
            "id": 1,
            "items": [
                {
                    "id": "BxYs9DiGaIMXuakIxX",
                    "qty": 2
                },
                {
                    "id": "GWkUo1hE3u7vTxR",
                    "qty": 8
                }
            ]
        }
    ]
}
