A lightweight & opening Java Agent for Cloud-Native and APM system
- EaseAgent
- EaseAgent is the underlying component that provides non-intrusive extensions to applications of the Java ecosystem.
- EaseAgent can collect distributed application tracing, metrics, and logs, which could be used in the APM system and improve the observability of a distributed system. for the tracing, EaseAgent follows the Google Dapper paper.
- EaseAgent also can work with Cloud-Native architecture. For example, it can help Service Mesh (especially for EaseMesh ) to do some control panel work.
- EaseAgent supports plugins mechanism development, which is easy to extend or add new functionality.
- EaseAgent can be a Java agent for APM(Application Performance Management) system.
- EaseAgent collects the basic metrics and the service tracing logs, which is very helpful for performance analysis and troubleshooting.
- EaseAgent is compatible with mainstream monitoring ecosystems, such as Kafka, ElasticSearch, Prometheus, Zipkin, etc.
- EaseAgent majorly focuses on the Spring Boot development environments, but users can support any Java ecosystem applications through plugins.
- EaseAgent can support scenario-specific business requirements through the plugin mechanism, such as traffic redirection, traffic coloring, etc.
- Safe to Java application/service.
- Instrumenting a Java application in a non-intrusive way.
- Lightweight and very low CPU, memory, and I/O resource usage.
- Highly extensible, users can easily do extensions through a simple and clear plugin interface.
- Design for Micro-Service architecture, collecting the data from a service perspective.
-
Easy to use. It is right out of the box for Metrics, Tracing and Logs collecting.
- Collecting Metric & Tracing Logs.
JDBC 4.0HTTP Servlet、HTTP FilterSpring Boot 2.2.x:WebClient、RestTemplate、FeignClientRabbitMQ Client 5.x、Kafka Client 2.4.xJedis 3.5.x、Lettuce 5.3.x (sync、async)ElasticSearch Client >= 7.x (sync、async)Mongodb Client >=4.0.x (sync、async)
- Collecting Access Logs.
HTTP Servlet、HTTP FilterSpring Cloud Gateway
- Instrumenting the
traceIdandspanIdinto user application logging automatically - Supplying the
health checkendpoint - Supplying the
readiness checkendpoint forSpringBoot2.2.x - Supplying the
agent infoendpoint
- Collecting Metric & Tracing Logs.
-
Data Reports
- Console Reporter.
- Prometheus Exports.
- Http Reporter.
- Kafka Reporter.
- Custom Reporter.
-
Easy to Extend
- Simple and clear Plugin Interface, creating a plugin as few as three classes.
- Extremely cleanly packaged
TracingandMetricAPI, with a small amount of code to achieve business support.
-
Standardization
- The tracing data format is fully compatible with the Zipkin data format.
- Metric data format fully supports integration with
Prometheus. - The application log format is fully compatible with the
Opentelemetrydata format.
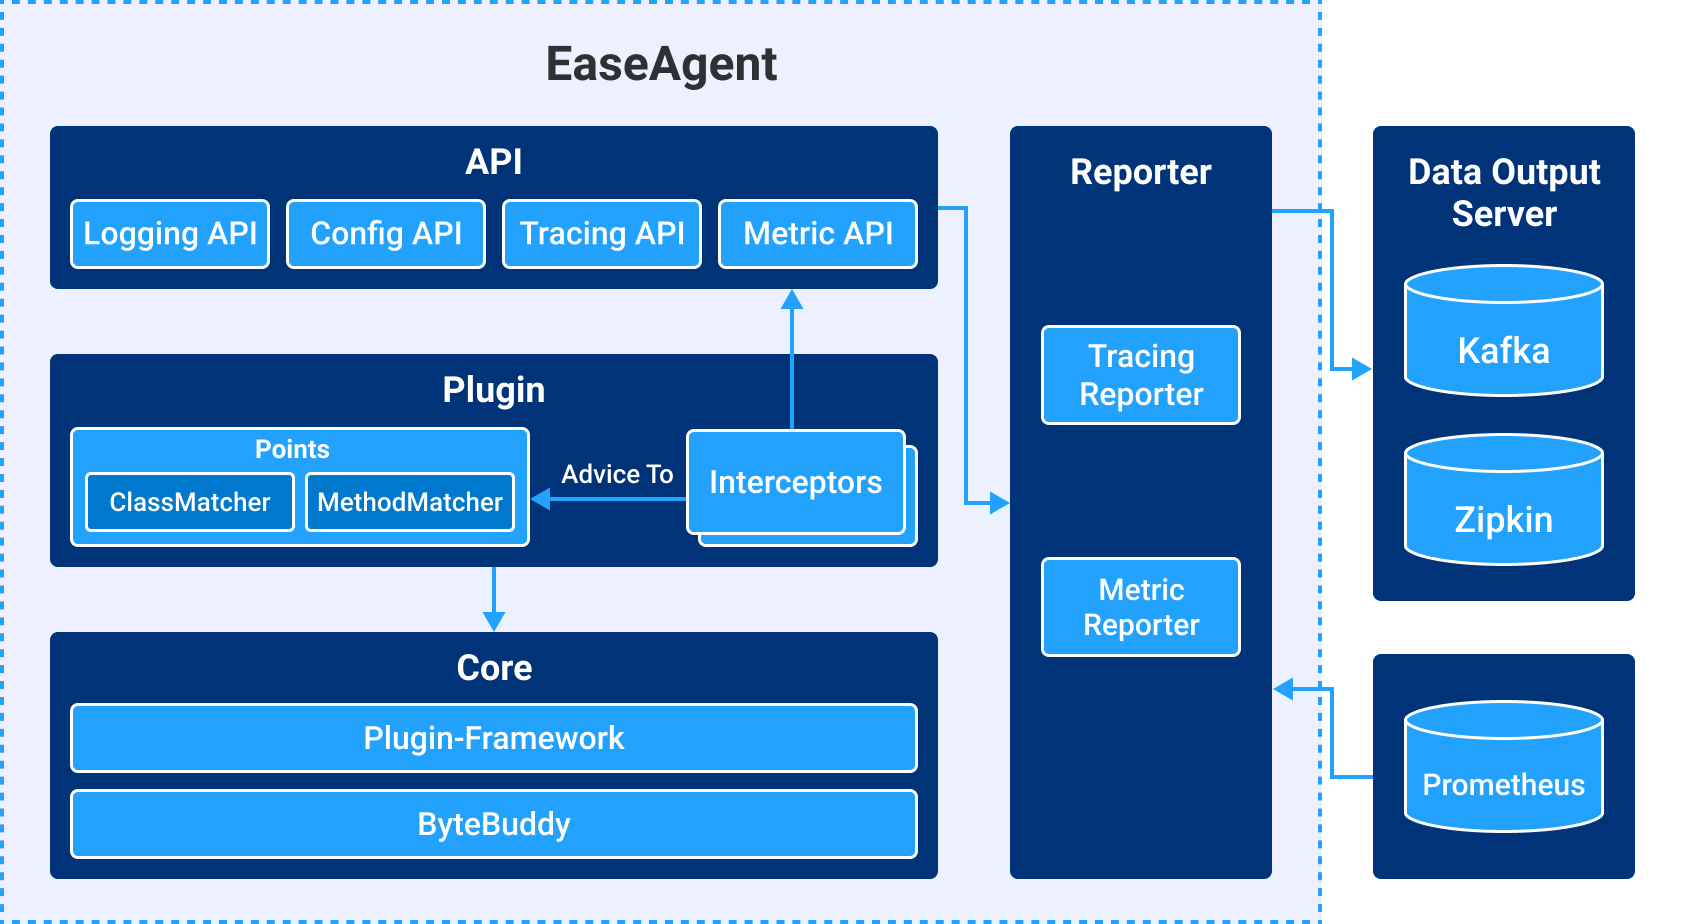
Plugin Framework in core module is base on Byte buddy technology.
- Easeagent's plugin defines where (which classes and methods) to make enhancements by implementing the
Pointsand what to do at the point of enhancement by implementing theInterceptor. - When the program invokes the enhanced method of class defined by Points, the
unique index(uid) owned by the method will be used as a parameter to call the common interface ofAgent Common Method Advice, which finds theAgent Interceptor Chainby theUnique Indexand calls thebeforemethod of each Interceptor in the chain in order of priority. - Normally, both the
Metric Interceptorand theTracing Interceptorare in the agent interceptor chain and are called sequentially. - According to call the
Metric APIandTracing APIin interceptors, theMetricandTracinginformation will be stored inMetricRegistryandTracing. - The
Reportermodule will get information fromMetricRegistryandTracingand send it toKafka. - The
aftermethod of each interceptor in theAgent Interceptor Chainwill be invoked in the reverse order of thebeforeinvoked at last. - The
tracingdata can be sent tokafkaserver orzipkinserver, themetricdata can be sent tokafkaserver and pull byPrometheusserver.
Setup Environment Variable and then download the latest release of easeagent.jar or build it from the source.
$ cd ~/easeagent #[Replace with agent path]
$ export EASE_AGENT_PATH=`pwd` # export EASE_AGENT_PATH=[Replace with agent path]
$ mkdir plugins
Download easeagent.jar from releases releases.
$ curl -Lk https://github.com/megaease/easeagent/releases/latest/download/easeagent.jar -O
You need Java 1.8+ and git:
Download EaseAgent with git clone https://github.com/megaease/easeagent.git.
$ cd easeagent
$ mvn clean package -Dmaven.test.skip
$ cp ./build/target/easeagent-dep.jar $EASE_AGENT_PATH/easeagent.jar
The ./build/target/easeagent-dep.jar is the agent jar with all the dependencies.
For the Windows platform, please make sure git
core.autocrlfis set to false before git clone. You can usegit config --global core.autocrlf falseto modifycore.autocrlf.
How to use easeagent.jar on host?
How to use easeagent.jar in docker?
Extracting the default configuration file.
$ cd $EASE_AGENT_PATH
$ jar xf easeagent.jar agent.properties easeagent-log4j2.xml
By default, there is an agent.properties configuration file, which is configured to print all output data to the console.
- Make sure you have installed the docker, docker-compose in your environment.
- Make sure your docker version is higher than v19.+.
- Make sure your docker-compose version is higher than v2.+.
$ git clone https://github.com/megaease/easeagent-spring-petclinic.git
$ cd easeagent-spring-petclinic
$ git submodule update --init
$ ./spring-petclinic.sh start
The script will download the latest release of EaseAgent. If you want to use your own built EaseAgent, copy it to the directory:
easeagent/downloaded
$ cp $EASE_AGENT_PATH/easeagent.jar easeagent/downloaded/easeagent-latest.jar
It requires Docker to pull images from the docker hub, be patient.
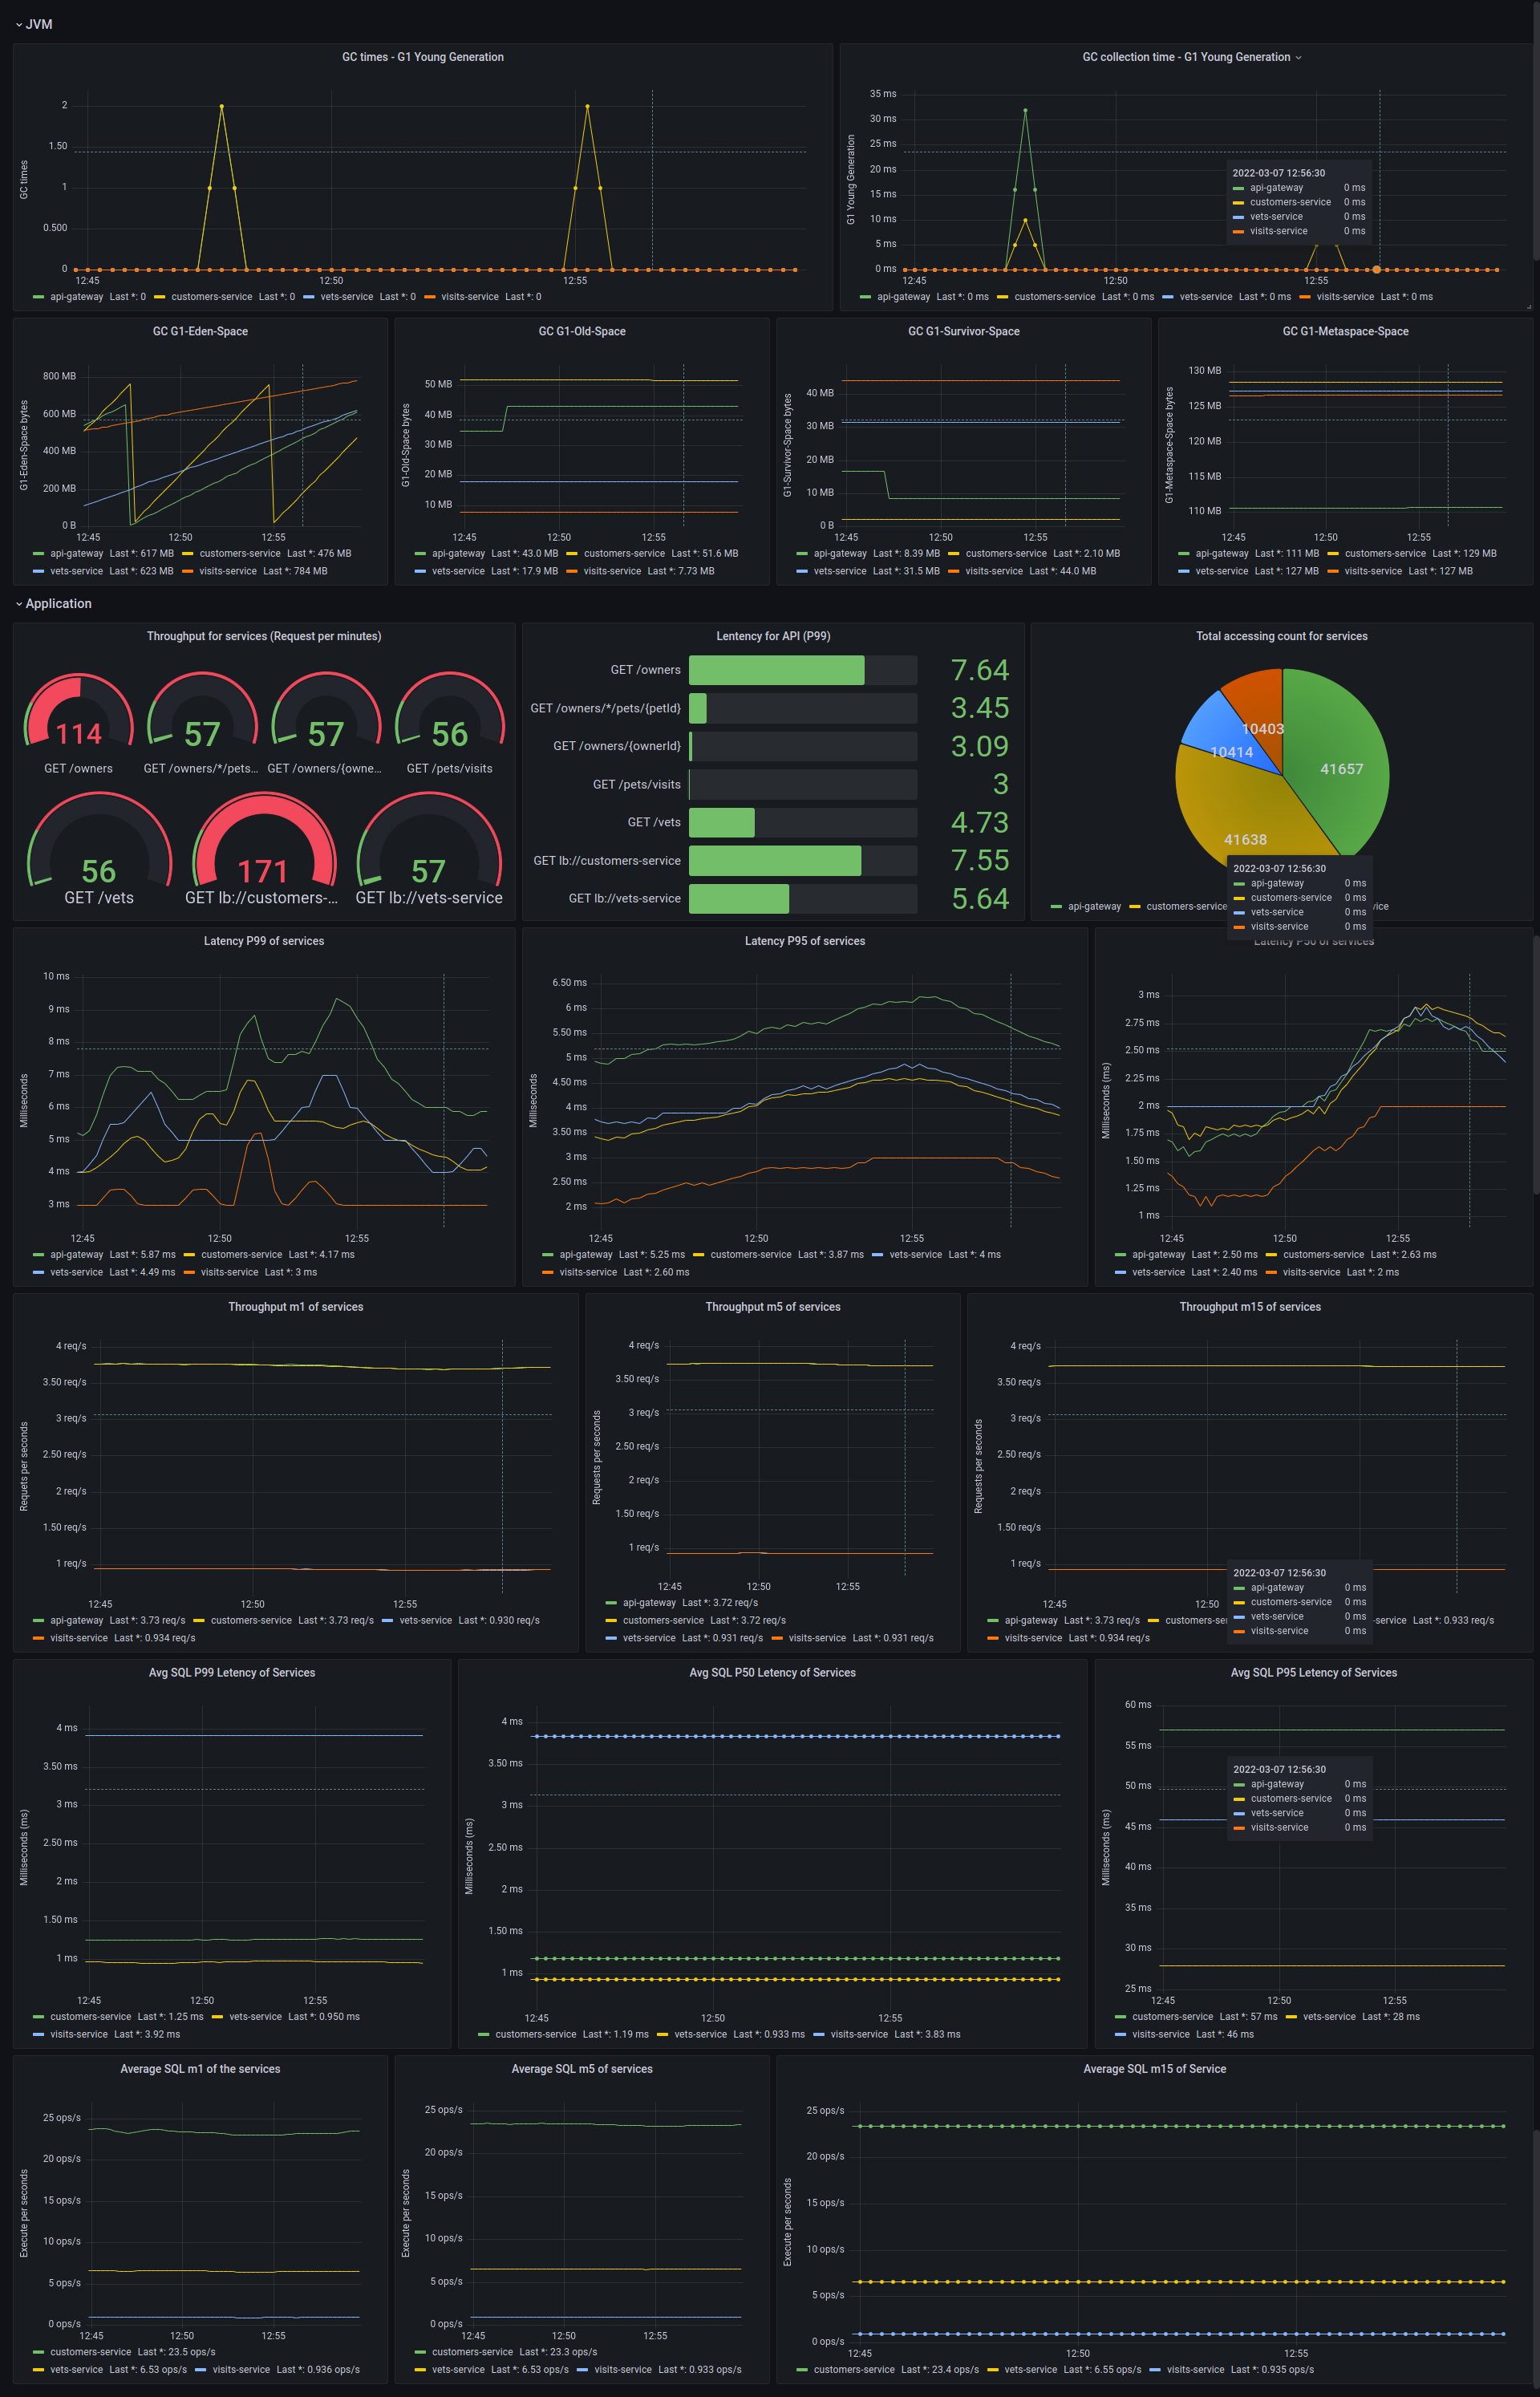
Open Browser to visit grafana UI: http://localhost:3000.
Click the search dashboards, the first icon in the left menu bar. Choose the spring-petclinic-easeagent to open the dashboard we prepare for you.
Prometheus Metric Schedule: Prometheus Metric
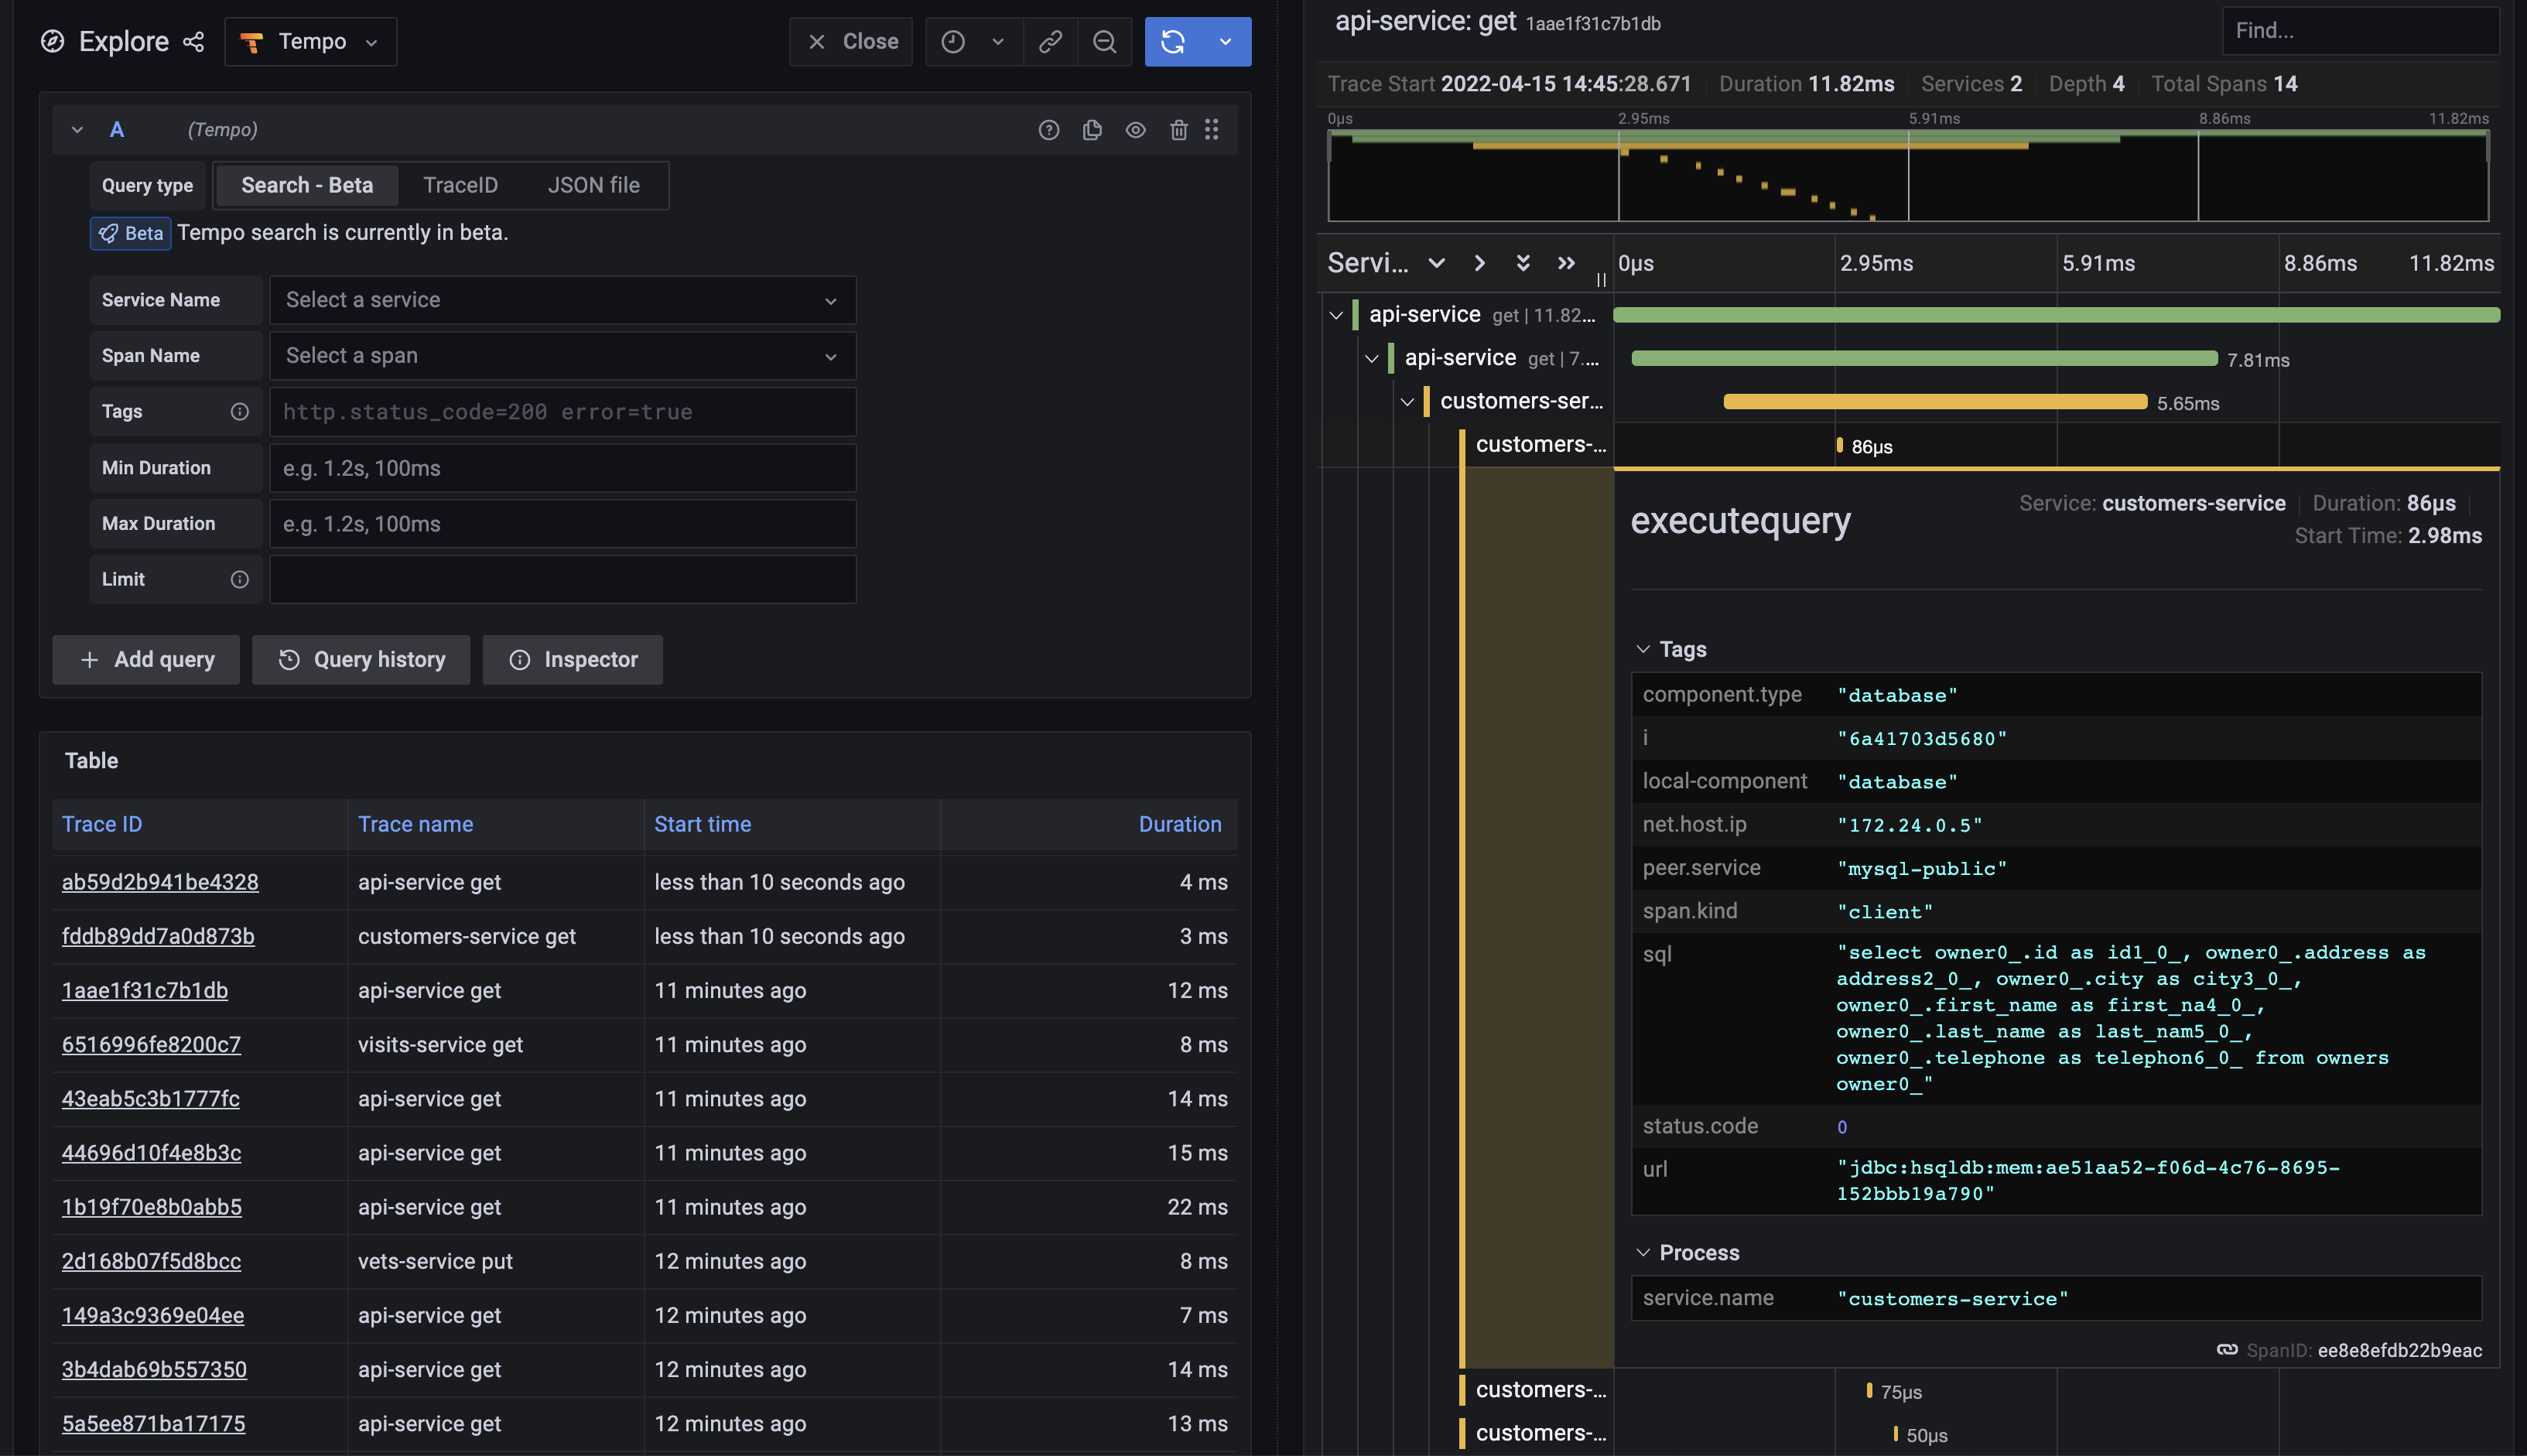
If you want to check the tracing-data, you could click the explore in the left menu bar. Click the Search - beta to switch search mode. Click search query button in the right up corner, there is a list containing many tracing. Choose one to click.
Add a Demo Plugin to EaseAgent
For more information, please refer to the User Manual.
Refer to Plugin Development Guide.
Report plugin enables user report tracing/metric data to different kinds of the backend in a different format.
Refer to Report Plugin Development Guide
- Github Issues
- Join Slack Workspace for requirement, issue and development.
- MegaEase on Twitter
If you have any questions, welcome to discuss them in our community. Welcome to join!
EaseAgent is licensed under the Apache License, Version 2.0. See LICENSE for the full license text.


