A repository demonstrates how to leverage the EaseAgent to monitor java applications.
With the EaseAgent, the metrics of spring-petclinic applications like throughput, latency, and tracing data could be collected by the Prometheus and tempo. The Grafana allows us to query, visualize, on and understand the metrics that we stored in tempo and Prometheus.
- Make sure you have installed the docker, docker-compose in your environment.
- Make sure your docker version is higher than v19.+.
- Make sure your docker-compose version is higher than v2.+.
We leverage the docker-compose to provision the full-stack service, services include:
- spring-petclinic services:
config-server,discovery-server,customers-service,vets-service,visits-service,api-gateway
temposervice is dedicated to collecting the tracing data of the spring-petclinic services.prometheusservice which is dedicated scrapes the metrics of the spring-petclinic services.grafanaservice is dedicated to visualizing the metrics and tracing data.loadsservice which is dedicated to producing loads to all spring-petclinic services.
As the spring-petclinic applications have integrated with the spring-cloud-sleuth. In order to avoiding interfering with the demonstration, we disable the spring sleuth via
spring.sleuth.enabled=falseandspring.sleuth.web.enabled=false.
After you clone the repository, you need to run git submodule update --init to update the submodule, which is the configuration of the spring-petclinic.
git submodule update --initAll images in the stacks are pulled from the docker official registry. You should make sure you can pull images from it. All images are official images. WE HAVE NOT CHANGE ANYTHING OF THEM.
Provisioning full-stack command is:
./spring-petclinic.sh startThe script will download the easeagent v2.1.0 release from the Github release page. You should make sure you can access the internet or Github. If you were hard to access the GitHub or internet, you could build easeagent from scratch and put the build target (easeagent-dep.jar) into the
easeagent/downloaded/directory, and rename the file name toeaseagent-v2.1.0.jar.
After you finished the test, use the following command to destroy the service.
./spring-petclinic.sh stop
Just follow the step-by-step instructions which will guide you to get a good visualization.
-
Step 1. In order to get good visualization, you could wait a moment (about five minutes) before Prometheus collects enough metric data. Open a browser (chrome, firefox or edge is good). Input the
localhost:3000in the address bar and press enter to open grafana UI. -
Step 2. Click the
search dashboards, the first icon in the left menu bar. Choose thespring-petclinic-easeagentto open the dashboard we prepare for you. -
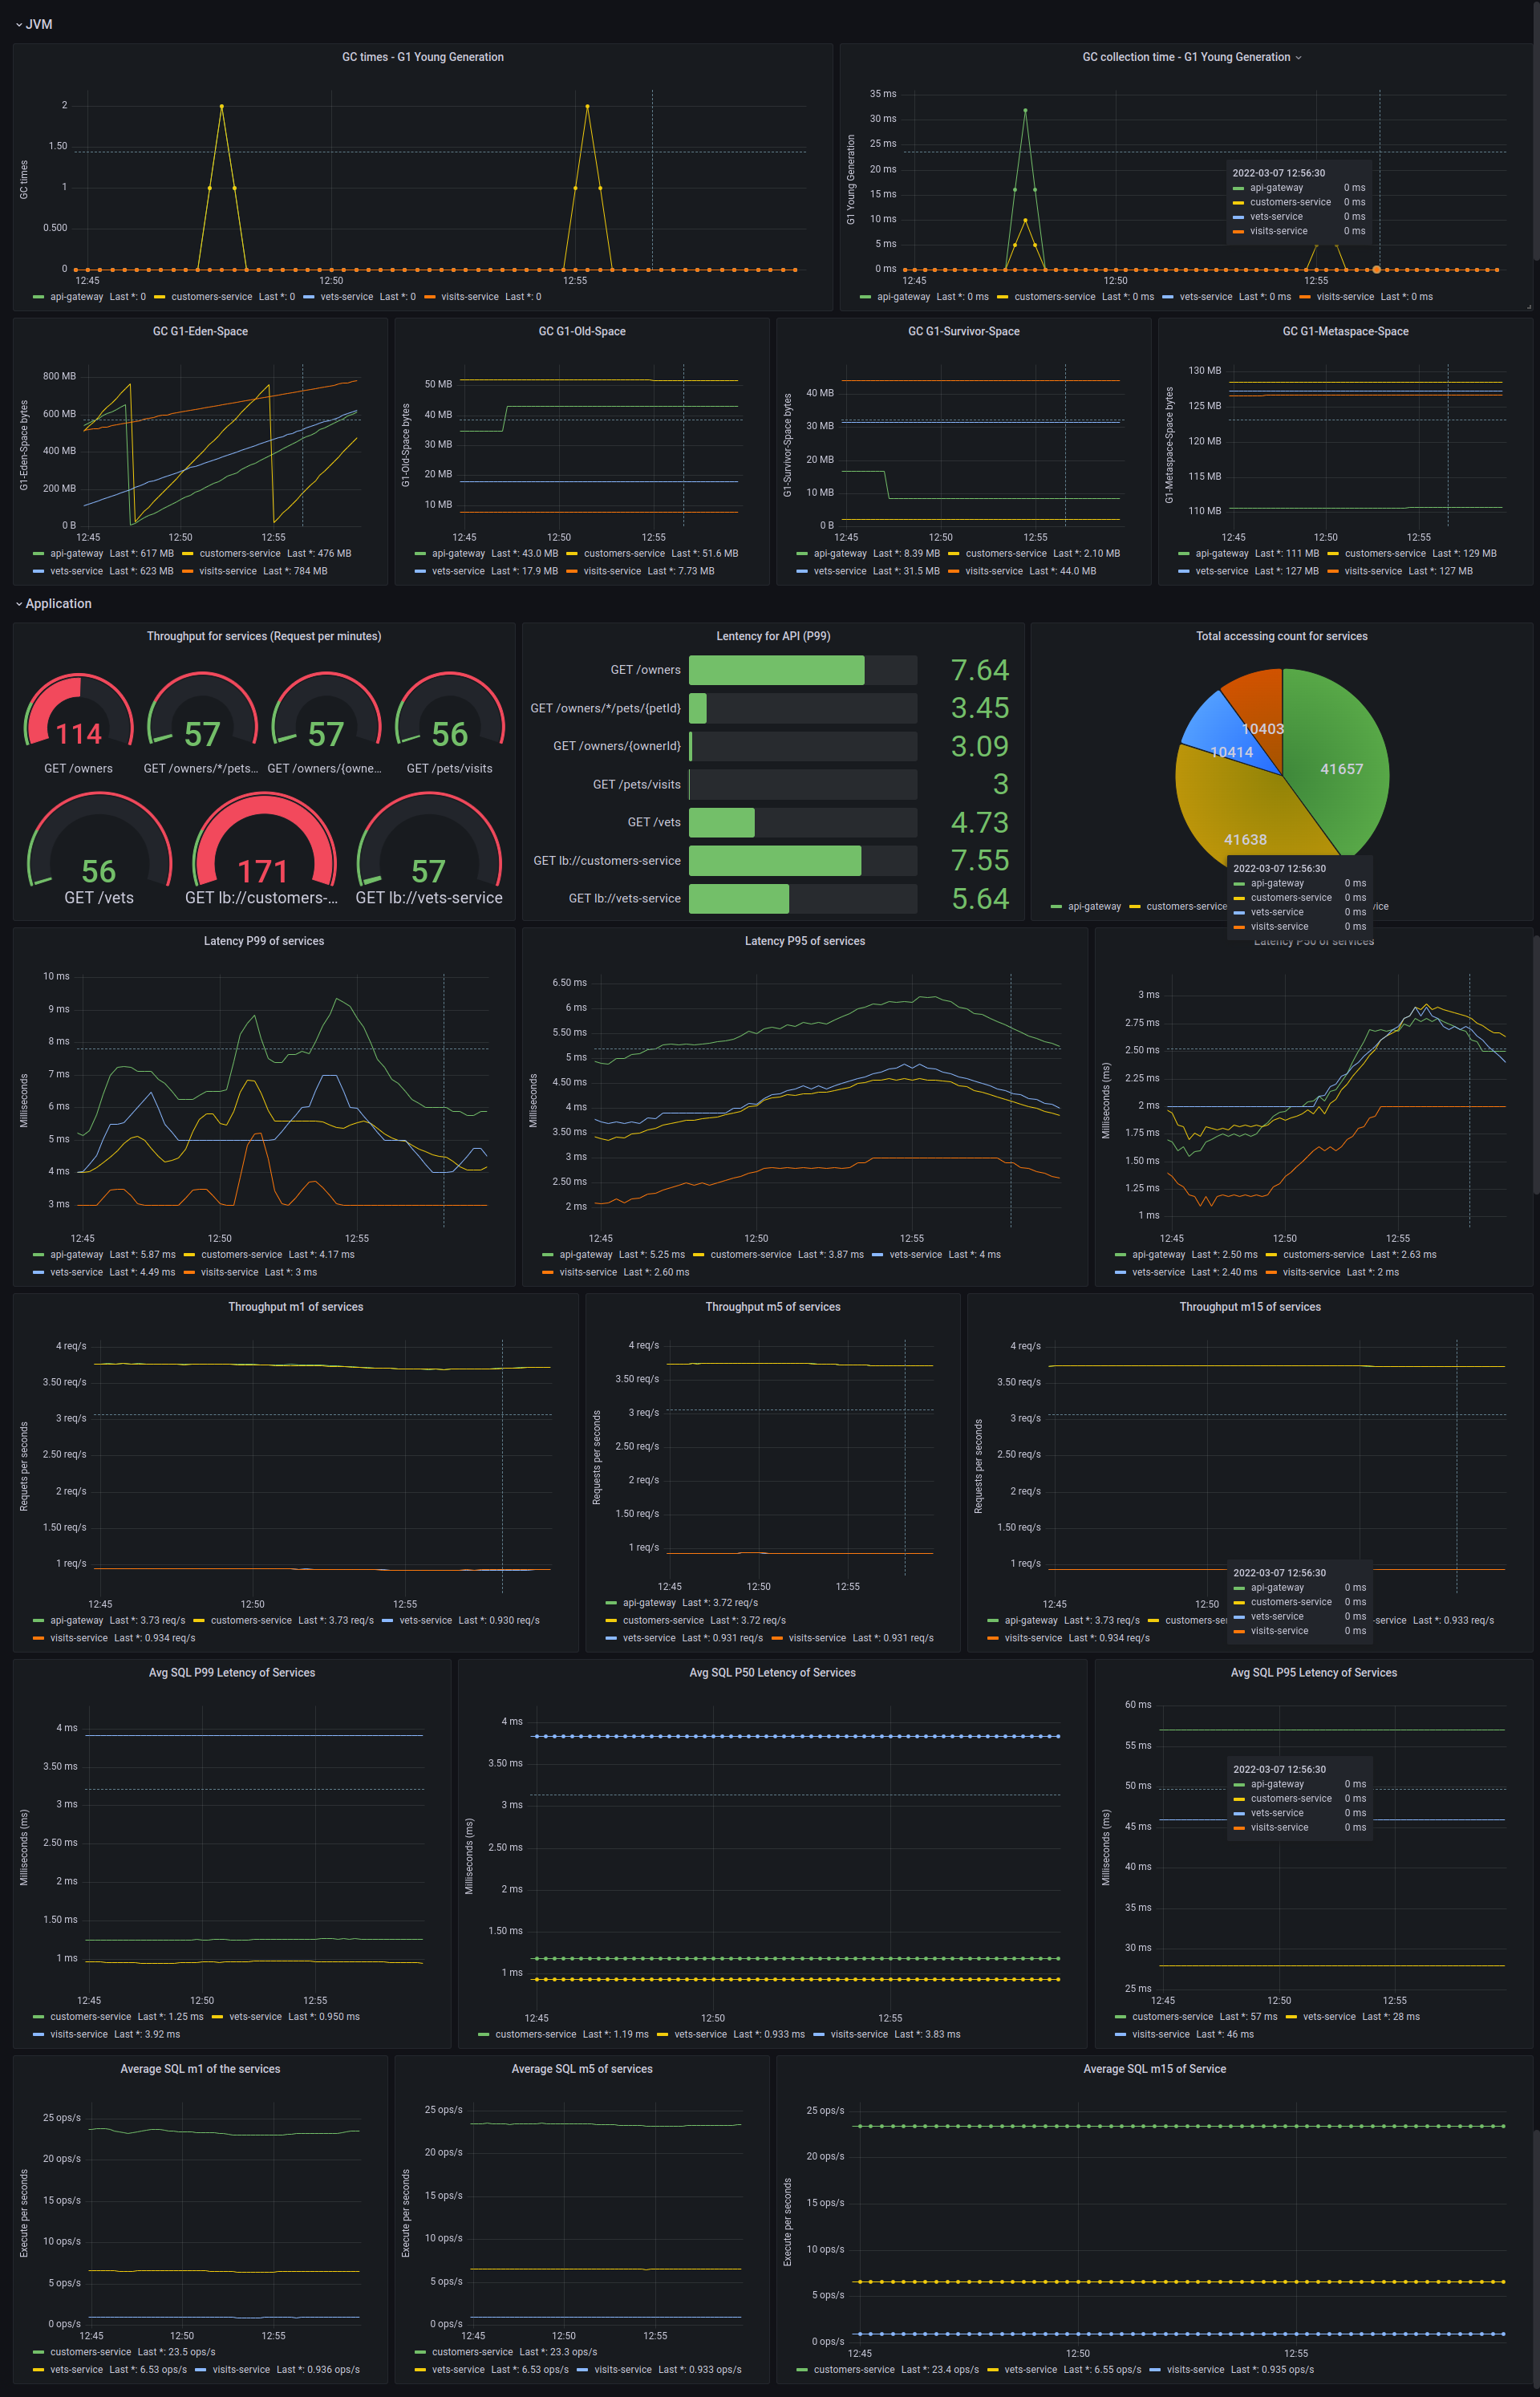
Step 3. You will get a visualization of metrics reported by the EaseAgent. In the dashboard, we classified into two groups. One is the JVM metrics which contain GC executing count, GC executing time, and used memory capacity (Eden, Olden, etc...). The second is the important metrics of the application, including throughput, latency, in different measures, for example, HTTP request throughput and latency, JDBC SQL throughput, and latency.
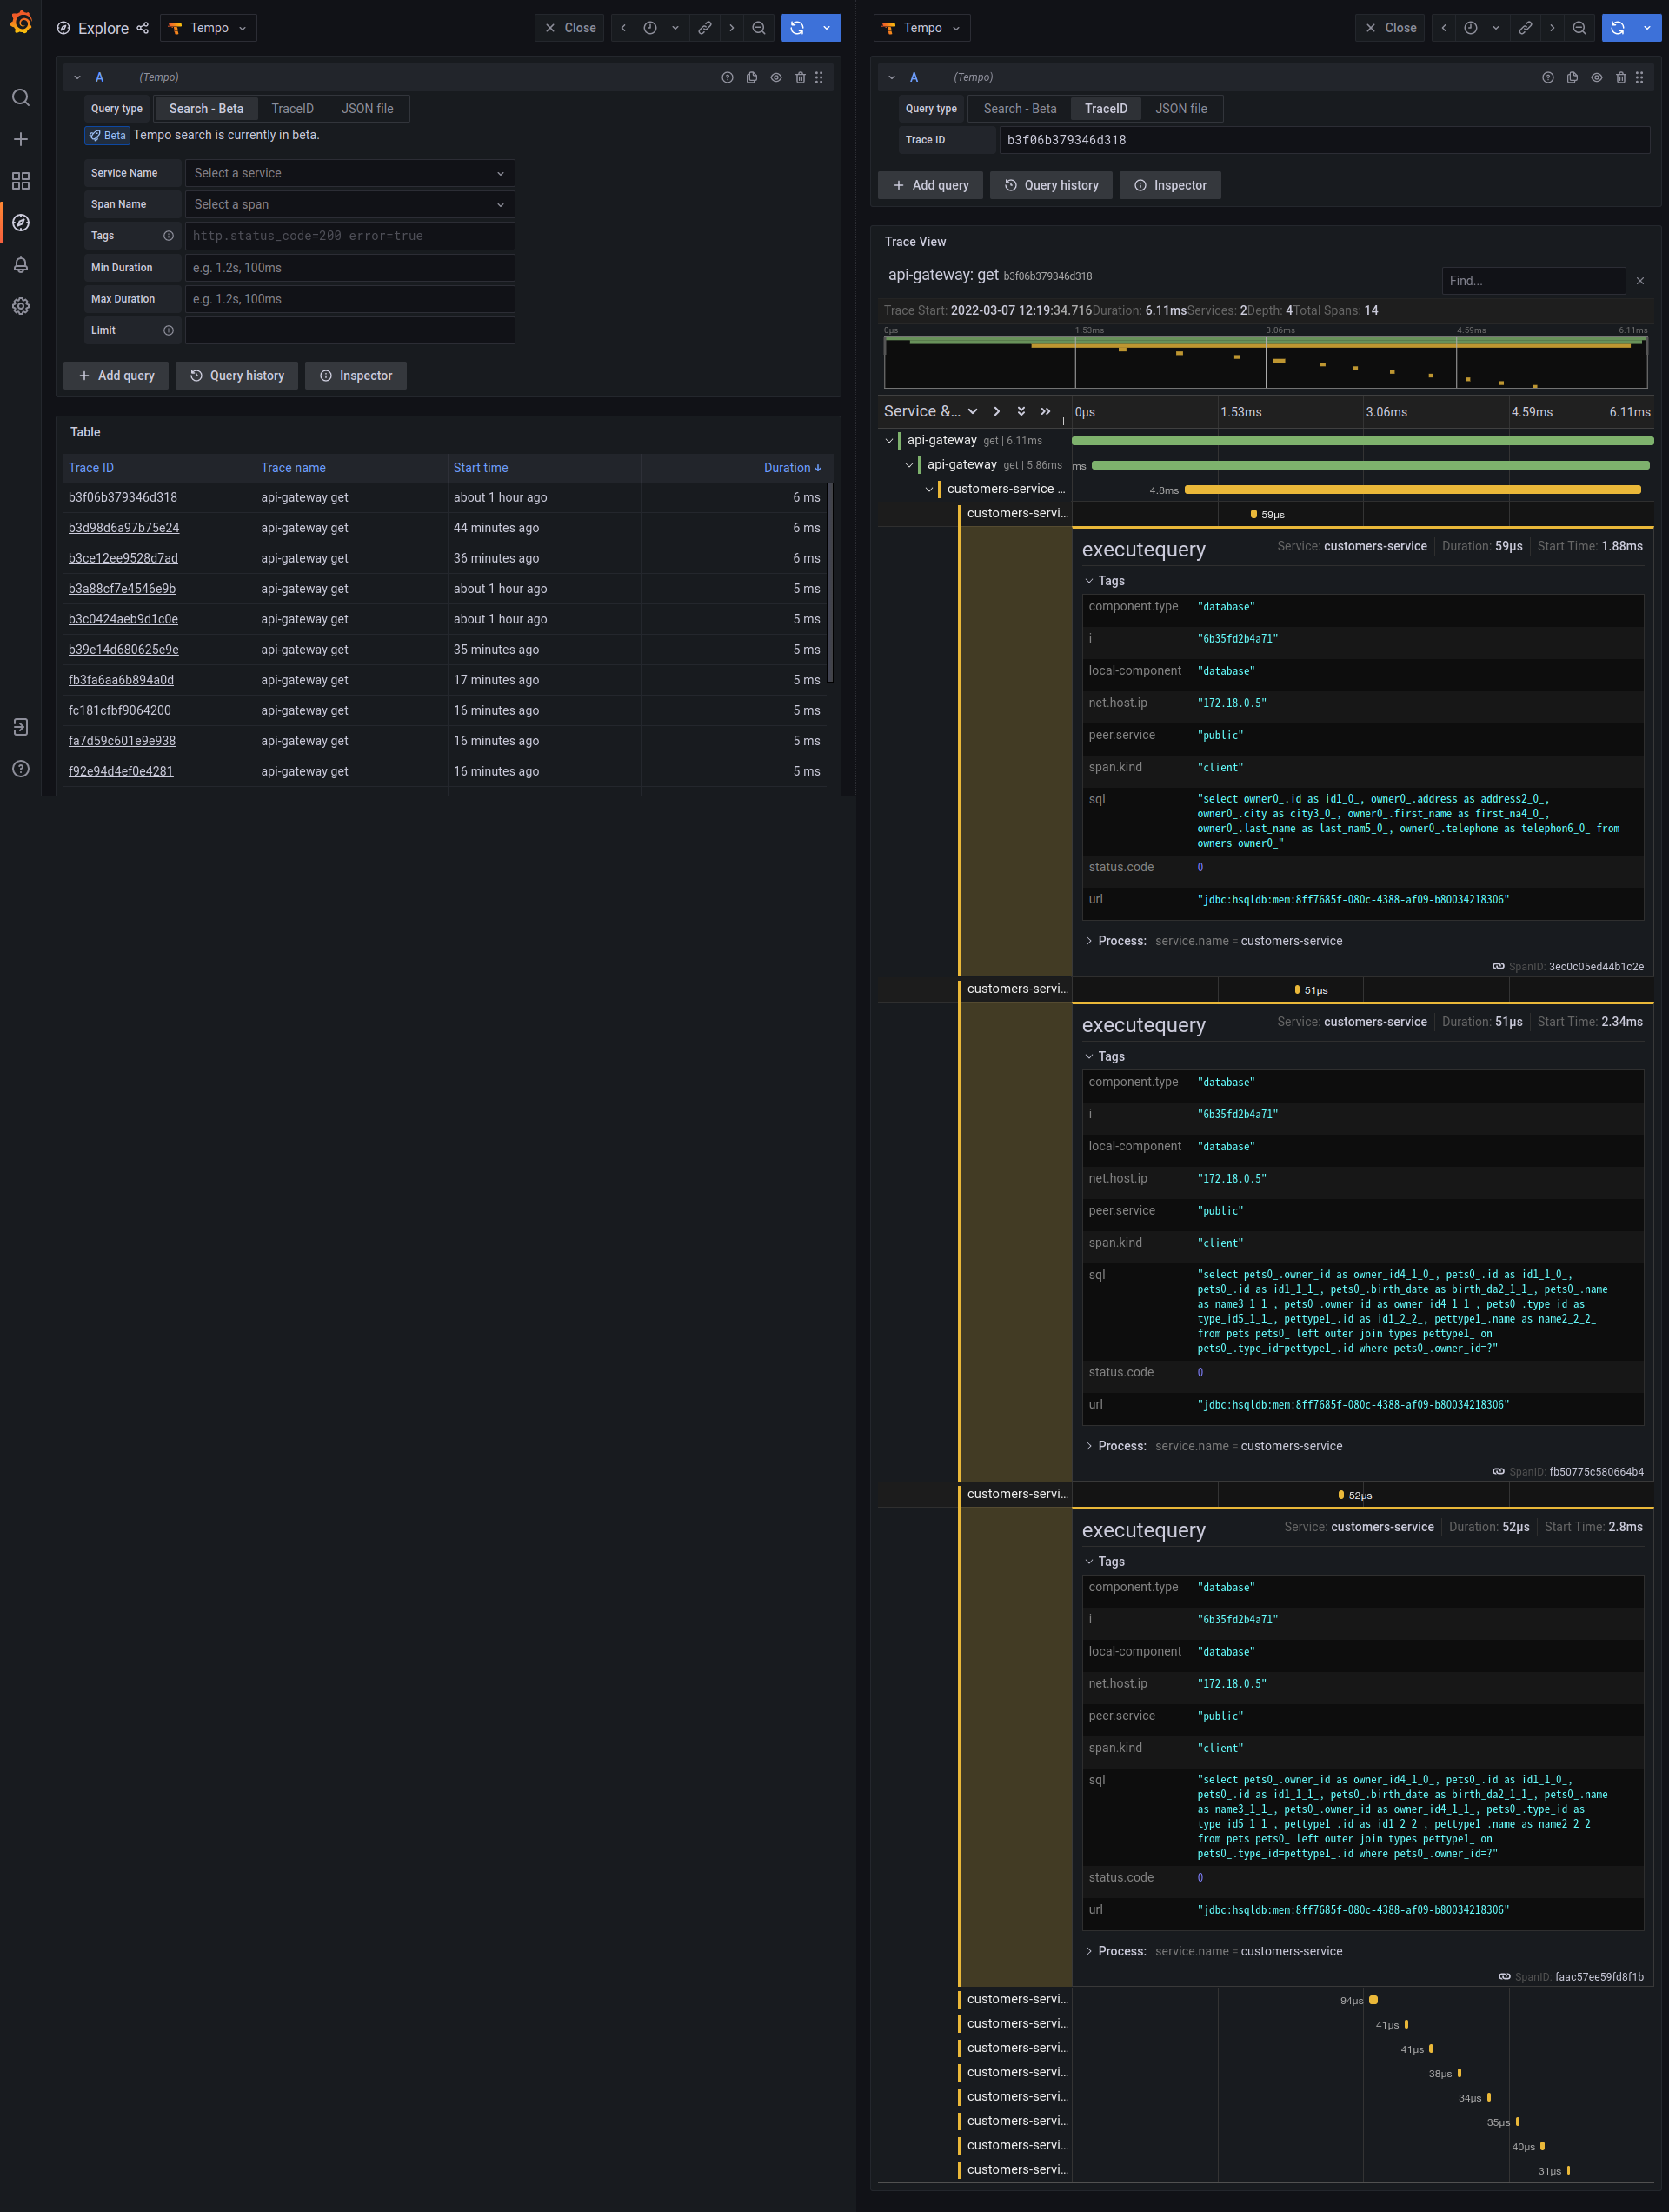
- Step 4. If you want to check the tracing data, you could click the
explorein the left menu bar. Click theSearch - betato switch search mode. Clicksearch querybutton in the right up corner, there is a list containing many tracing. Chose one to click.
The introduction about full metrics collected by the Prometheus is at here
-- End --

