eBPF-based tracing tool for visualizing io-uring workloads. This
tracer leverages eBPF probes via ocaml libbpf bindings
(ocaml_libbpf)) to
extract events from the kernel. Traces are generated in fuchsia format
to be displayed on Perfetto.
!! Both io-uring and eBPF are new & fast moving targets. It has thus proven difficult to provide a stable tool on top of unstable APIs. Therefore, I make little promises on a seamless experience for installing uring-trace on non-supported kernel versions. This tool currently supports 6.1.0 - 6.7.0. It is also likely to work on newer kernels but no guarantees on older ones.
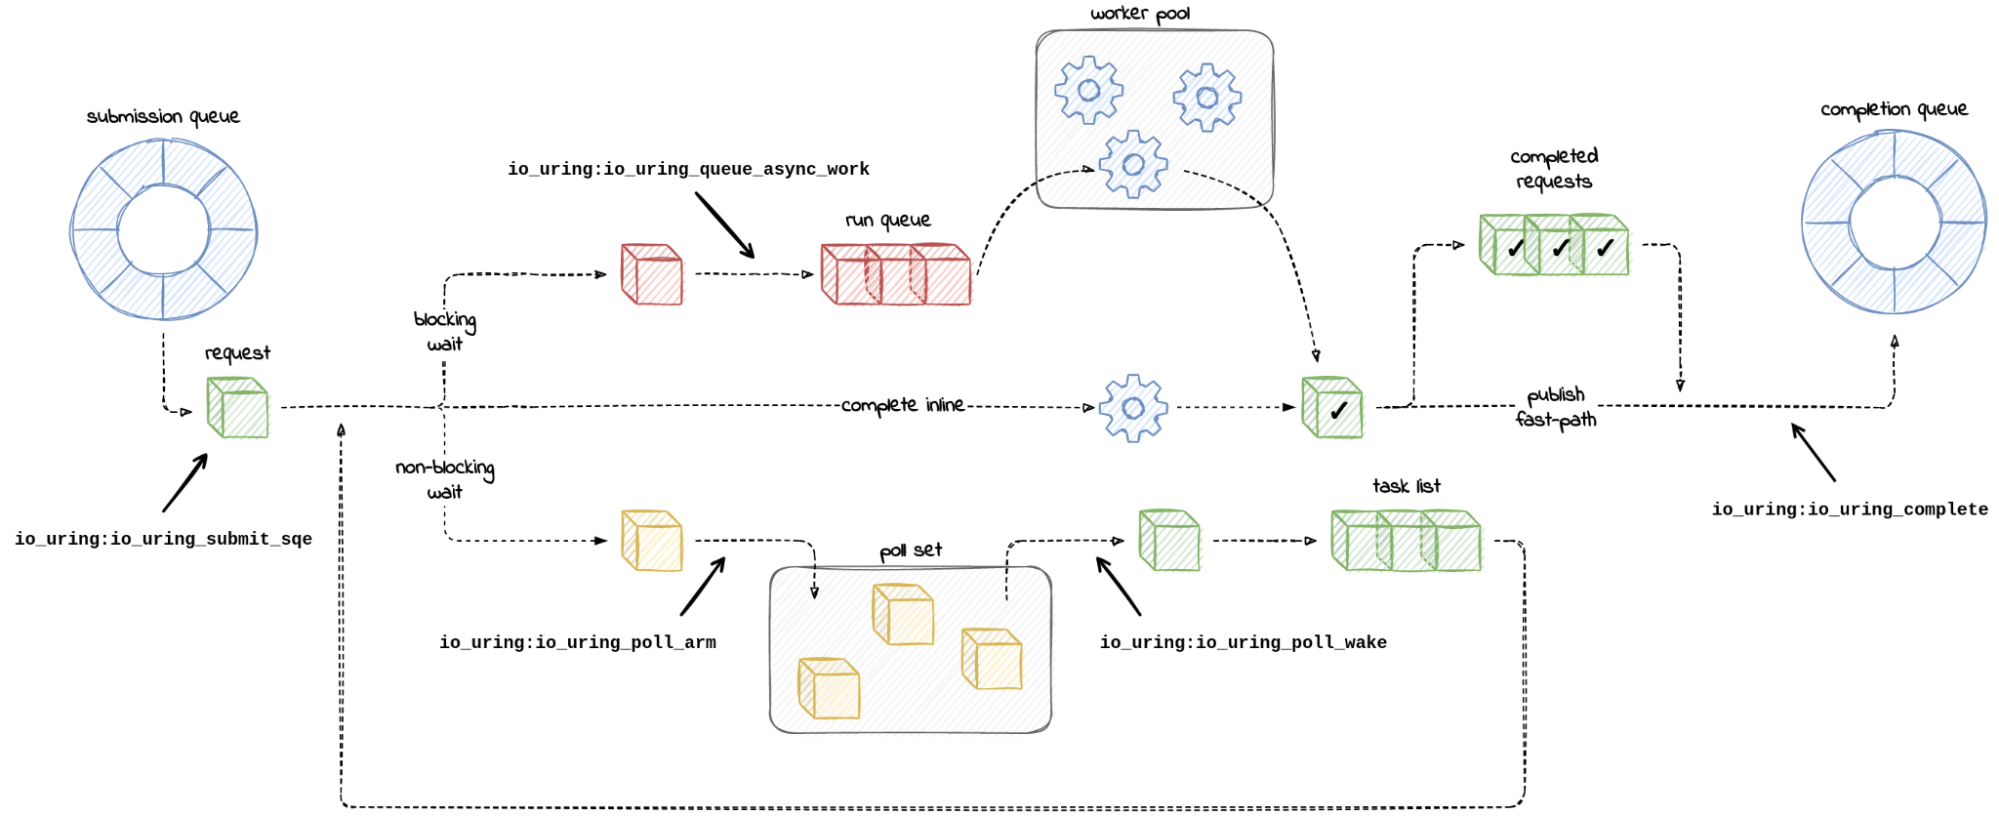
The Mental Model (taken from this blog)
Debugging code using io-uring is challenging since everything runs behind closed doors inside the kernel. From a users perspective, uring offers 1 system call to send & recieve IO. However, under the hood uring is a sophisticated runtime that makes decisions on how to dispatch your IO.
The current best way to gain some observability into io-uring is to
use perf events counters to sample your program. Whilst this works,
it can be hard to get a mental picture of how your program flows since
perf reports the counts and individual histories of the tracepoints it
managed to collect. Our tool on the other hand, traces requests as
they go through the kernel and provide an idiomatic way to understand
how your IO-requests are handled by io-uring. Under the hood, the
tracer uses eBPF technology to hook into kernel tracepoints. Being
based on eBPF, this makes it easy to extend and hook into other
arbritrary points in the kernel to support future enhancements to
tracing.
Visualization features:
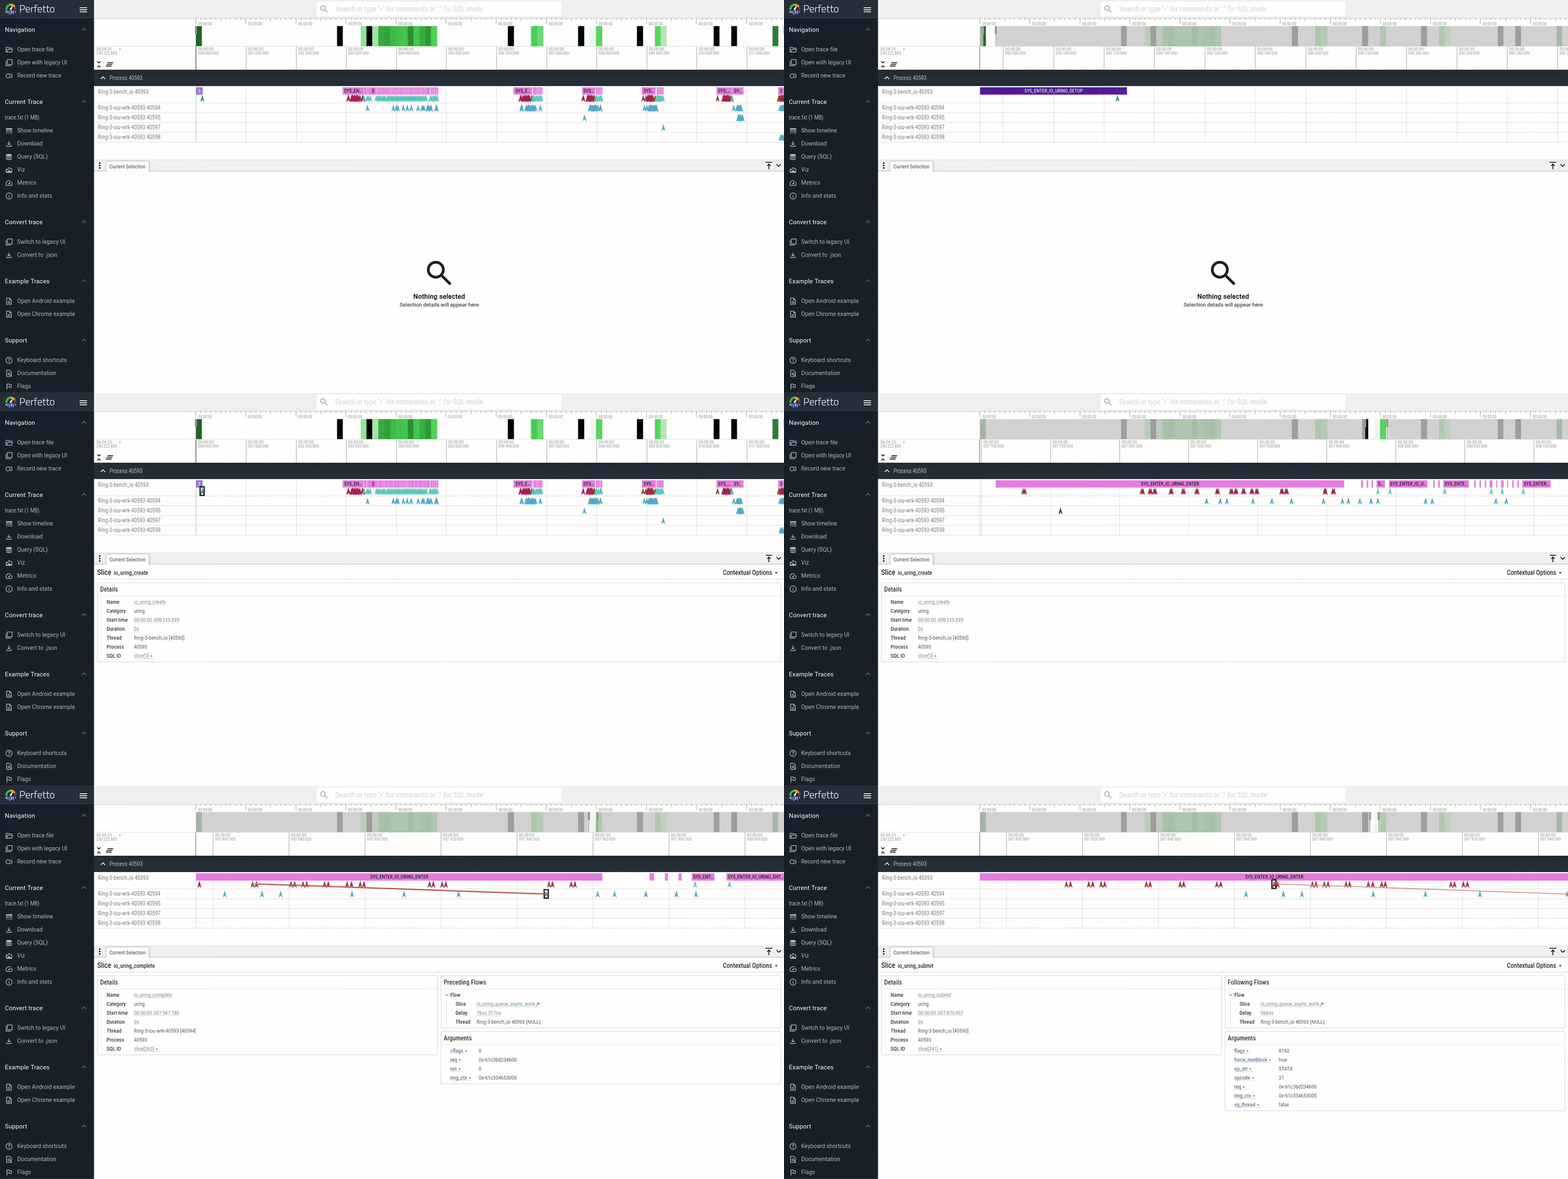
- Path of IO requests from submission to completion
- Syscall time slices
- Kernel spawned IO-worker's tracks
- Multiple rings support
- Sampling option to handle high-throughput workloads
The io-uring runtime makes several decisions on how your request should be processed asynchronously. In particular, there are 3 pathways that your IO request can take:
-
Inline completion (fast path): If the IO request can be carried out immediately and does not need to wait, (i.e. the network interface has pending data), your request will be directly processed by the thread that made the submission and the result will be placed onto the completion queue.
-
Polling (slow path but cheap): For operations that are unable to start immediately but have non-blocking support, the request will be registered to a poll set. When they are ready to be consumed, they are processed by the next thread that enters the ring.
-
Async worker pool (slow path): For operations that are unable to start immediately and do not have non-blockin support, (e.g. regular files, block devices) your request gets punted to a pool of kernel io-workers that will pick up them up and put their results on the completion queue.
This feature visualizes which path a request has taken in the kernel
by drawing arrows connecting tracepoints for each request. The
lifetime of a request starts from a the io_uring_submit tracepoint
and ends with io_uring_complete (NOTE: It's not show when the user
process has consumed the result from the ring). By clicking
any of the tracepoints in perfetto, the UI will draw arrows to show
the path of a request.
io-uring is a performance win because users can reduce the number of syscalls by batching them, thereby reducing overhead of context switch from user to kernel modes. One way to see if your program is really benefitting from this is to see how many requests per system call are being called together.
The strace -c summary is useful for getting some quick numbers of
syscalls. This method has some caveats though. strace adds quite
significant overhead to your running program since it pauses the
program to inspect the program state whenever you hit a syscall. By
doing so, this can end up altering what the actual interaction with
uring looks like. uring-trace solves this by using eBPF, making
tracing less invasive. Syscall slices enable users to quickly see how
many requests are submitted & completed within that slice. The rough
rule of thumb being that the more calls you have in the syscall, the
more effective your batching is.
It's not obvious how many workers are involved in processing blocking requests. There might also be workers that are blocked for a long time. This tool shows each spawned io-worker as a separate track and which request it processed.
Programs may intentionally use multiple rings. This tool can handle these cases since it matches requests to it's ring context
More and more programs are using uring. There may be other programs on
the system making uring syscalls. uring-trace only registers rings
that it has seen the setup command for. This means that other
processes using uring that have been running before the program you
are tracing will have their uring calls filtered and drop. Thus, your
perfetto output won't be garbled with unrelated processes.
-
[-] Path of IO request from submission to completion
-
Tracepoint visualisation support set
- tracepoint:io_uring:io_uring_complete
- tracepoint:io_uring:io_uring_cqe_overflow
- tracepoint:io_uring:io_uring_cqring_wait
- tracepoint:io_uring:io_uring_create
- tracepoint:io_uring:io_uring_defer
- tracepoint:io_uring:io_uring_fail_link
- tracepoint:io_uring:io_uring_file_get
- tracepoint:io_uring:io_uring_link
- tracepoint:io_uring:io_uring_local_work_run
- tracepoint:io_uring:io_uring_poll_arm
- tracepoint:io_uring:io_uring_queue_async_work
- tracepoint:io_uring:io_uring_register
- tracepoint:io_uring:io_uring_req_failed
- tracepoint:io_uring:io_uring_short_write
- tracepoint:io_uring:io_uring_submit_req (previously, tracepoint:io_uring:io_uring_submit_sqe on older kernels)
- tracepoint:io_uring:io_uring_task_add
- tracepoint:io_uring:io_uring_task_work_run
-
Trace flow when event flags set IO-uring SQE link to see user enforced ordering of events.
-
Show when the user picks up the completion so that we can see the ring filling/freeing up
-
-
Syscall track
- io_uring_setup
- io_uring_register
- io_uring_enter
-
IO-worker tracks
- Show number of io-workers
- Connected with flows
To get this tool, the easiest way is to download it from opam, the OCaml package manager.
# install opam
bash -c "sh <(curl -fsSL https://raw.githubusercontent.com/ocaml/opam/master/shell/install.sh)"

# initialize package manager
opam init

# install binary
opam install uring-trace

# put uring-trace on path
eval $(opam env)To trace a program, you need to run the uring_trace binary as a
separate process. The uring_trace will detect when a new uring
instance is spawned and record events from there. We do not offer
the option to spawn your process you want to trace directly from the
uring_trace binary. This is simply because uring_trace requires
root priviledges to run and it would be bad to elevate your process
run level.
# replace $ with sudo
$ env "PATH=$PATH" uring-trace

# In a separate terminal
<execute your program>
You can also use uring-trace --help to see the man page for other options.
Once you've finished tracing or would like to stop tracing, hit
Ctrl-C and you should find a trace.fxt file in the same directory
as uring-trace/src which you can load into perfetto to explore what
io-uring was doing under the hood.
This tool reads events through a shared ring buffer with the kernel. As such there is a possibility that events are overwritten before they are read and processed when tracing busy workloads. This can result in trace visualizations with missing events that look strange. To workaround this, the tracing tool has a sampling parameter that can be tuned to trace only a percentage of the requests coming in.

