This application connects to a SweetZpot FLOW breathing sensor using Bluetooth Low Energy, and predicts airflow using a LSTM neural network model.
Hardware:
Software:
- Web Bluetooth supported browser, for example Google Chrome.
- Moesif Orign & CORS Changer browser plugin or similar plugin that allows you to send cross-domain requests directly from browser without receiving Cross Origin Errors.
- Python 3, with the following modules:
torchflasknumpyjoblibscikit-learn
- Strap the FLOW sensor around your chest, just below your chest muscles. The sensor may be worn on top of clothing, but the clothes should not be too thick, to make sure the sensor closely matches the movement of your ribcage. The length of the belt can be adjusted, such that it sits comfortably around your chest without gliding down during movement. It should not be too tight; you should be able to breath freely without constriction. NB: Be sure to wear the belt before you connect it to the web app, otherwise the data will not be scaled correctly.
- Start the airflow prediction app by running
python app.pyin a terminal from thesrcdirectory. - Make sure that the Moesif CORS plugin (or similar plugin) is switched on, and that your browser supports Web Bluetooth (for example Google Chrome).
- Open
index.htmlin your browser.
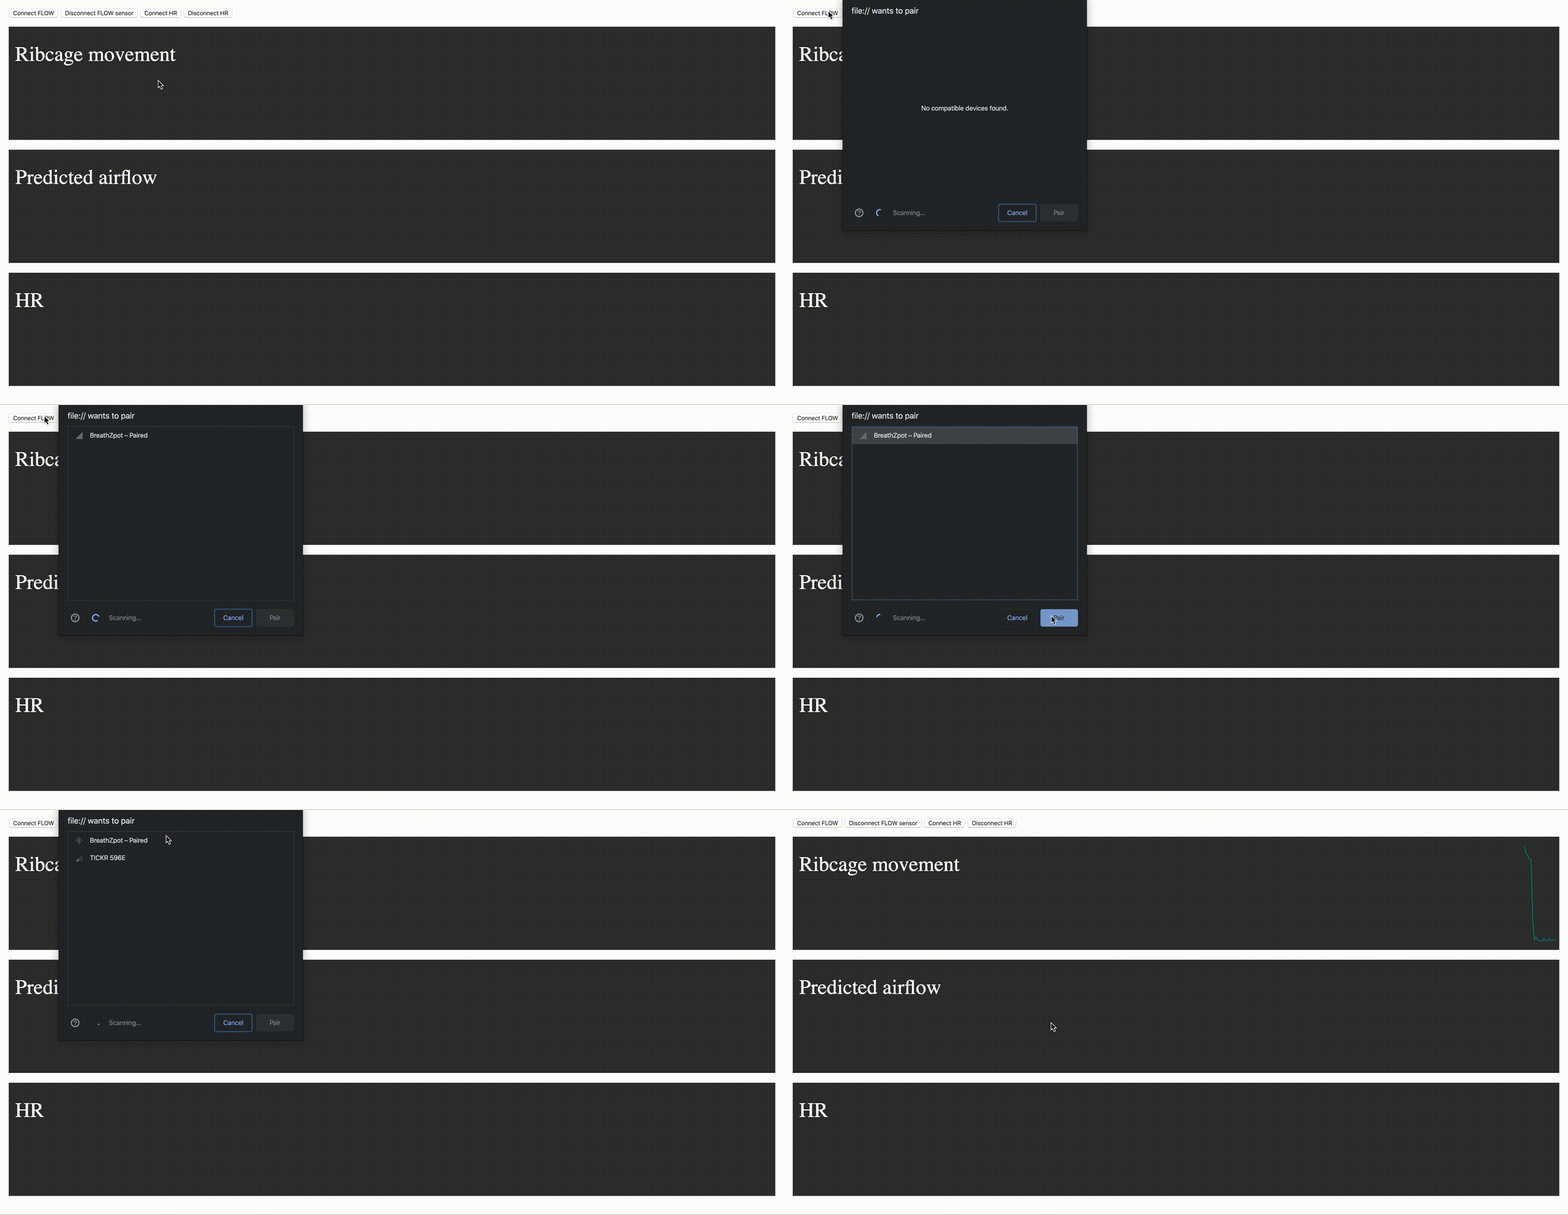
- Click Connect FLOW.
- Wait for the FLOW sensor to appear as "BreathZpot". In some cases this may take up to 30 seconds. If it does not appear, this might indicate that the FLOW sensor needs a new battery.
- Select the FLOW (BreathZpot) sensor when it appears, and click Pair.
- After 3-8 seconds, the web app starts receiving data from the sensor, and the real time graph of the ribcage movement is shown.
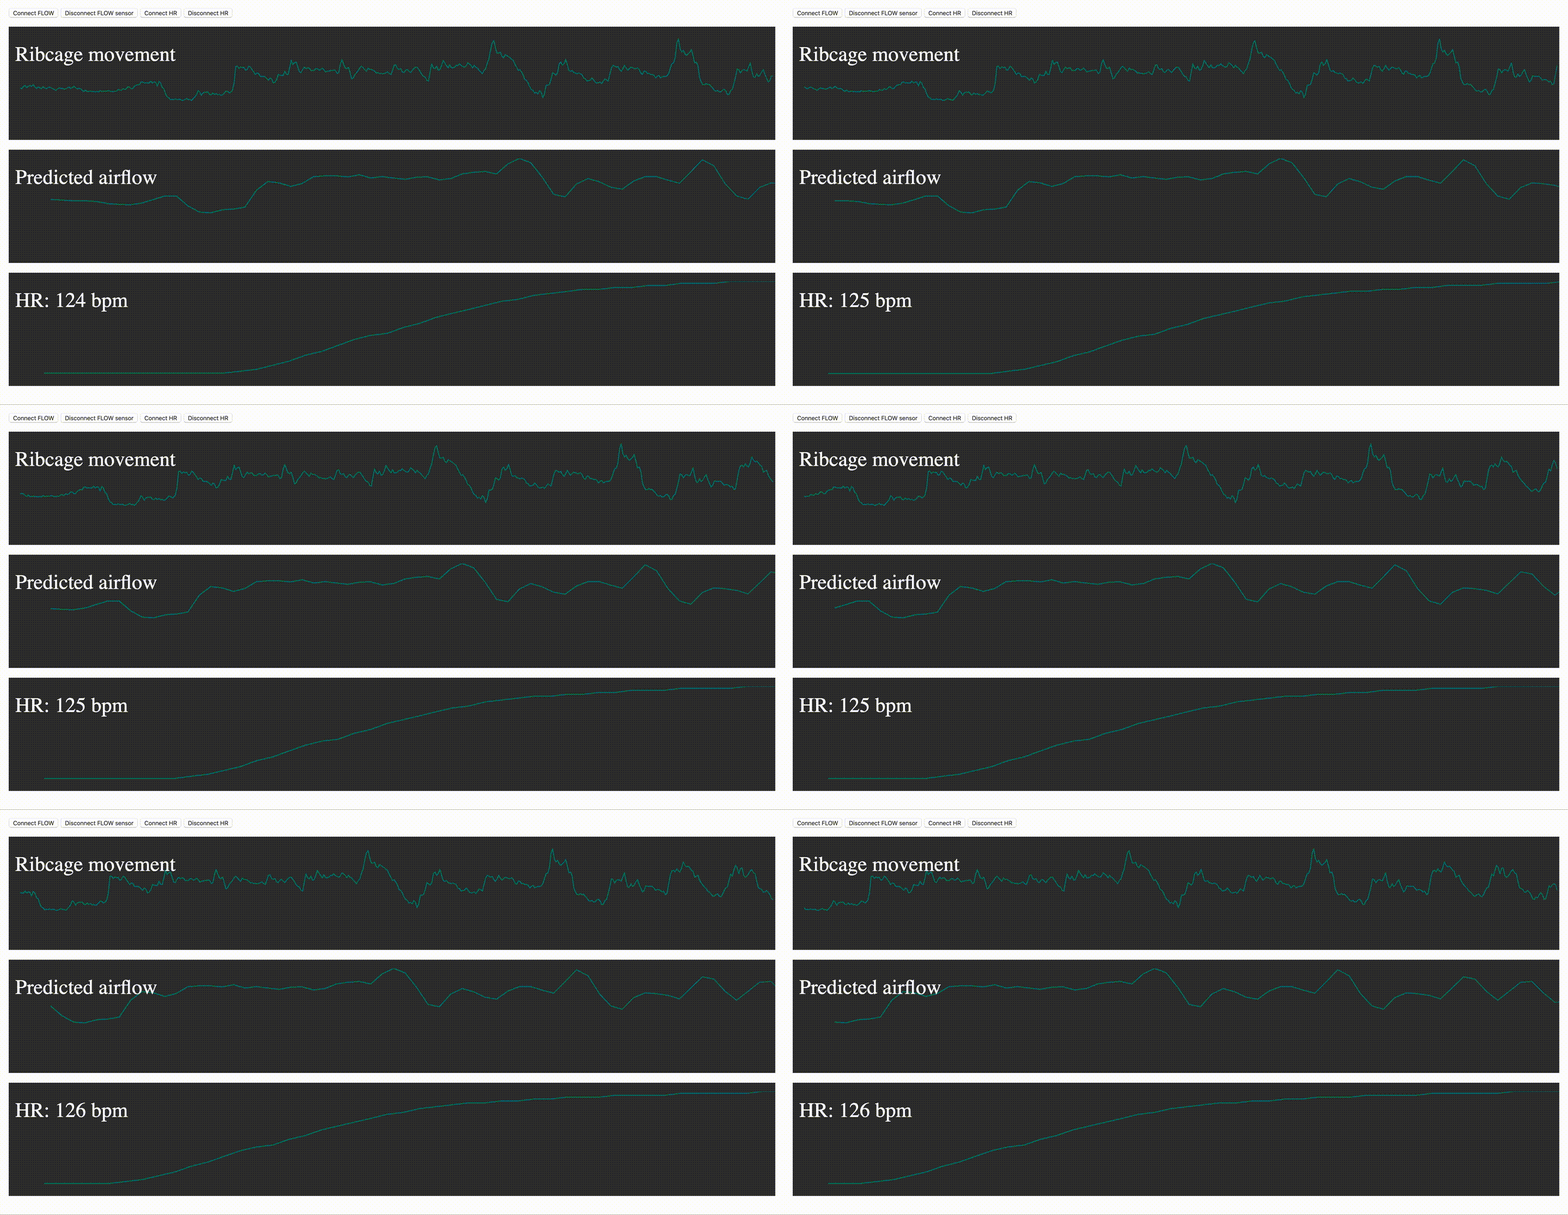
- After 5 seconds of FLOW sensor data is sampled, the airflow prediction begins, and shows a real time graph.
- To sample heart rate data (optional), wear a heart rate sensor just below the chest muscles next to the skin. Click Connect HR, and pair the sensor as described above.
The real time graphs will automatically scale based on the maximum and minimum values obtained. The top graph shows the movement of the ribcage. The second graph shows predicted airflow, but no value is shown since that would require calibration. The bottom graph shows the heart rate in beats per minute.
If you experience trouble with connecting the sensor, or the web app does not visualize any data, you could try:
-
Reload the page (
index.html), and try to reconnect to sensor(s). -
Open the JavaScript console in the browser (in Google Chrome: View -> Developer -> Javascript Console). Any error messages will appear here.
-
Double check that the script
app.pyis running in the background. When running the script, you should get a printout that includes:Breath scaler load successfully Airflow scaler load successfully LSTM load successfully -
Double check that the Moesif Orign & CORS Changer browser plugin is turned on.


