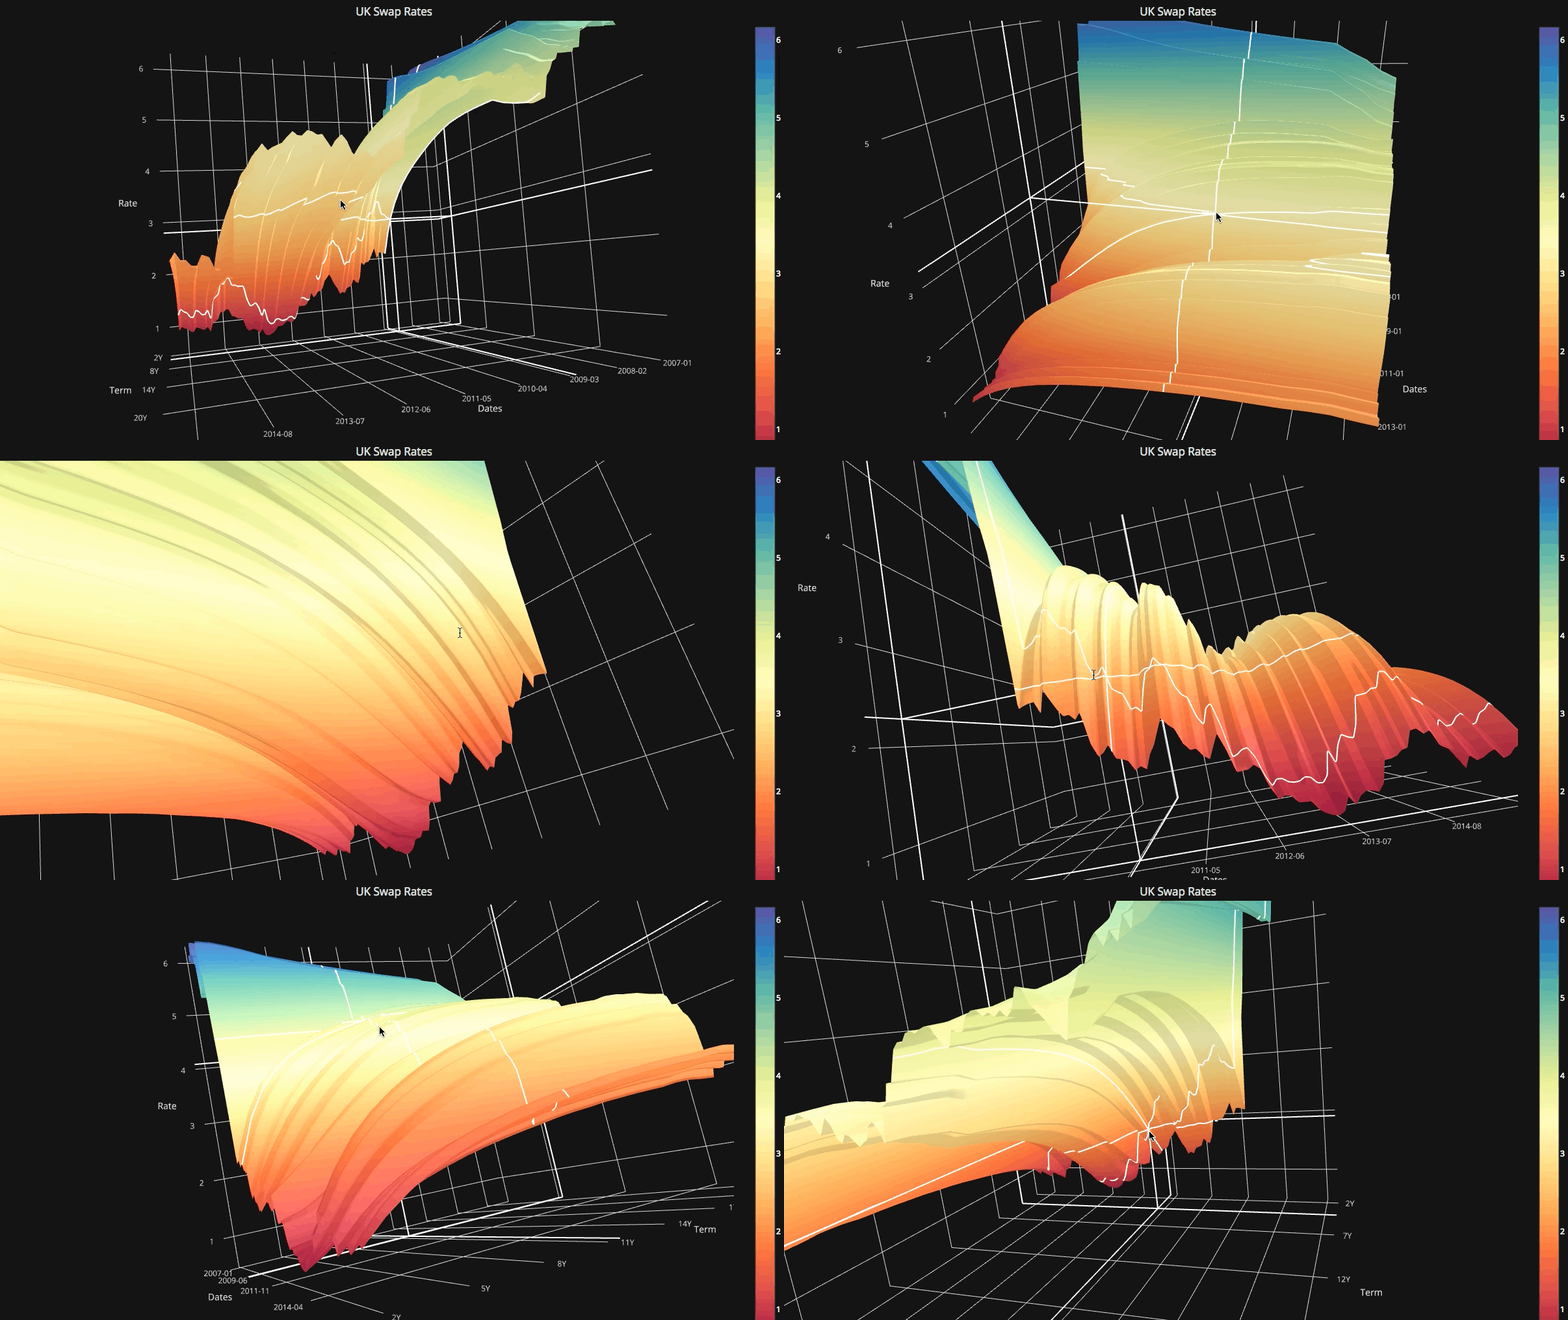
##Cufflinks
(This is a Python 3 compatible version of Cufflinks modified by Thalesians)
This library binds the power of plotly with the flexibility of pandas for easy plotting.
This library is available on https://github.com/santosjorge/cufflinks
This tutorial assumes that the plotly user credentials have already been configured as stated on the getting started guide.
###Tutorials:
- Support of offline charts
cf.go_offline()cf.go_online()cf.iplot(figure,online=True)(To force online whilst on offline mode)
- Support for secondary axis
fig=cf.datagen.lines(3,columns=['a','b','c']).figure()
fig=fig.set_axis('b',side='right')
cf.iplot(fig)
- Support for global theme setting
cufflinks.set_config_file(theme='pearl')
- New theme ggplot
cufflinks.datagen.lines(5).iplot(theme='ggplot')
- Support for horizontal bar charts barh
cufflinks.datagen.lines(2).iplot(kind='barh',barmode='stack',bargap=.1)
- Support for histogram orientation and normalization
cufflinks.datagen.histogram().iplot(kind='histogram',orientation='h',norm='probability')
- Support for area plots
cufflinks.datagen.lines(4).iplot(kind='area',fill=True,opacity=1)
- Support for subplots
cufflinks.datagen.histogram(4).iplot(kind='histogram',subplots=True,bins=50)cufflinks.datagen.lines(4).iplot(subplots=True,shape=(4,1),shared_xaxes=True,vertical_spacing=.02,fill=True)
- Support for scatter matrix to display the distribution amongst every series in the DataFrame
cufflinks.datagen.lines(4,1000).scatter_matrix()
- Support for vline and hline for horizontal and vertical lines
cufflinks.datagen.lines(3).iplot(hline=[2,3])cufflinks.datagen.lines(3).iplot(hline=dict(y=2,color='blue',width=3))
- Support for vspan and hspan for horizontal and vertical areas
cufflinks.datagen.lines(3).iplot(hspan=(-1,2))cufflinks.datagen.lines(3).iplot(hspan=dict(y0=-1,y1=2,color='orange',fill=True,opacity=.4))
- Global setting for public charts
cufflinks.set_config_file(world_readable=True)
- Enhanced Spread charts
cufflinks.datagen.lines(2).iplot(kind='spread')
- Support for Heatmap charts
cufflinks.datagen.heatmap().iplot(kind='heatmap')
- Support for Bubble charts
cufflinks.datagen.bubble(4).iplot(kind='bubble',x='x',y='y',text='text',size='size',categories='categories')
- Support for Bubble3d charts
cufflinks.datagen.bubble3d(4).iplot(kind='bubble3d',x='x',y='y',z='z',text='text',size='size',categories='categories')
- Support for Box charts
cufflinks.datagen.box().iplot(kind='box')
- Support for Surface charts
cufflinks.datagen.surface().iplot(kind='surface')
- Support for Scatter3d charts
cufflinks.datagen.scatter3d().iplot(kind='scatter3d',x='x',y='y',z='z',text='text',categories='categories')
- Support for Histograms
cufflinks.datagen.histogram(2).iplot(kind='histogram')
- Data generation for most common plot types
cufflinks.datagen
- Data extraction: Extract data from any Plotly chart. Data is delivered in DataFrame
cufflinks.to_df(Figure)
- Integration with colorlover
- Support for scales
iplot(colorscale='accent')to plot a chart using an accent color scale - cufflinks.scales() to see all available scales
- Support for scales
- Support for named colors
*
iplot(colors=['pink','red','yellow'])
