This guide provides detailed steps to:
- Provision and configure the primary host for Jenkins, SonarQube, Grafana, and Prometheus.
- Set up Jenkins with the necessary plugins.
- Create and configure a Jenkins pipeline for building, testing, provisioning infrastructure, and deploying a Java application.
- A DigitalOcean account with API access.
- SSH key added to your DigitalOcean account.
- Ansible installed on your local machine.
Create a directory for your Terraform configuration files and add the following files:
main.tf
terraform {
  required_providers {
    digitalocean = {
      source  = "digitalocean/digitalocean"
      version = "~> 2.0"
    }
  }
}

provider "digitalocean" {
  token = var.do_token
}

data "digitalocean_droplet" "existing" {
  name = "app-server"
}

resource "digitalocean_droplet" "app_server" {
  count = data.digitalocean_droplet.existing.id == "" ? 1 : 0
  image    = "ubuntu-20-04-x64"
  name     = "app-server"
  region   = "nyc3"
  size     = "s-1vcpu-1gb"
  ssh_keys = [var.ssh_key_id]

  provisioner "remote-exec" {
    inline = [
      "apt-get update && apt-get upgrade -y",
      "apt-get install -y sshpass",
      "useradd -m -s /bin/bash deployer",
      "echo 'deployer ALL=(ALL) NOPASSWD:ALL' >> /etc/sudoers",
      "mkdir -p /home/deployer/.ssh",
      "echo '${var.ssh_public_key}' > /home/deployer/.ssh/authorized_keys",
      "chown -R deployer:deployer /home/deployer/.ssh",
      "chmod 700 /home/deployer/.ssh",
      "chmod 600 /home/deployer/.ssh/authorized_keys"
    ]

    connection {
      type        = "ssh"
      user        = "root"
      private_key = file(var.ssh_private_key)
      host        = self.ipv4_address
    }
  }

  provisioner "local-exec" {
    command = <<EOF
      ssh-keyscan -H ${self.ipv4_address} >> ~/.ssh/known_hosts
    EOF
  }
}

output "app_server_ip" {
  value = coalesce(
    data.digitalocean_droplet.existing.ipv4_address,
    try(digitalocean_droplet.app_server[0].ipv4_address, null)
  )
}

Explanation:
- This file contains the main Terraform configuration. It sets up a DigitalOcean droplet if one does not already exist. If a droplet already exists, it retrieves its details instead of creating a new one.
- The locals block determines whether to use an existing droplet's IP address or the newly created one.
- The output block provides the IP address of the app server.
variables.tf
variable "do_token" {
  description = "DigitalOcean API token"
  type        = string
}

variable "ssh_key_id" {
  description = "DigitalOcean SSH key ID"
  type        = string
}Explanation:
- This file defines the variables required for the Terraform configuration, including the DigitalOcean API token and SSH key ID.

terraform.tfvars
do_token = "your_digitalocean_api_token"
ssh_key_id = "your_ssh_key_id"

Step 1: Create the User (if not already created) Log in to your DigitalOcean droplet and create the user:
sudo adduser deployer
Step 2: Add SSH Key for the User
Add your public SSH key to the ~/.ssh/authorized_keys file of the deployer user:
sudo mkdir /home/deployer/.ssh
sudo nano /home/deployer/.ssh/authorized_keys
# Paste your public SSH key into the file
sudo chown -R deployer:deployer /home/deployer/.ssh
sudo chmod 700 /home/deployer/.ssh
sudo chmod 600 /home/deployer/.ssh/authorized_keys
Create an Ansible playbook file named setup_tools.yml:
- hosts: localhost
  become: yes
  vars:
    ansible_user: "deployer"
    ssh_key_path: "/root/.ssh/id_rsa"
  tasks:
    - name: Update apt cache
      apt:
        update_cache: yes

    - name: Install Docker
      apt:
        name: docker.io
        state: present

    - name: Install Docker Compose
      shell: curl -L "https://github.com/docker/compose/releases/download/1.29.2/docker-compose-$(uname -s)-$(uname -m)" -o /usr/local/bin/docker-compose

    - name: Set permissions for Docker Compose
      file:
        path: /usr/local/bin/docker-compose
        mode: "0755"

    - name: Start Docker service
      service:
        name: docker
        state: started
        enabled: yes

    - name: Create directories for tools
      file:
        path: "{{ item }}"
        state: directory
        mode: "0755"
      with_items:
        - /opt/jenkins
        - /opt/sonarqube/data
        - /opt/grafana/data
        - /opt/grafana/provisioning/datasources
        - /opt/prometheus/data

    - name: Ensure the Docker network exists
      shell: |
        if ! docker network ls | grep -q cicd_network; then
          docker network create cicd_network
        fi

    - name: Create Prometheus configuration file
      copy:
        dest: /opt/prometheus/prometheus.yml
        content: |
          global:
            scrape_interval: 15s

          scrape_configs:
            - job_name: 'jenkins'
              static_configs:
                - targets: ['jenkins:8080']

    - name: Create Grafana provisioning file for Prometheus
      copy:
        dest: /opt/grafana/provisioning/datasources/prometheus.yml
        content: |
          apiVersion: 1
          datasources:
            - name: Prometheus
              type: prometheus
              access: proxy
              url: http://prometheus:9090
              isDefault: true

    - name: Run Jenkins container with required settings
      shell: |
        docker stop jenkins || true
        docker rm jenkins || true
        docker run -d -u root --privileged=true \
          --network cicd_network \
          --volume /opt/jenkins/jenkins_home:/var/jenkins_home \
          -v /var/run/docker.sock:/var/run/docker.sock \
          -v "{{ ssh_key_path }}:/root/.ssh/id_rsa" \
          -p 8080:8080 -p 50000:50000 --name jenkins jenkins/jenkins:lts

    - name: Install Terraform in Jenkins container
      shell: |
        docker exec -u root jenkins bash -c "apt-get update && apt-get install -y wget unzip && \
        wget https://releases.hashicorp.com/terraform/1.1.5/terraform_1.1.5_linux_amd64.zip && \
        unzip terraform_1.1.5_linux_amd64.zip && mv terraform /usr/local/bin/ && \
        rm terraform_1.1.5_linux_amd64.zip"

    - name: Create Docker Compose file for SonarQube
      copy:
        dest: /opt/sonarqube/docker-compose.yml
        content: |
          version: '3'
          services:
            sonarqube:
              image: sonarqube
              container_name: sonarqube
              ports:
                - "0.0.0.0:9000:9000"
              networks:
                - cicd_network
              volumes:
                - /opt/sonarqube/data/sonarqube-data:/opt/sonarqube/data
          networks:
            cicd_network:
              external: true

    - name: Create Docker Compose file for Grafana
      copy:
        dest: /opt/grafana/docker-compose.yml
        content: |
          version: '3'
          services:
            grafana:
              image: grafana/grafana
              container_name: grafana
              ports:
                - "0.0.0.0:3000:3000"
              networks:
                - cicd_network
              volumes:
                - /opt/grafana/data:/var/lib/grafana
                - /opt/grafana/provisioning:/etc/grafana/provisioning
          networks:
            cicd_network:
              external: true

    - name: Create Docker Compose file for Prometheus
      copy:
        dest: /opt/prometheus/docker-compose.yml
        content: |
          version: '3'
          services:
            prometheus:
              image: prom/prometheus
              container_name: prometheus
              ports:
                - "0.0.0.0:9090:9090"
              networks:
                - cicd_network
              volumes:
                - /opt/prometheus/data:/prometheus
                - /opt/prometheus/prometheus.yml:/etc/prometheus/prometheus.yml
          networks:
            cicd_network:
              external: true

    - name: Start SonarQube
      command: docker-compose up -d
      args:
        chdir: /opt/sonarqube

    - name: Start Grafana
      command: docker-compose up -d
      args:
        chdir: /opt/grafana

    - name: Start Prometheus
      command: docker-compose up -d
      args:
        chdir: /opt/prometheus

    - name: Restart Jenkins
shell: docker restart jenkins- Update apt cache: Updates the apt package cache.
- Install Docker: Installs Docker.
- Install Docker Compose: Installs Docker Compose.
- Set permissions for Docker Compose: Sets the permissions for Docker Compose.
- Start Docker service: Starts and enables the Docker service.
- Create directories for tools: Creates the necessary directories for Jenkins, SonarQube, Grafana, and Prometheus.
- Create a common Docker network: Creates a common Docker network for the containers.
- Create Prometheus configuration file: Creates the configuration file for Prometheus.
- Create Grafana provisioning file for Prometheus: Creates the provisioning file for Grafana to use Prometheus.
- Ensure the Docker network exists: This block checks if the Docker network cicd_network exists before attempting to create it, avoiding errors due to the network already existing.
- Run Jenkins container with required settings: Runs the Jenkins container with the specified settings.
- Install Terraform in Jenkins container: Installs Terraform within the Jenkins container to ensure it persists across restarts.
- Create Docker Compose file for SonarQube: Creates the Docker Compose file for SonarQube.
- Create Docker Compose file for Grafana: Creates the Docker Compose file for Grafana.
- Create Docker Compose file for Prometheus: Creates the Docker Compose file for Prometheus.
- Start SonarQube: Starts the SonarQube container.
- Start Grafana: Starts the Grafana container.
- Start Prometheus: Starts the Prometheus container.
- Restart Jenkins: Restarts the Jenkins container to apply any changes.
- Run the Ansible playbook with the following command::
ansible-playbook -i localhost, -c local -u deployer --become --private-key /root/.ssh/id_rsa /root/cicd/setup_tools.yml
Edit the Prometheus configuration file /opt/prometheus/prometheus.yml to include the Jenkins target:
global:
  scrape_interval: 15s

scrape_configs:
  - job_name: "jenkins"
    static_configs:
      - targets: ["jenkins:8080"]
Restart the Prometheus container to apply the changes:
docker restart prometheus
To create a shared network for all the containers:
docker network create shared_network
Ensure all services are connected to this network by adding networks: - shared_network in their respective Docker Compose files, as shown in the playbook.
- Install
sshpasson the Jenkins Container to use the 'ssh' connection type with passwords:
-
Check Prometheus Targets: Access Prometheus at
http://<your-server-ip>:9090/targets and verify that the Jenkins target is UP. -
Set Up Grafana Dashboards:
- Access Grafana at http://:3000.
- Add Prometheus as a data source and configure it to point to http://prometheus:9090.
- Import Jenkins monitoring dashboards or create custom dashboards to visualize the metrics.
This setup ensures that Jenkins, Prometheus, Grafana, and SonarQube are properly installed and configured to communicate within a shared Docker network. By following these steps, you should be able to monitor Jenkins jobs and performance metrics effectively.
Installing sshpass in order to ssh in the deployable machines from Jenkins server.
docker exec -it jenkins bash
apt-get update
apt-get install -y sshpass


-
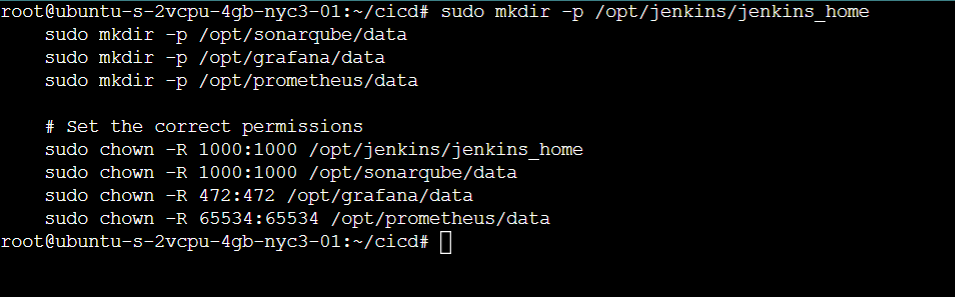
Run the following commands to set the correct permissions on the directories:
  # Ensure the directories exist
  sudo mkdir -p /opt/jenkins/jenkins_home
  sudo mkdir -p /opt/sonarqube/data
  sudo mkdir -p /opt/grafana/data
  sudo mkdir -p /opt/prometheus/data

  # Set the correct permissions
  sudo chown -R 1000:1000 /opt/jenkins/jenkins_home
  sudo chown -R 1000:1000 /opt/sonarqube/data
  sudo chown -R 472:472 /opt/grafana/data
  sudo chown -R 65534:65534 /opt/prometheus/data
-
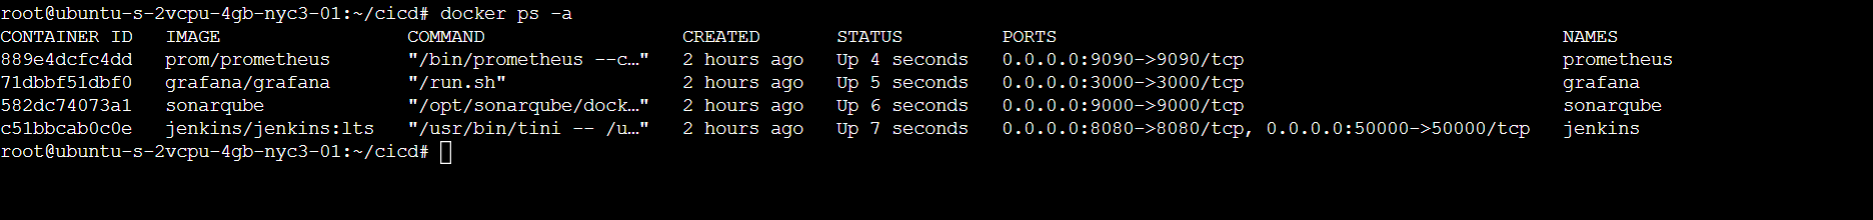
After fixing the permissions, restart the Docker containers:
  docker start jenkins
  docker start sonarqube
  docker start grafana
  docker start prometheus


You need to authenticate doctl with your DigitalOcean API token. Here’s how:
-
Obtain DigitalOcean API Token:
- Go to your DigitalOcean Control Panel.
- Generate a new personal access token if you don’t have one already. Copy the token.
-
Authenticate
doctl:- Run the following command and paste your API token when prompted:
doctl auth init
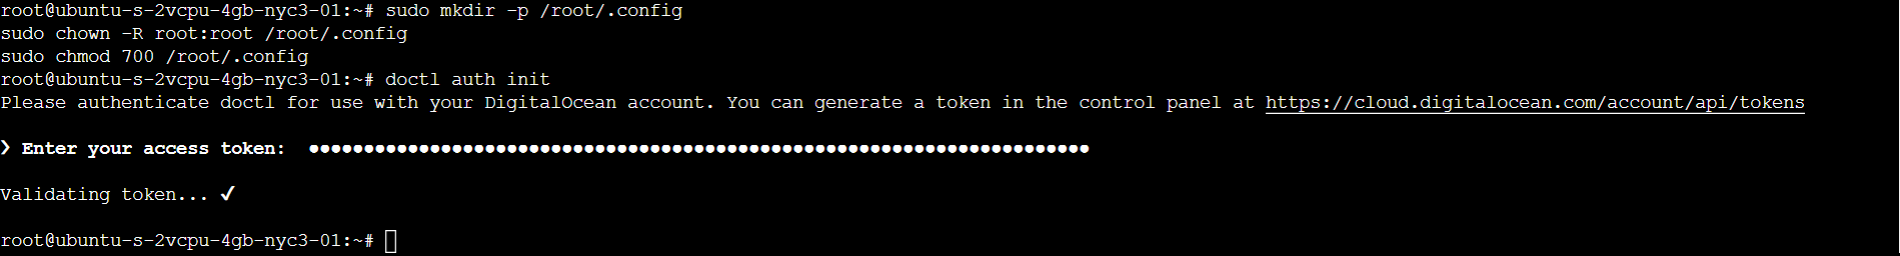
- Run the following command and paste your API token when prompted:
-
List SSH Keys
- After authenticating, you can list your SSH keys to get the SSH key ID:
doctl compute ssh-key list
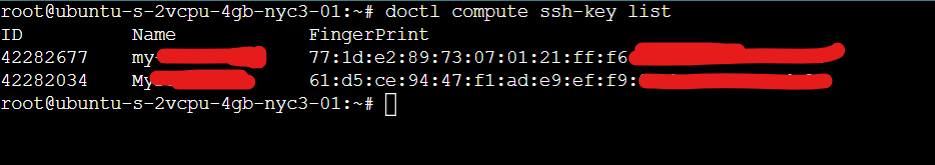
- After authenticating, you can list your SSH keys to get the SSH key ID:


-
Access Jenkins Dashboard:
- Navigate to
http://<your-jenkins-server-ip>:8080.
- Navigate to
-
Unlock Jenkins:
-
During the first time accessing Jenkins, you will be asked to unlock it using an initial admin password. This password is stored in the
/var/jenkins_home/secrets/initialAdminPasswordfile.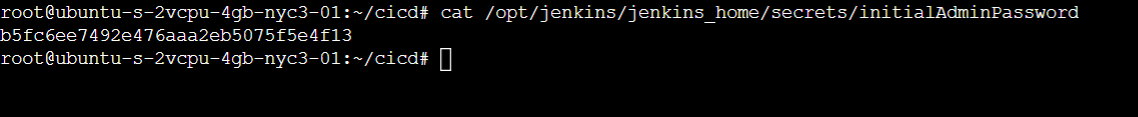
-
Retrieve the password by running the following command on your server:
sudo cat /opt/jenkins/jenkins_home/secrets/initialAdminPassword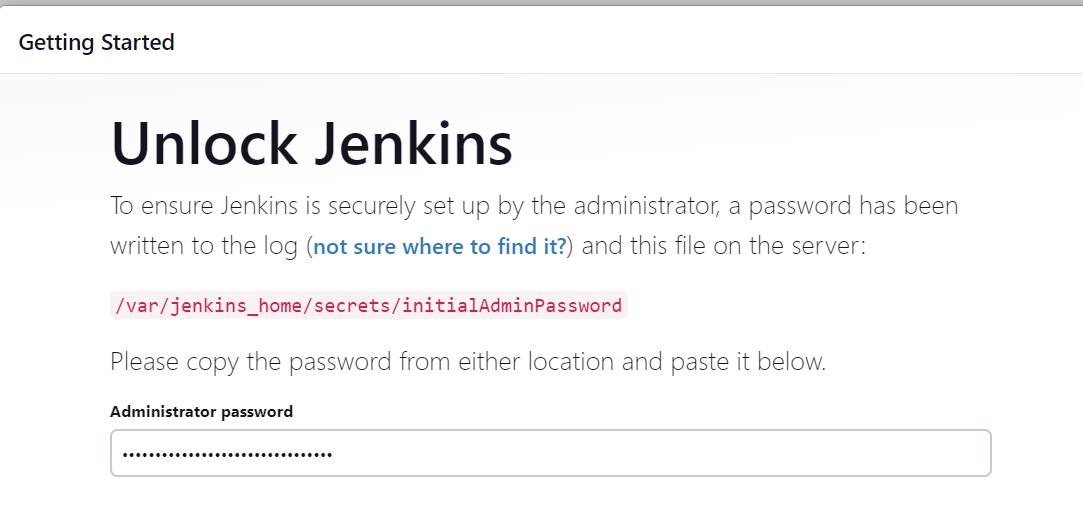
-
Enter this password in the Jenkins web interface.
-
-
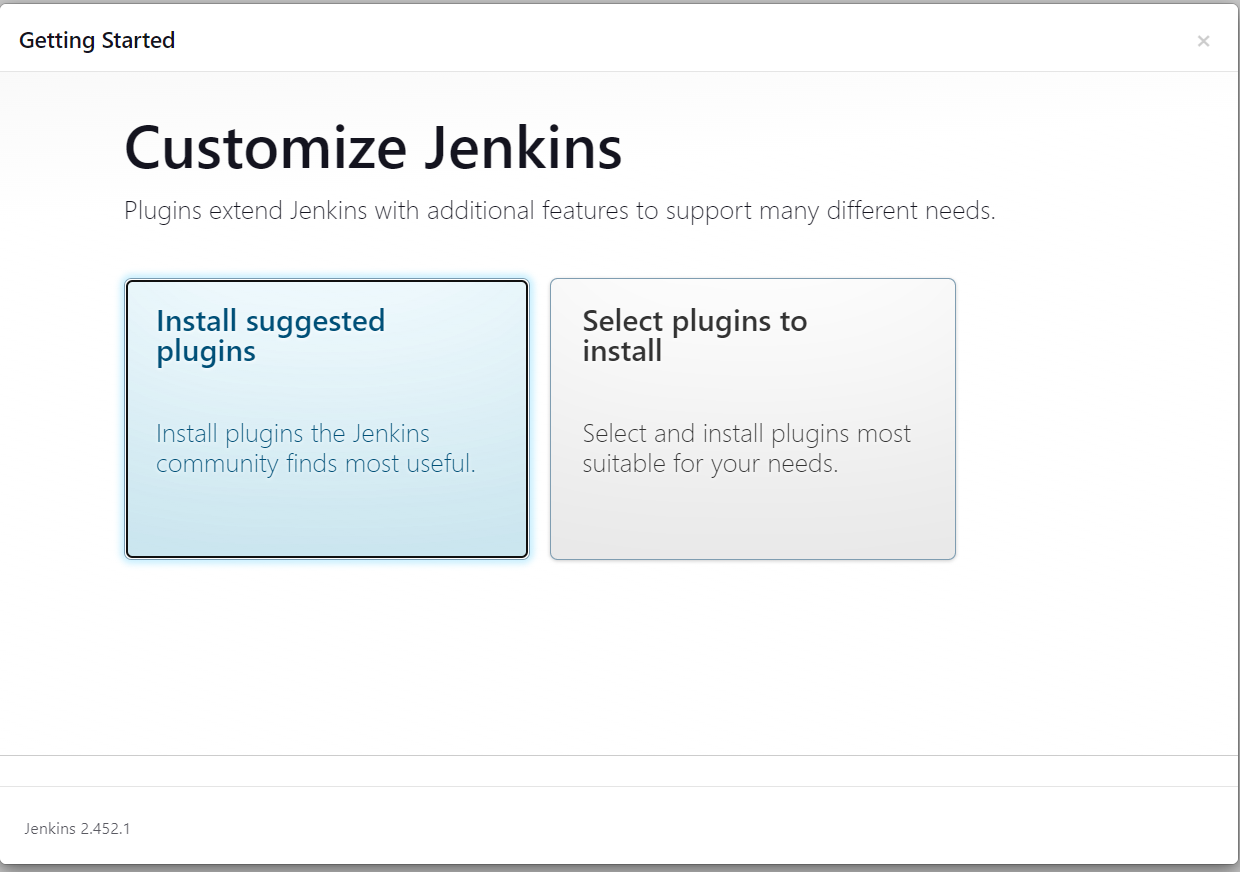
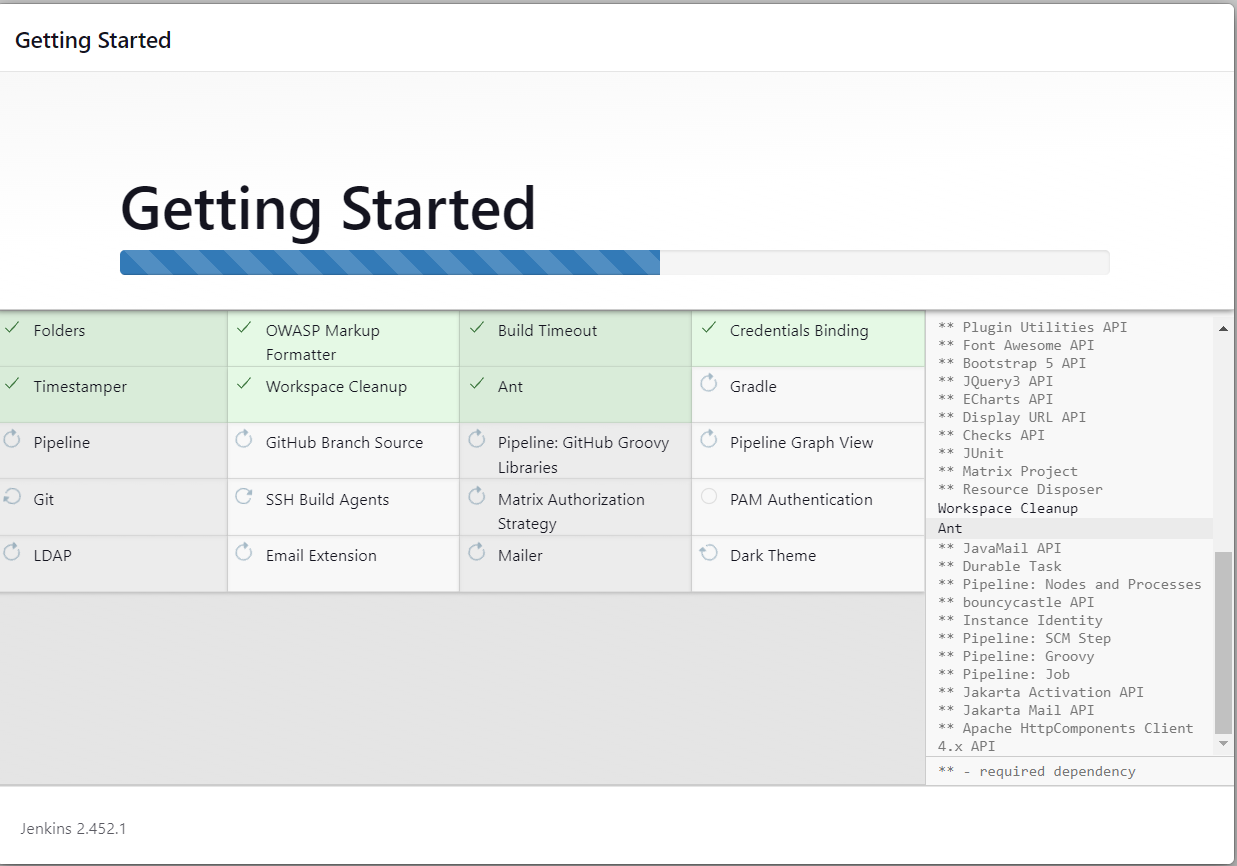
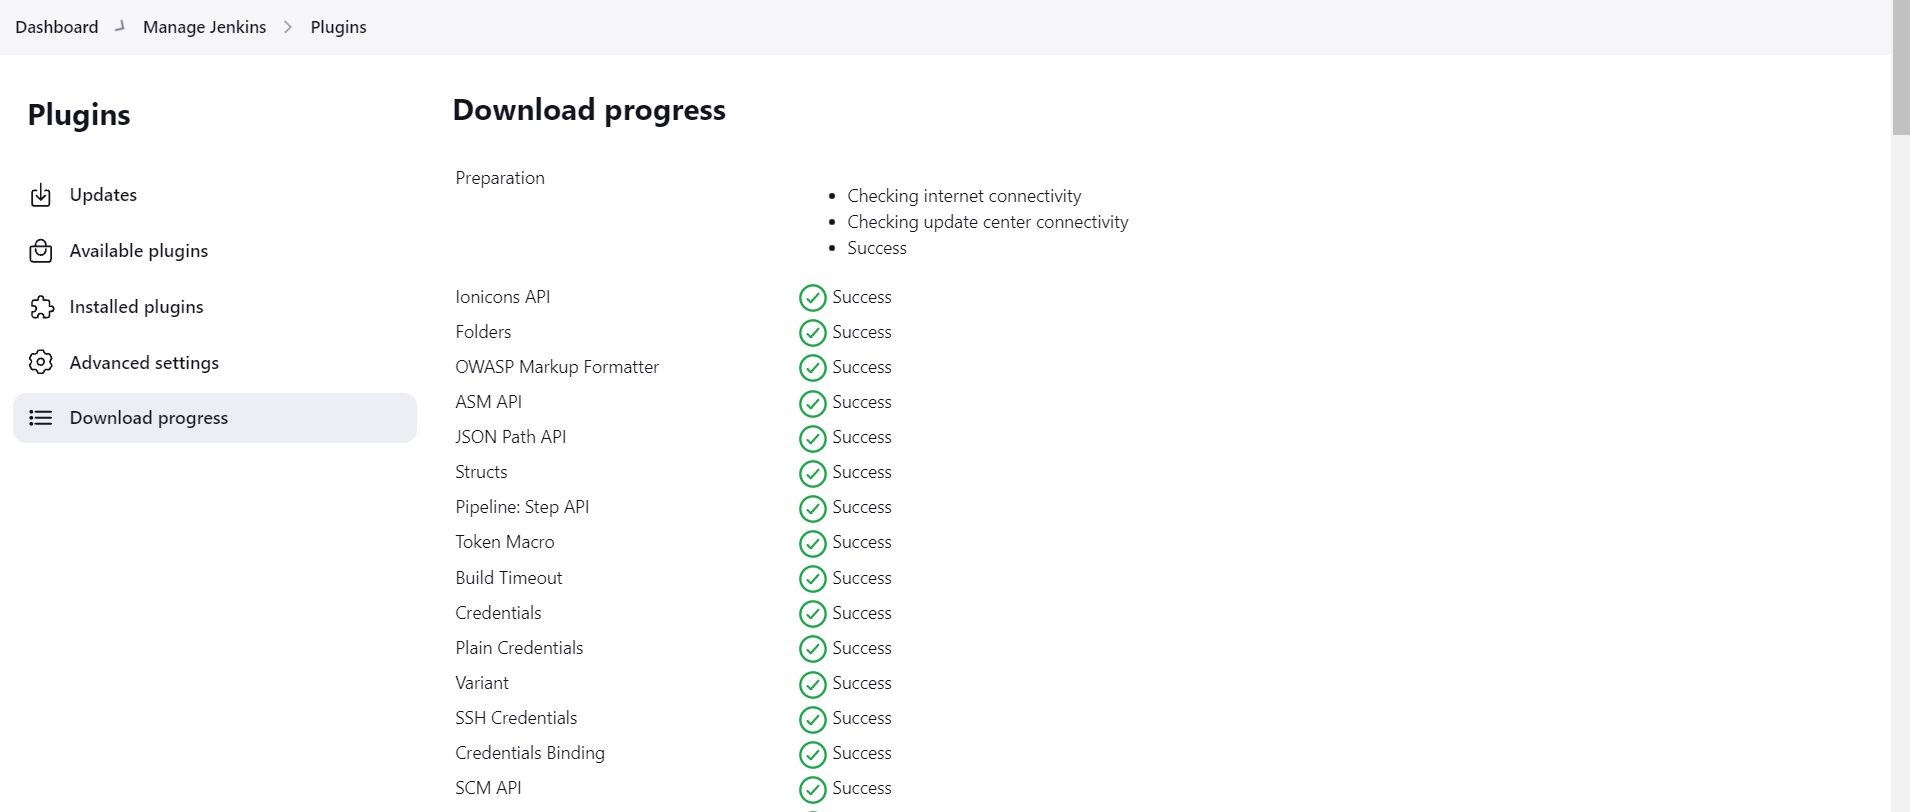
Install Suggested Plugins:
- Follow the prompts to install the suggested plugins. Jenkins will install the default set of plugins necessary for most CI/CD tasks.
- Follow the prompts to install the suggested plugins. Jenkins will install the default set of plugins necessary for most CI/CD tasks.
-
Create Admin User:
- After the plugins are installed, you will be prompted to create an admin user. Fill in the required details and save.
-
Configure Jenkins URL:
- Set the Jenkins URL to http://:8080 when prompted.
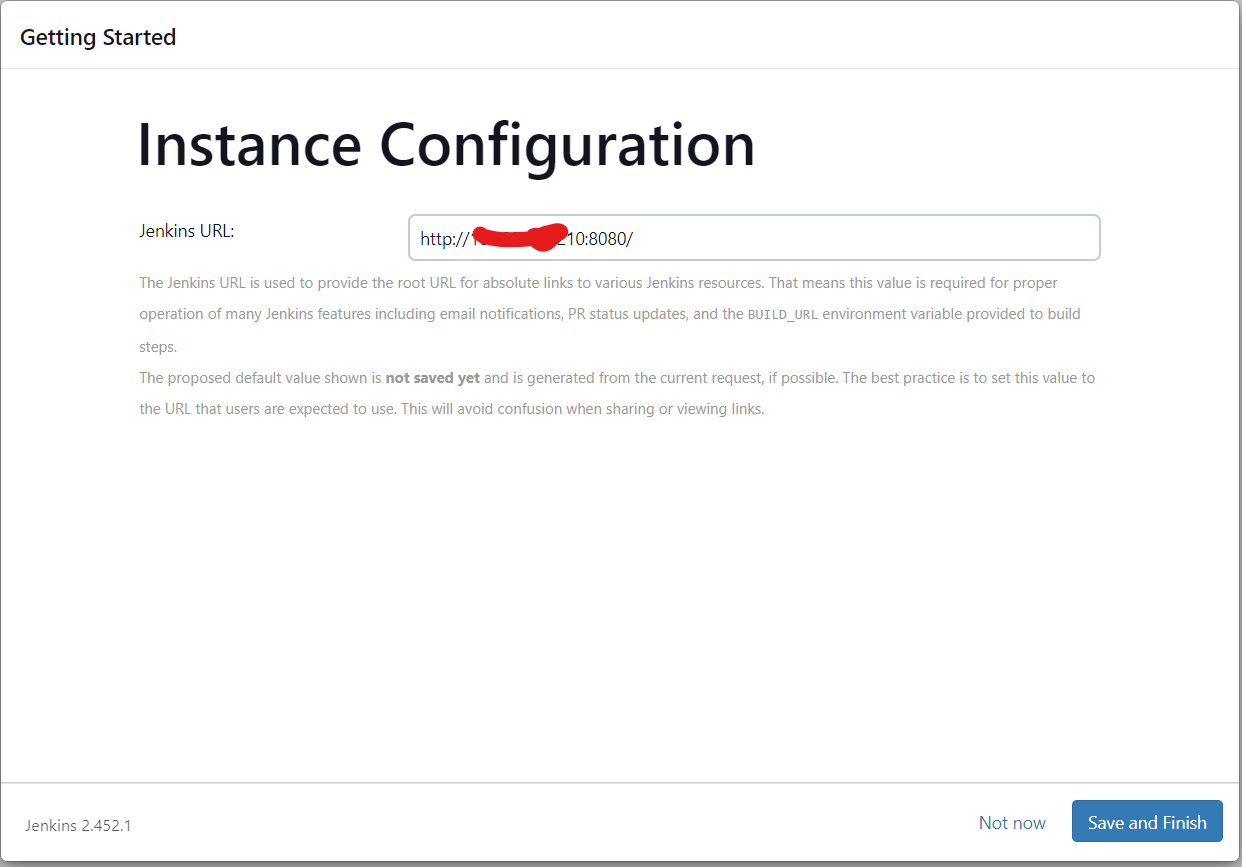
- Set the Jenkins URL to http://:8080 when prompted.


-
Manage Jenkins:
- Go to
Manage Jenkins>Manage Plugins.
- Go to
-
Available Tab:
- Search for and install the following plugins:
- Git Plugin
- Maven Integration Plugin
- Terraform Plugin
- Ansible Plugin
- SonarQube Scanner Plugin
- Checkmarx Plugin
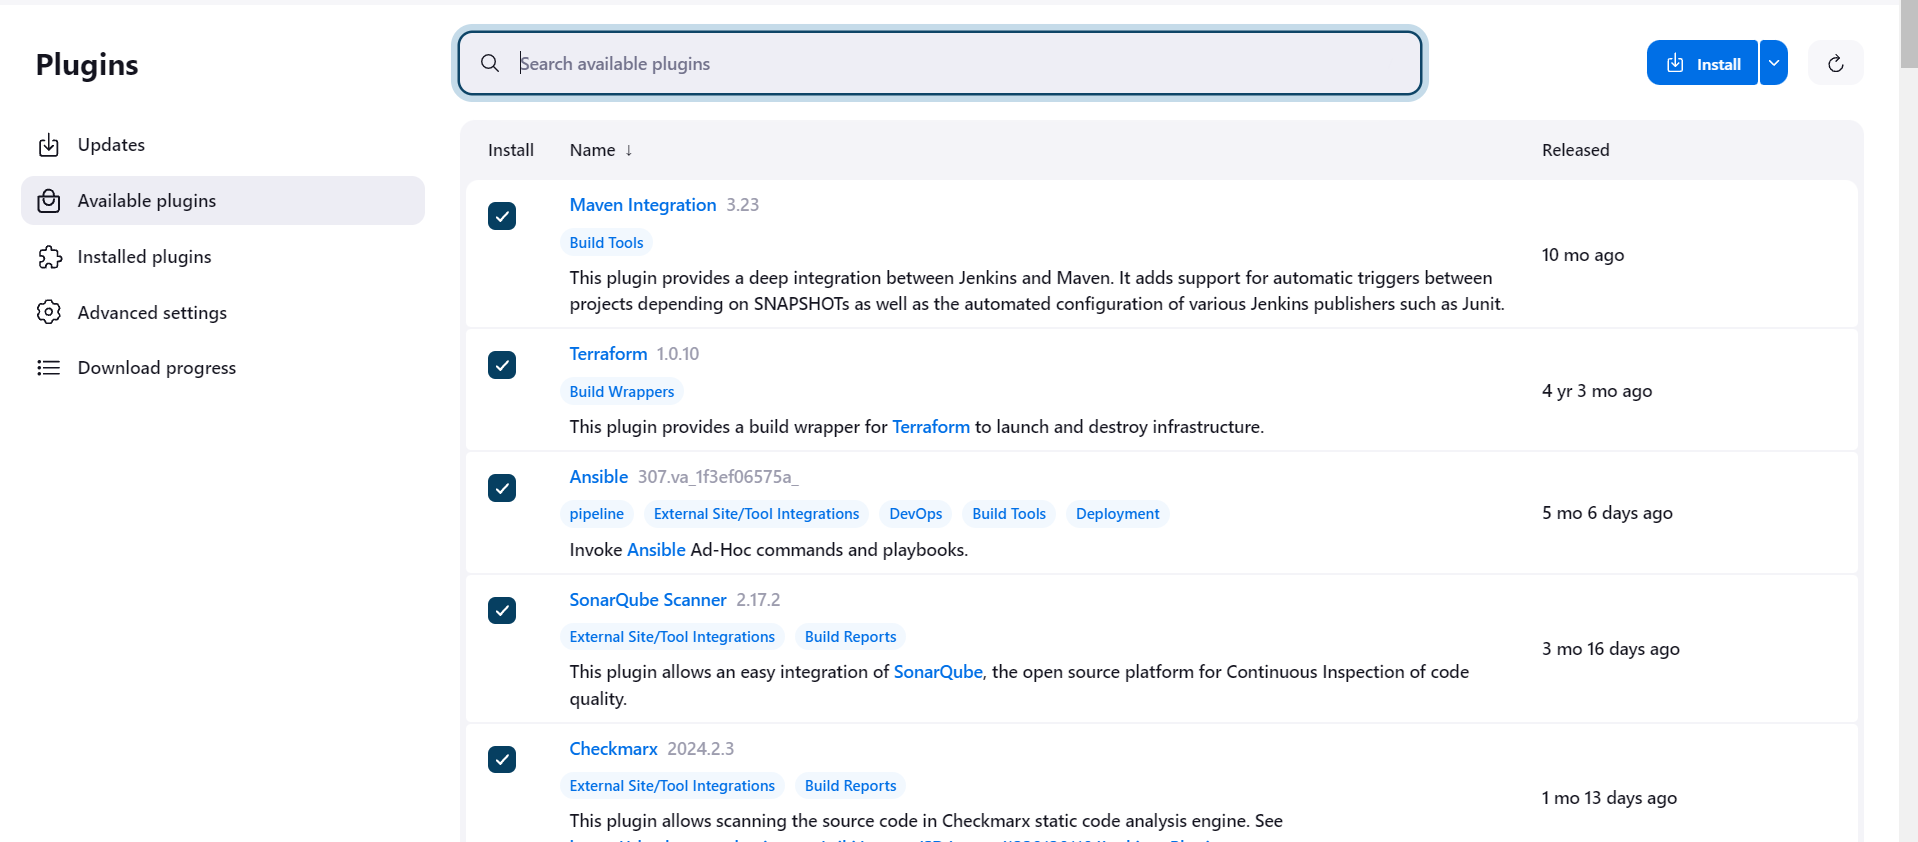
- Search for and install the following plugins:


-
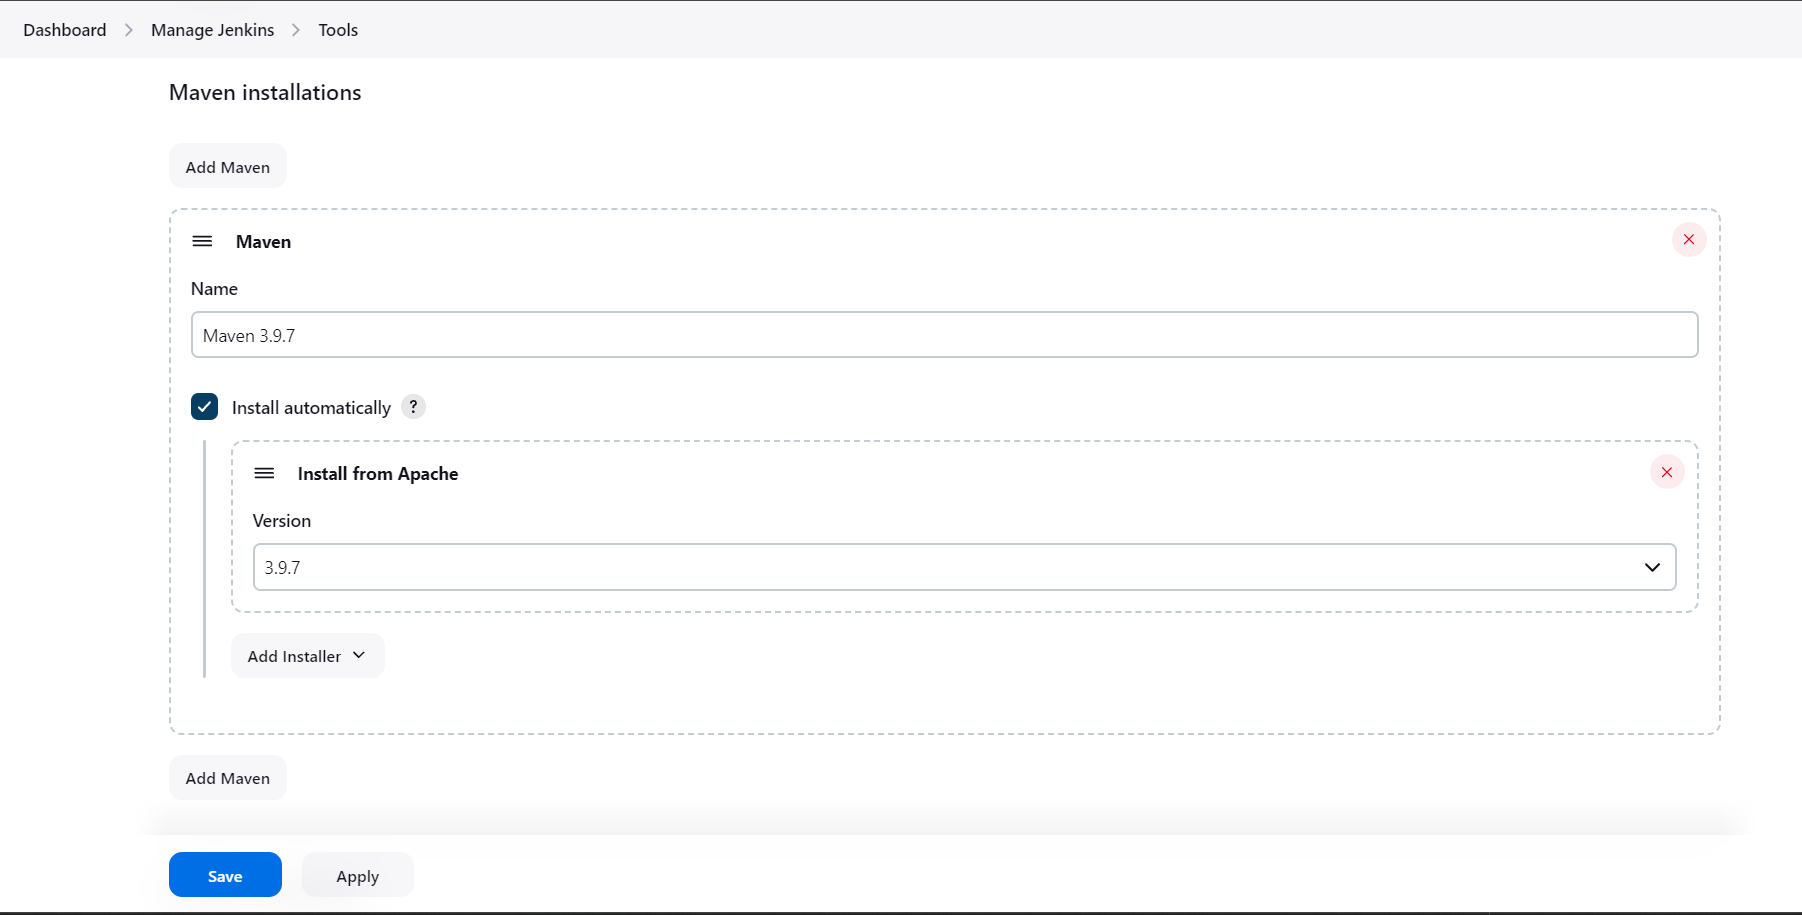
Maven Integration Plugin:
- Go to Manage Jenkins > Tools.
- Under Maven, click Add Maven.
- Provide a name (e.g., Maven 3.6.3) and specify the Maven installation method (automatic installation from Apache).
-
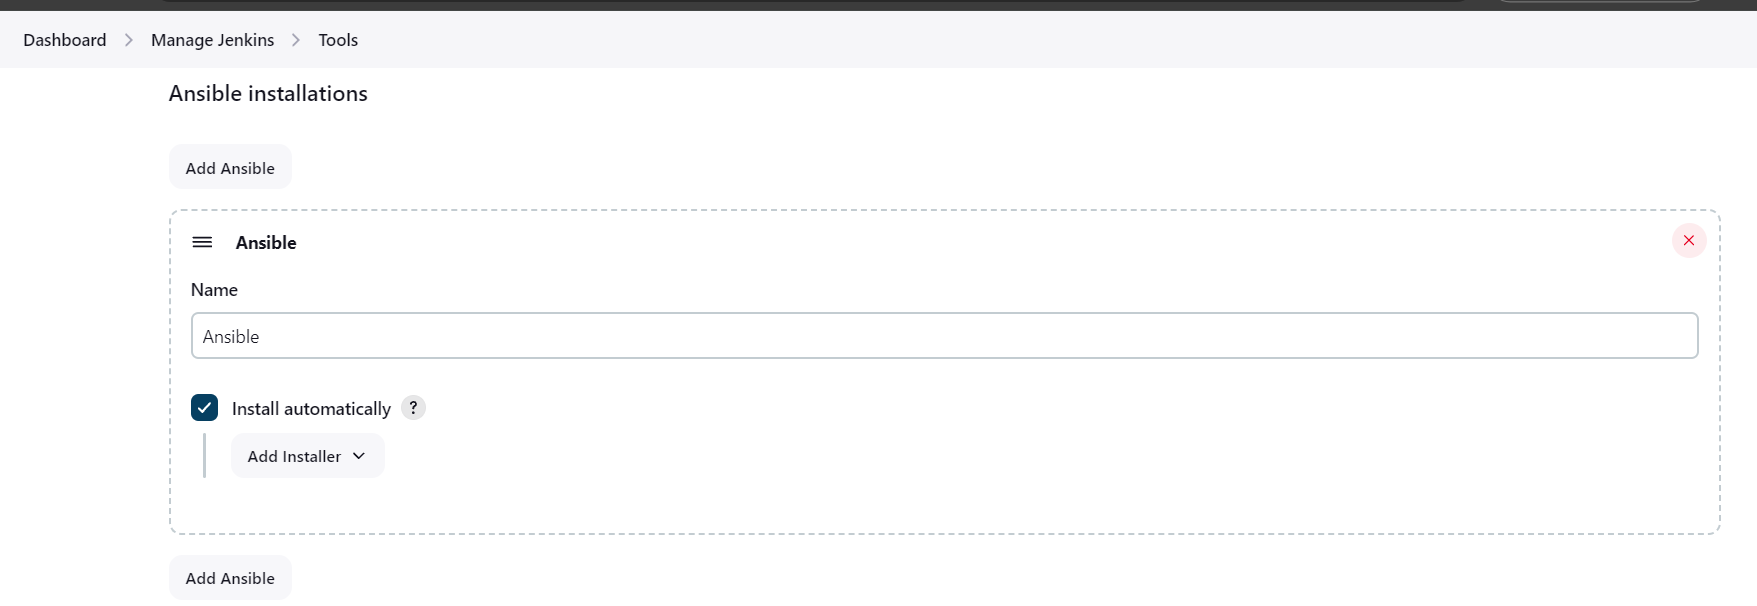
Ansible Plugin:
- Go to Manage Jenkins > Tools.
- Under Ansible, click Add Ansible.
- Provide a name (e.g., Ansible 2.9.10) and specify the Ansible installation method (automatic installation from Ansible Galaxy).
-
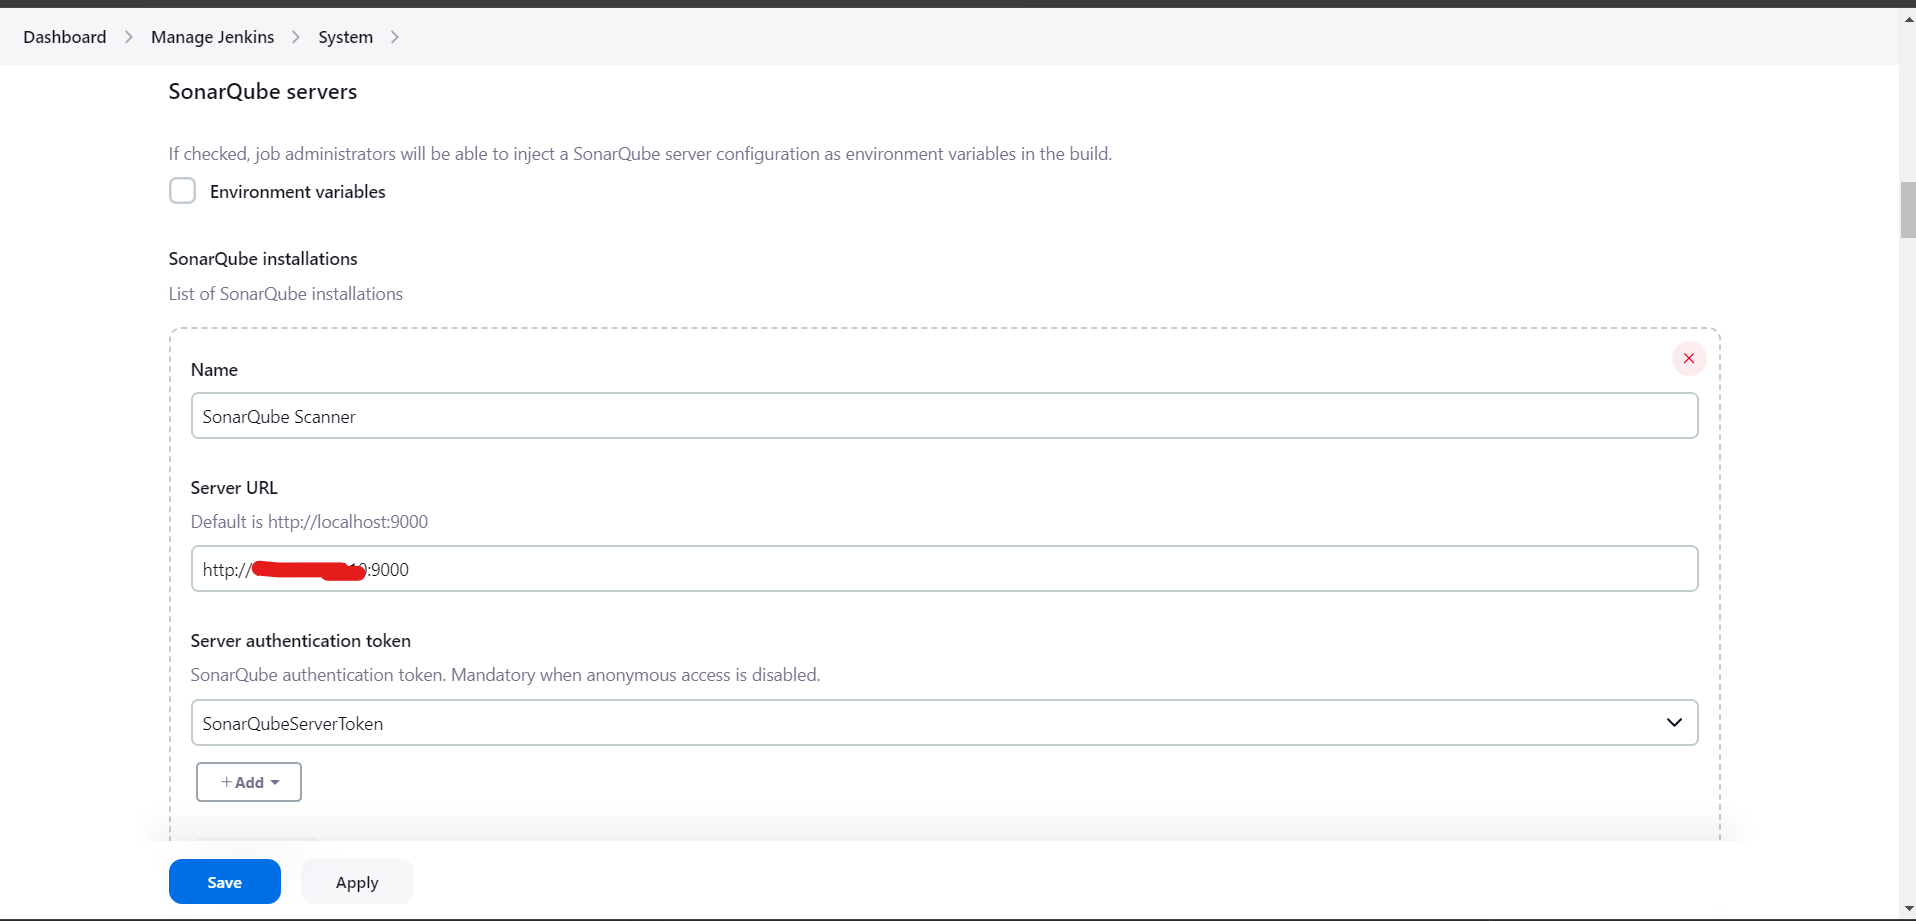
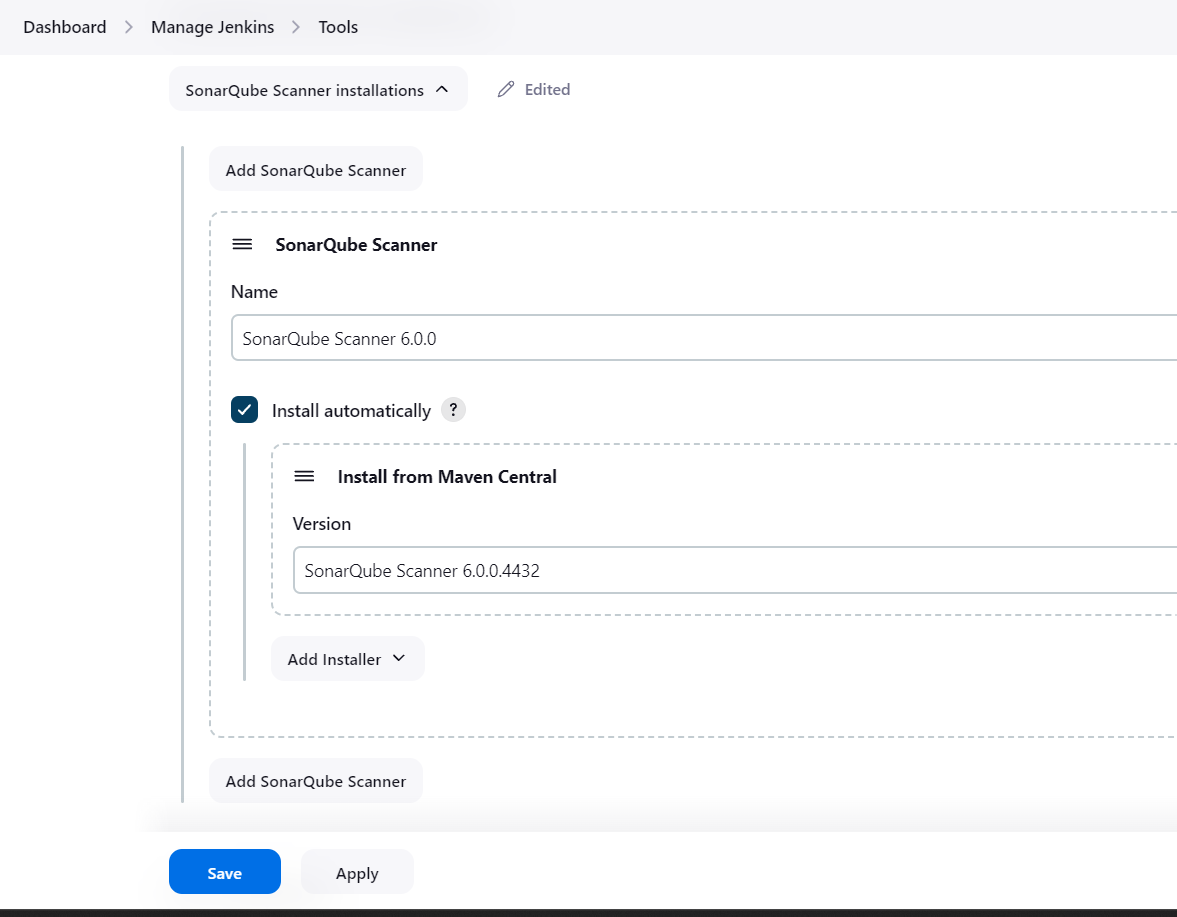
SonarQube Scanner Plugin:
- Go to Manage Jenkins > System.
- Under SonarQube servers, add a new SonarQube server.
- Provide a name (e.g., SonarQube), the server URL (e.g.,
http://<your-sonarqube-server-ip>:9000), and an authentication token. - Save the configuration.
-
Checkmarx Plugin:
- Go to Manage Jenkins > System.
- Under Checkmarx, add a new Checkmarx server configuration.
- Provide the necessary Checkmarx server details and credentials.
- Save the configuration.


-
Create a New Pipeline Job:
- Go to the Jenkins dashboard.
- Click on New Item.
- Enter an item name (e.g., CI/CD Pipeline).
- Select Pipeline and click OK.
-
Configure the Pipeline:
- In the Pipeline configuration, scroll down to the Pipeline section.
- Set the Definition to Pipeline script from SCM.
- Set SCM to Git.
- Provide the repository URL (e.g., https://github.com/ogeeDeveloper/TestProject_CICD.git).
- Set the Script Path to Jenkinsfile.
pipeline {
    agent any
    environment {
        MAVEN_PROJECT_DIR = 'java-tomcat-sample'
        TERRAFORM_DIR = 'terraform'
        ANSIBLE_PLAYBOOK = 'deploy.yml'
        SONAR_TOKEN = credentials('SonarQubeServerToken')
        TERRAFORM_BIN = '/usr/local/bin/terraform'
        ANSIBLE_NAME = 'Ansible'
        ANSIBLE_HOST_KEY_CHECKING = 'False'
    }
    stages {
        stage('Verify Environment') {
            steps {
                sh 'echo $PATH'
                sh 'terraform --version'
            }
        }
        stage('Cleanup') {
            steps {
                deleteDir()
            }
        }
        stage('Checkout SCM') {
            steps {
                git branch: 'dev', url: 'https://github.com/ogeeDeveloper/TestProject_CICD.git'
            }
        }
        stage('Build') {
            steps {
                dir("${MAVEN_PROJECT_DIR}") {
                    script {
                        def mvnHome = tool name: 'Maven 3.9.7', type: 'maven'
                        sh "${mvnHome}/bin/mvn clean package"
                    }
                }
            }
        }
        stage('SonarQube Analysis') {
            steps {
                withSonarQubeEnv('SonarQube') {
                    dir("${MAVEN_PROJECT_DIR}") {
                        script {
                            def scannerHome = tool name: 'SonarQubeScanner', type: 'hudson.plugins.sonar.SonarRunnerInstallation'
                            sh """
                                ${scannerHome}/bin/sonar-scanner \
                                -Dsonar.projectKey=TestProjectCiCd \
                                -Dsonar.projectName=TestProject_CICD \
                                -Dsonar.projectVersion=1.0 \
                                -Dsonar.sources=src \
                                -Dsonar.java.binaries=target/classes \
                                -Dsonar.host.url=http://164.90.138.210:9000 \
                                -Dsonar.login=${SONAR_TOKEN}
                            """
                        }
                    }
                }
            }
        }
        stage('Infrastructure Provisioning') {
            steps {
                dir("${TERRAFORM_DIR}") {
                    withCredentials([
                        string(credentialsId: 'do_token', variable: 'DO_TOKEN'),
                        string(credentialsId: 'ssh_key_id', variable: 'SSH_KEY_ID'),
                        sshUserPrivateKey(credentialsId: 'ssh_private_key', keyFileVariable: 'SSH_PRIVATE_KEY_PATH', usernameVariable: 'SSH_USER'),
                        string(credentialsId: 'ssh_public_key', variable: 'SSH_PUBLIC_KEY')
                    ]) {
                        script {
                            // Initialize Terraform
                            sh "${TERRAFORM_BIN} init"

                            // Plan Terraform changes
                            sh "${TERRAFORM_BIN} plan -var 'do_token=${DO_TOKEN}' -var 'ssh_key_id=${SSH_KEY_ID}' -var 'ssh_private_key=${SSH_PRIVATE_KEY_PATH}' -var 'ssh_public_key=${SSH_PUBLIC_KEY}'"

                            // Apply Terraform changes
                            sh "${TERRAFORM_BIN} apply -auto-approve -var 'do_token=${DO_TOKEN}' -var 'ssh_key_id=${SSH_KEY_ID}' -var 'ssh_private_key=${SSH_PRIVATE_KEY_PATH}' -var 'ssh_public_key=${SSH_PUBLIC_KEY}'"

                            // Capture Terraform output
                            def output = sh(script: "${TERRAFORM_BIN} output -json", returnStdout: true).trim()
                            def jsonOutput = readJSON text: output
                            env.SERVER_IP = jsonOutput.app_server_ip.value
                        }
                    }
                }
            }
        }
        stage('Deploy Application') {
            steps {
                withCredentials([
                    string(credentialsId: 'ansible_password', variable: 'ANSIBLE_PASSWORD'),
                    sshUserPrivateKey(credentialsId: 'ssh_private_key', keyFileVariable: 'SSH_KEY_FILE', passphraseVariable: '', usernameVariable: 'ANSIBLE_USER')
                ]) {
                    script {
                        def ansibleHome = tool name: "${ANSIBLE_NAME}"
                        sh "export PATH=${ansibleHome}/bin:\$PATH"
                        sh "echo 'Ansible Home: ${ansibleHome}'"
                        sh "echo '[app_servers]\n${SERVER_IP}' > dynamic_inventory.ini"
                        sh "${ansibleHome}/bin/ansible-playbook ${ANSIBLE_PLAYBOOK} -i dynamic_inventory.ini -e ansible_user=${ANSIBLE_USER} -e ansible_password=${ANSIBLE_PASSWORD} -e server_ip=${SERVER_IP} -e workspace=${WORKSPACE}"
                    }
                }
            }
        }
    }
    post {
        always {
            // junit '**/target/surefire-reports/*.xml'
            script {
                if (currentBuild.currentResult == 'SUCCESS') {
                    echo 'Build succeeded!'
                } else {
                    echo 'Build failed. Please check Jenkins for details.'
                }
            }
        }
    }
}
Explanation:
- This is the Jenkins pipeline script that defines the CI/CD process. It includes stages for cleaning up the workspace, checking out the source code, building the application, performing SonarQube analysis, provisioning infrastructure with Terraform, and deploying the application using Ansible.
This file can be found in the Jenkins_Output.txt
Time it takes to provision the deployment server with terraform
