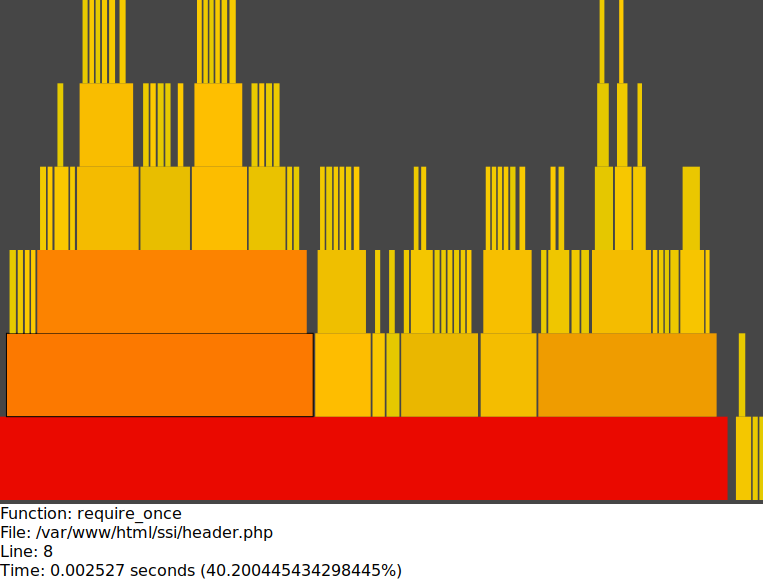
A lightweight Xdebug trace file visualizer that helps you to uncover performance issues and gain insight into your code.
The actual code is in the gh-pages branch.
Make sure you have this set in your php.ini/xdebug.ini:
xdebug.trace_format = 1
I also recommend setting xdebug.trace_enable_trigger = 1, so that you can create bookmarklets for enabling/disabling the tracer.
Open Xdebug-Trace-Visualizer in your browser and drag an xdebug trace file into the window. The files can be found in the folder defined in xdebug.trace_output_dir (defaults to /tmp).
Xdebug Trace Visualizer is freely distributable under the terms of the MIT license.
Copyright (c) 2012 Chris Akers
Permission is hereby granted, free of charge, to any person obtaining a copy of this software and associated documentation files (the "Software"), to deal in the Software without restriction, including without limitation the rights to use, copy, modify, merge, publish, distribute, sublicense, and/or sell copies of the Software, and to permit persons to whom the Software is furnished to do so, subject to the following conditions:
The above copyright notice and this permission notice shall be included in all copies or substantial portions of the Software.
THE SOFTWARE IS PROVIDED "AS IS", WITHOUT WARRANTY OF ANY KIND, EXPRESS OR IMPLIED, INCLUDING BUT NOT LIMITED TO THE WARRANTIES OF MERCHANTABILITY, FITNESS FOR A PARTICULAR PURPOSE AND NONINFRINGEMENT. IN NO EVENT SHALL THE AUTHORS OR COPYRIGHT HOLDERS BE LIABLE FOR ANY CLAIM, DAMAGES OR OTHER LIABILITY, WHETHER IN AN ACTION OF CONTRACT, TORT OR OTHERWISE, ARISING FROM, OUT OF OR IN CONNECTION WITH THE SOFTWARE OR THE USE OR OTHER DEALINGS IN THE SOFTWARE.
