Biodiversity-maps
Project description
The project has three phases:
-
Biodiversity maps for the general use of the biodiversity community using data provided by the University of Birmingham. This will show "biodiversity hotspots" – areas of greatest interest to the researchers and conservationists.
-
Similar maps for specific demonstration cases in various regions of Europe.
-
A very exciting project related to anticipating the impact of climate change on various species. This will inform preservation efforts to ensure food security (crops) in a changing world as well as just protecting vulnerable wild species.
What they have: Current version of the visualisations
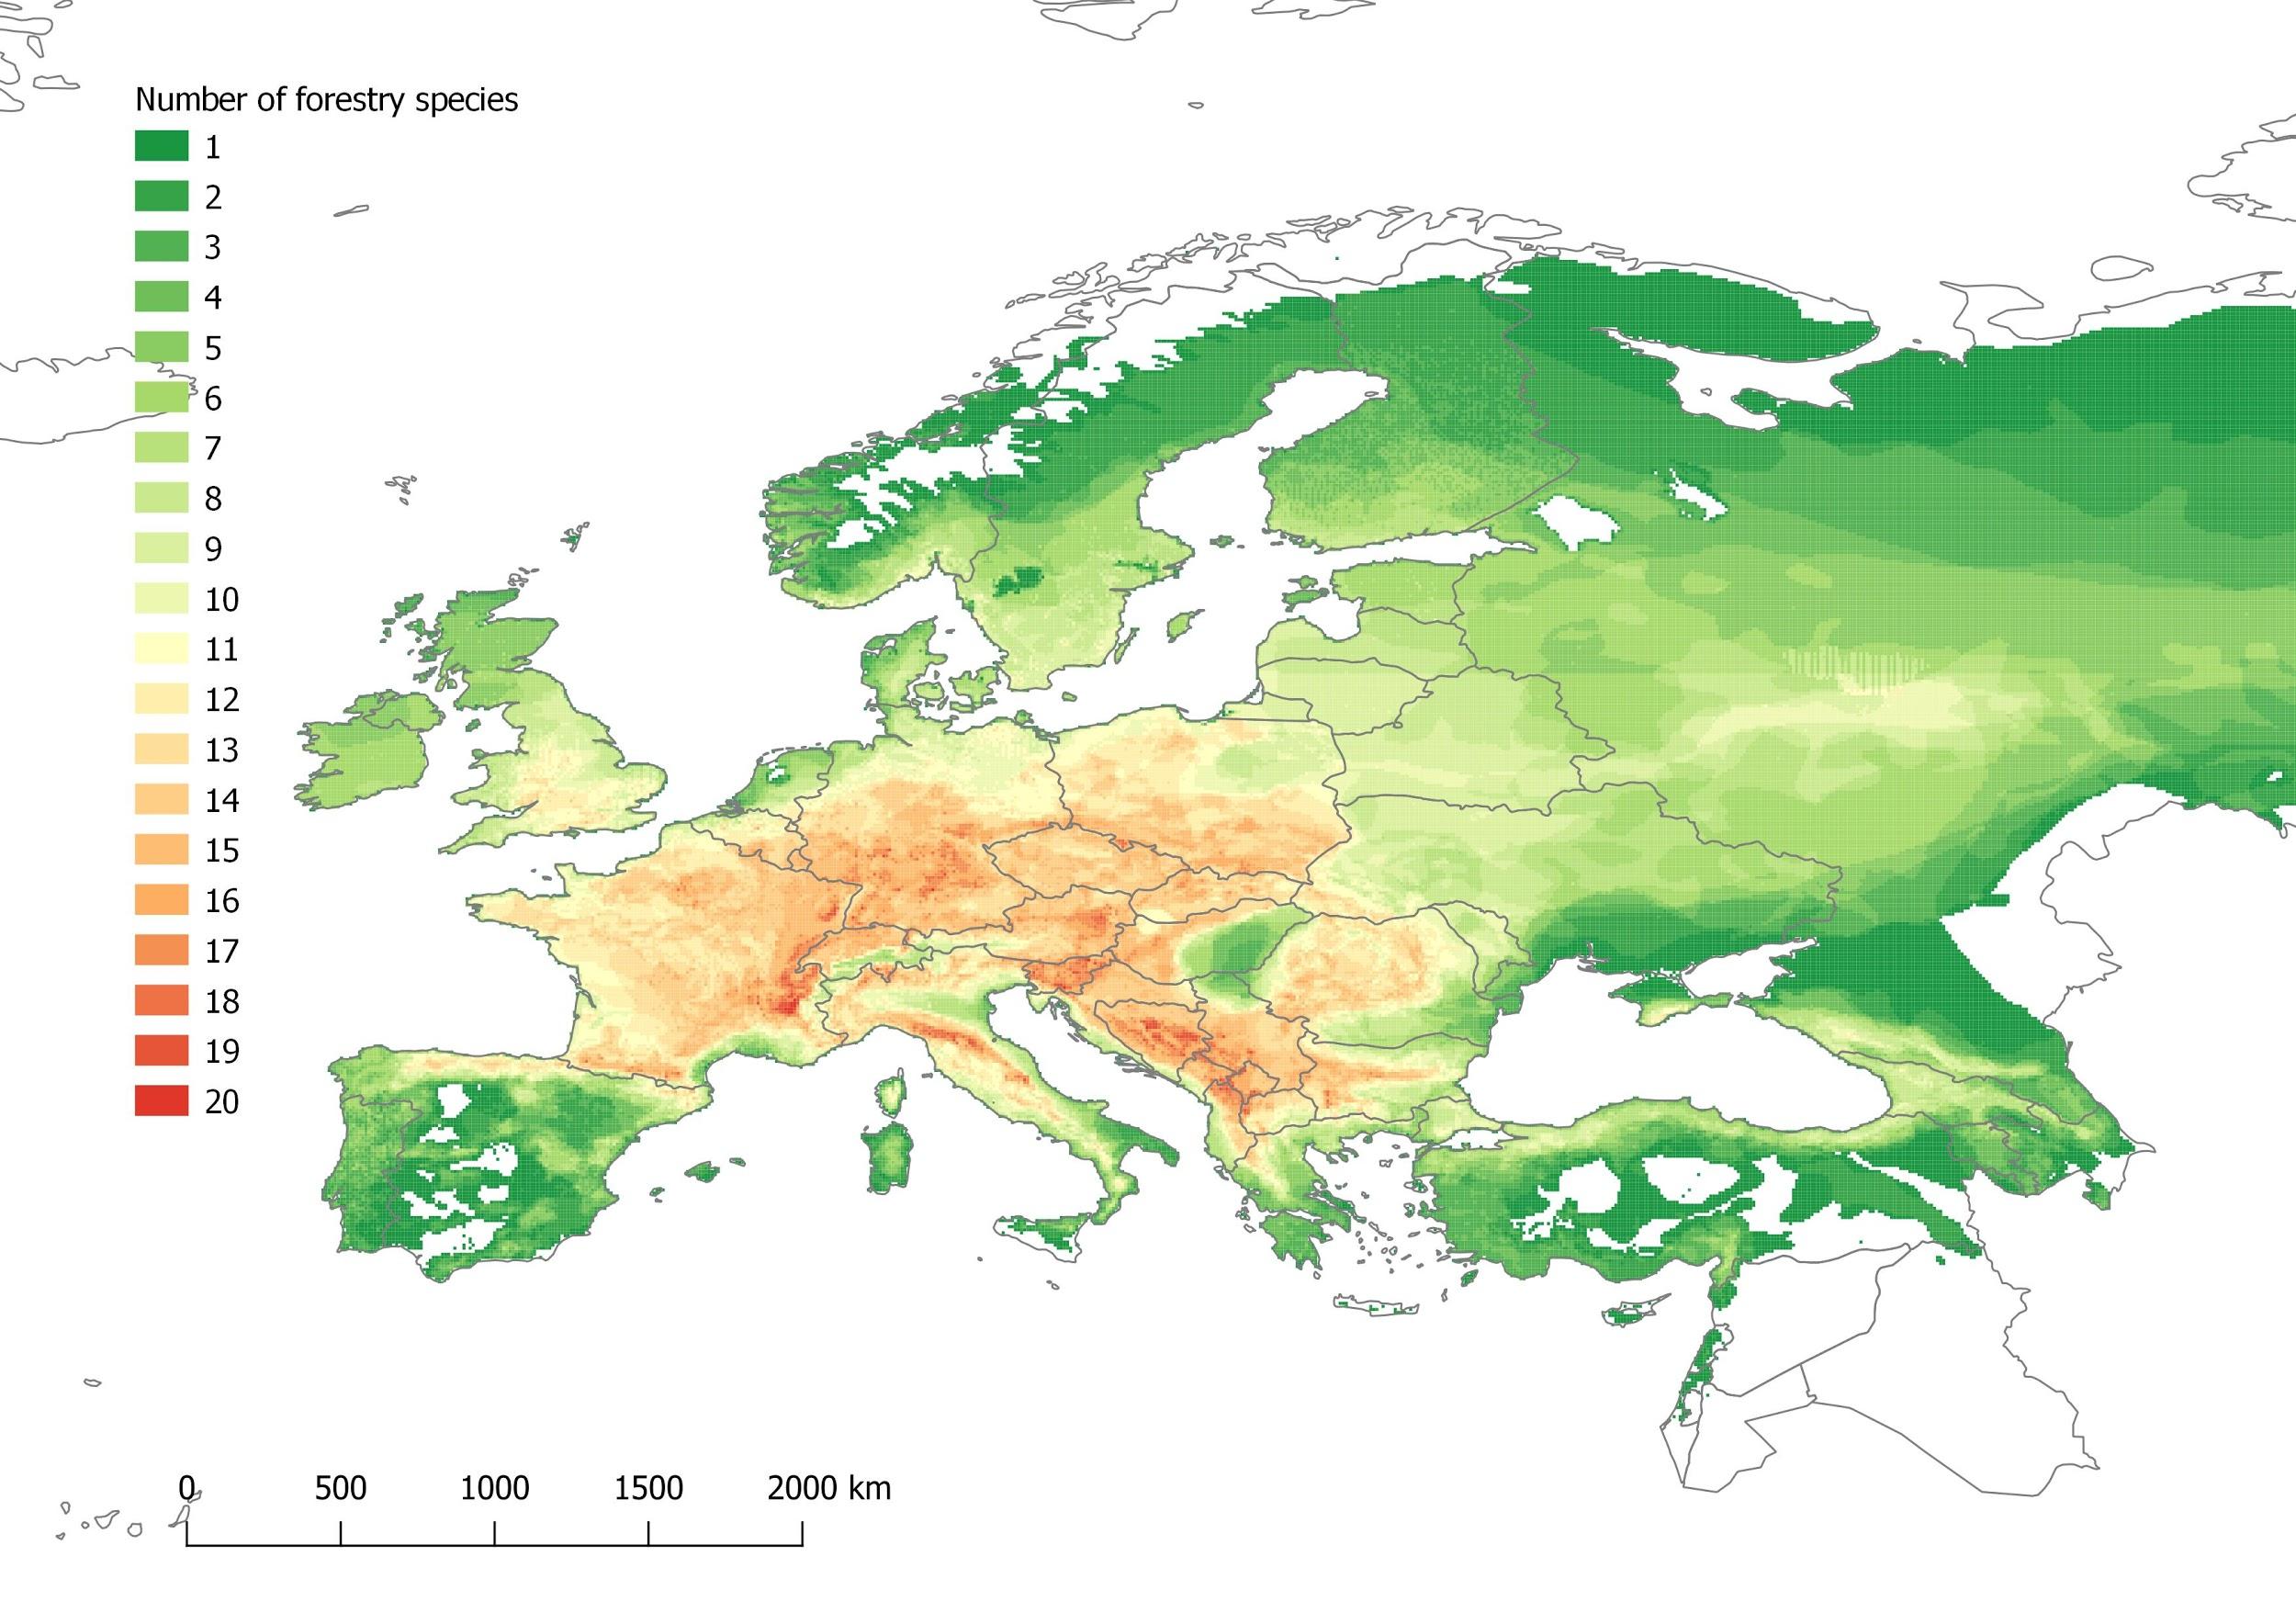
These data had been used to produce basic maps, such as the one for forest genetic resources:
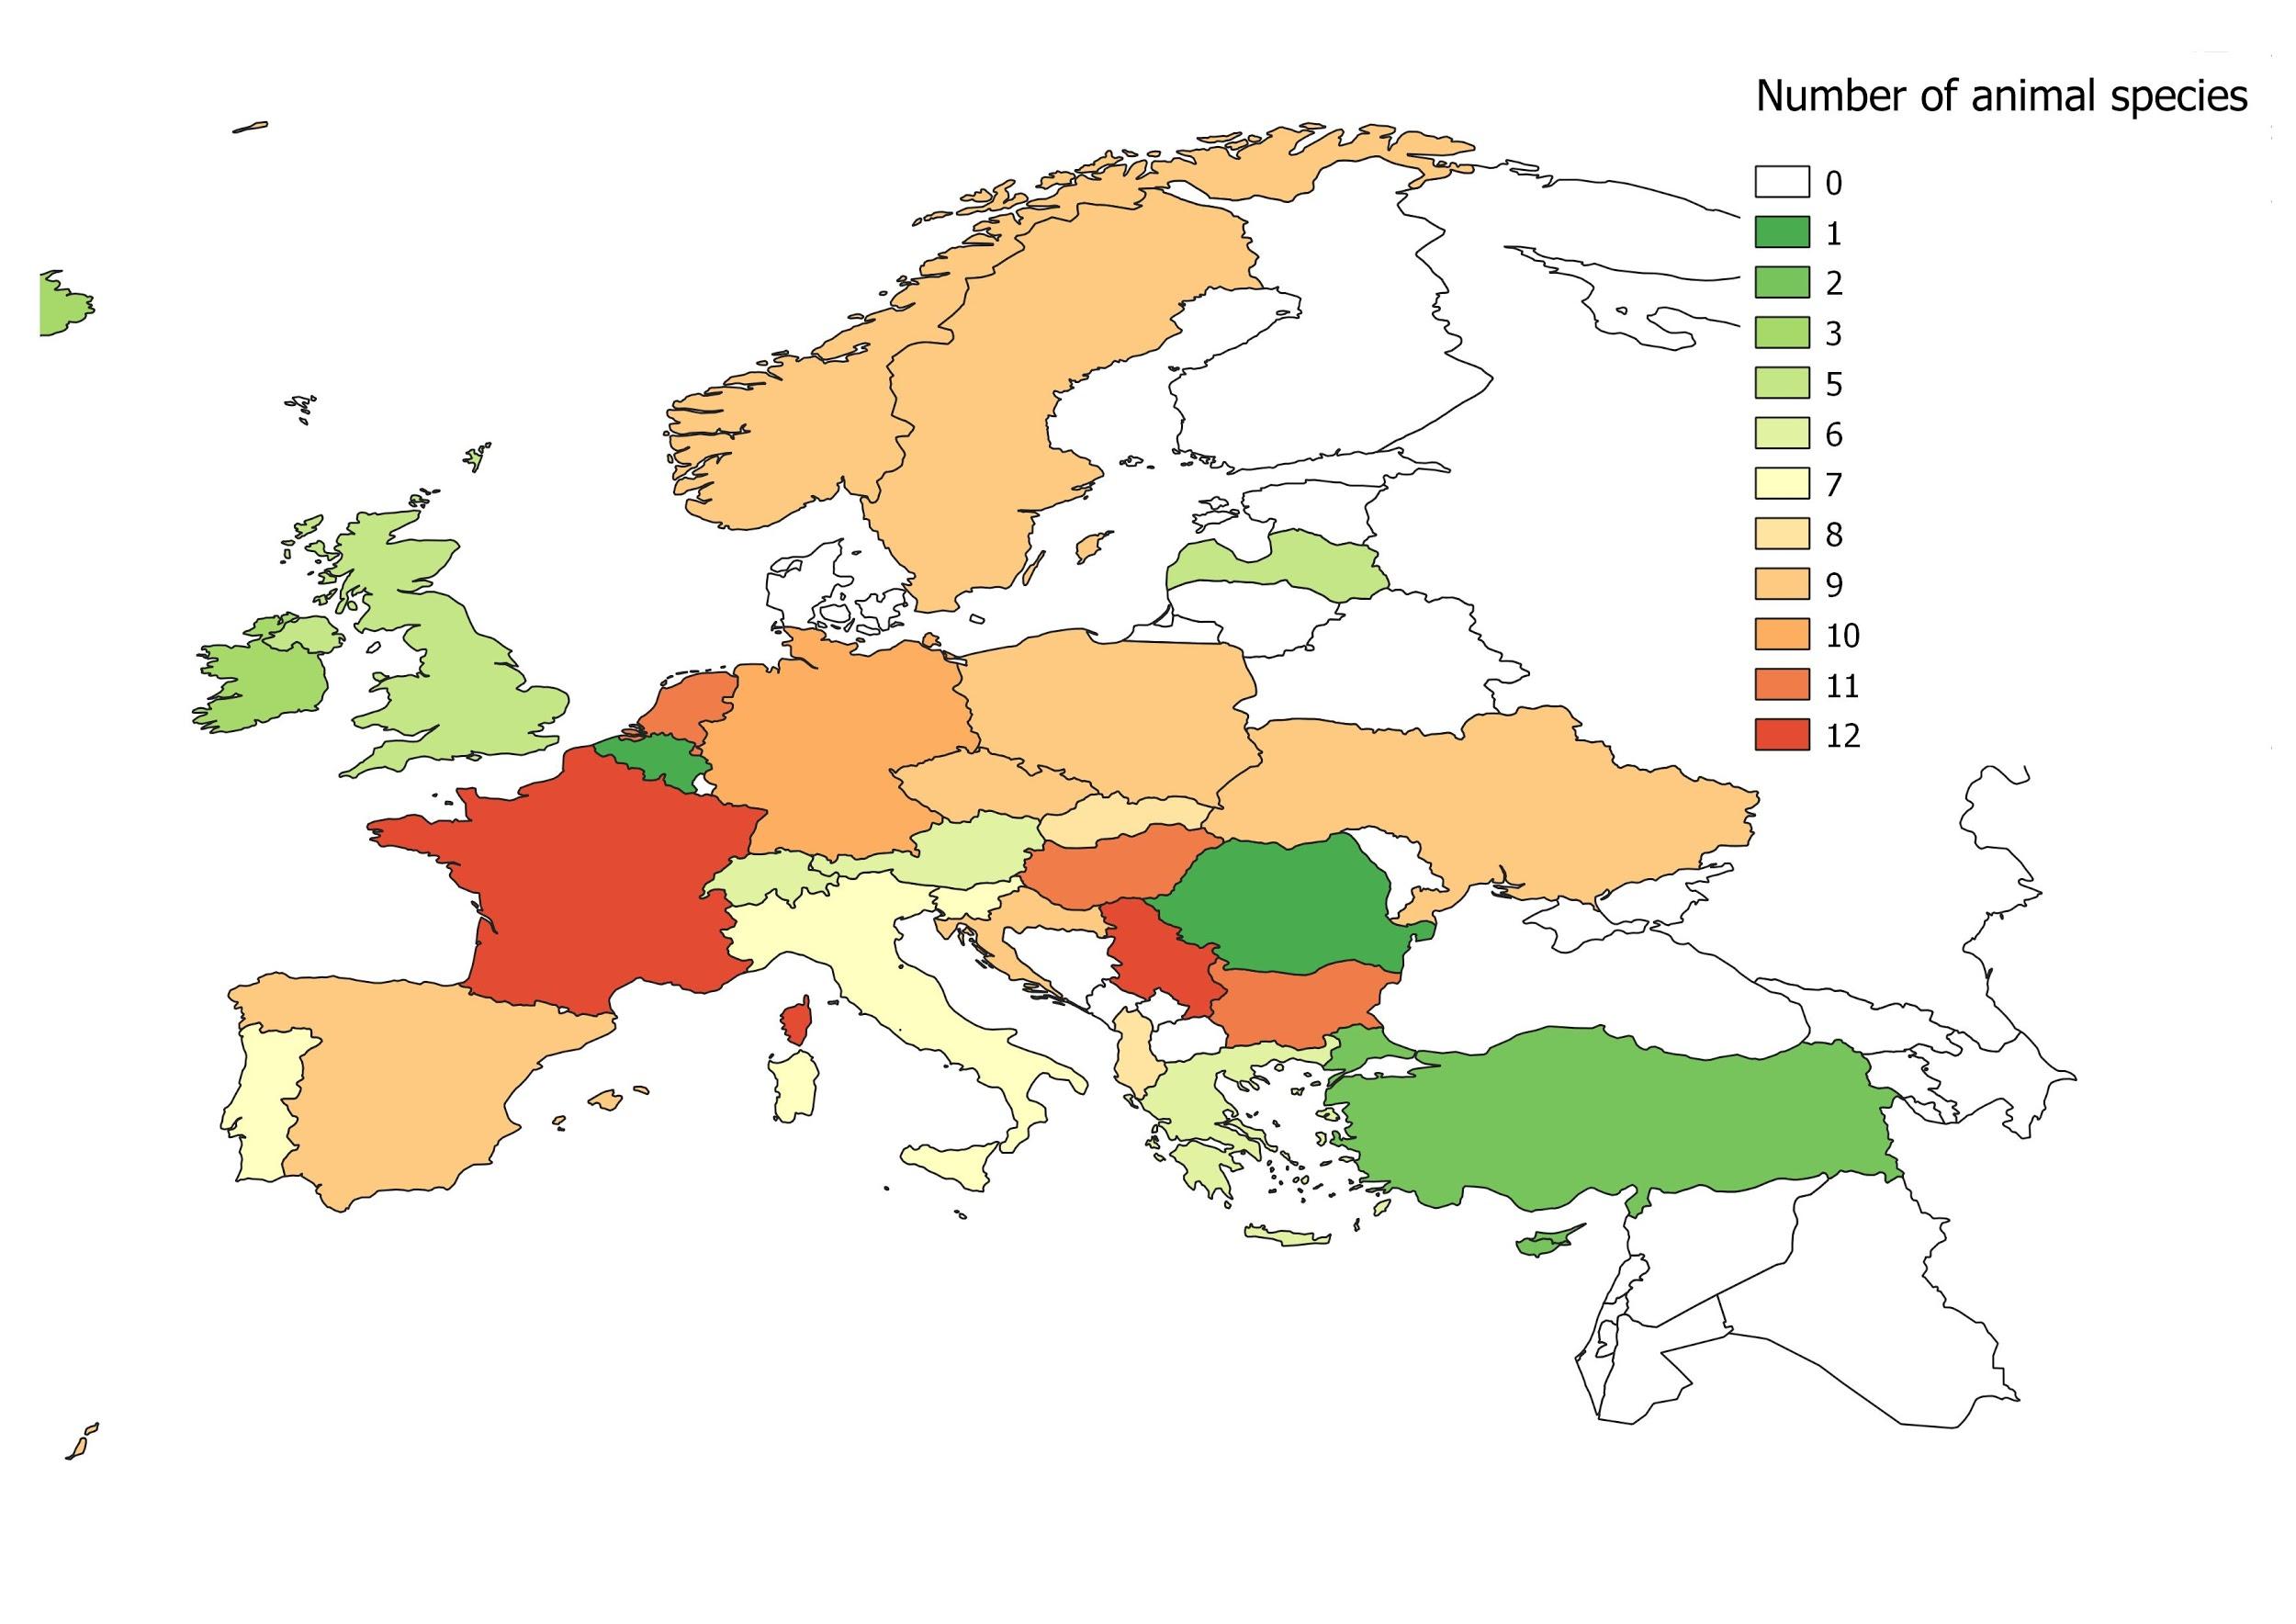
The data for animal genetic resources do not allow for creating such detailed maps. Here, we focus on the number of species/breeds in each country, such as in this sample map:
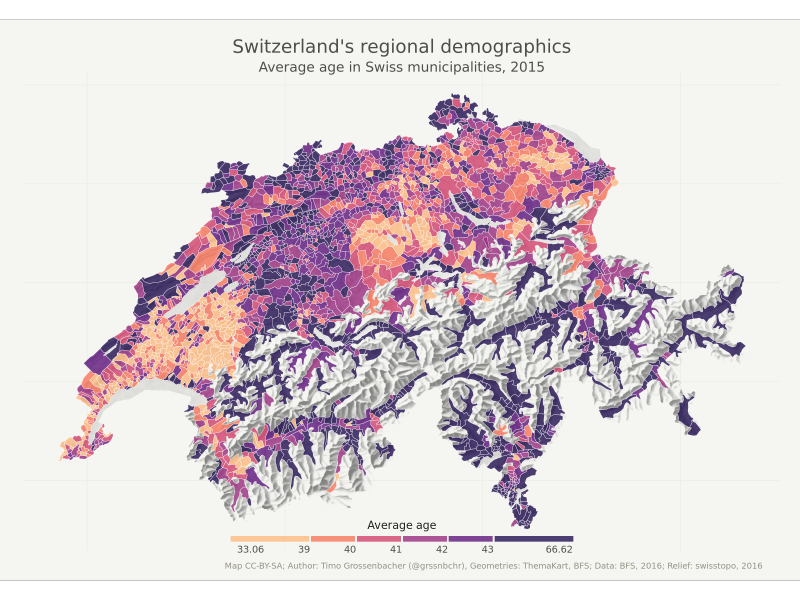
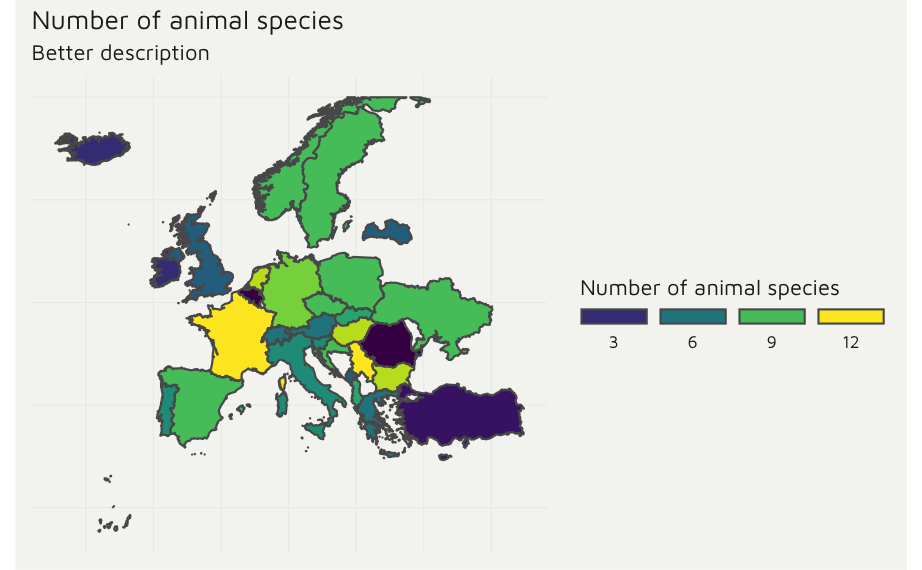
What we want to build: inspiration
What we currently have: state of work
Success criteria
For the first phase of the project we want to produce informative and visually appealing maps. We aim to deliver:
- A print-ready version (which can be turned into a poster)
- An interactive map – hovering over a given region should provide more detailed information about the particular species occuring there
We are not creating any animations at this stage, because we do not have access to historical data (it appears such data doesn't really exist anyway or at least has not yet been collated by the biodiversity community).
Specifically we need to create 7 maps for the three domains (forests, plants and animals):
- Visualise species richness for each domain separately (3 maps)
- Visualise species richness at common data level* for each domain separately (*common data level = number of species within a country) (2 maps as we only have country level data for animals)
- Visualise species richness at common data level on ONE map for all domains
- Visualise species richness at common data level on ONE map for all domains AND showing total species richness (all domains together) for each country
NOTE: We should not include precise coordinates of where the species are found.
Data
The data folder linked-up below contains data for plant, animal and forest genetic resources organized in three folders.
The file names and corresponding content are as follows:
-
AnGR_FAO_Jan2020.csv – animal genetic resources data
-
forestry_jan2020_clean2.csv – forest genetic resources data
-
all_pgr.csv – plant genetic resources data


