Built-in metrics for Puma web server monitoring out of the box! Part of the yabeda suite.
Works as the Puma plugin and provides following metrics:
puma_workers- the number of running puma workerspuma_booted_workers- the number of booted puma workerspuma_old_workers- the number of old puma worker
Segmented by the worker (index of the worker):
puma_pool_capacity- the capacity of each worker: the number of requests that the server is capable of taking right now. More details are here.puma_running- the number of running threads (spawned threads) for any puma workerpuma_max_threads- preconfigured maximum number of worker threadspuma_backlog- the number of backlog threads, the number of connections in that worker's "todo" set waiting for a worker thread.
Add this line to your application's Gemfile:
gem 'yabeda-puma-plugin'And then execute:
$ bundle
Add those 2 lines of code to your config/puma.rb file:
activate_control_app
plugin :yabeda
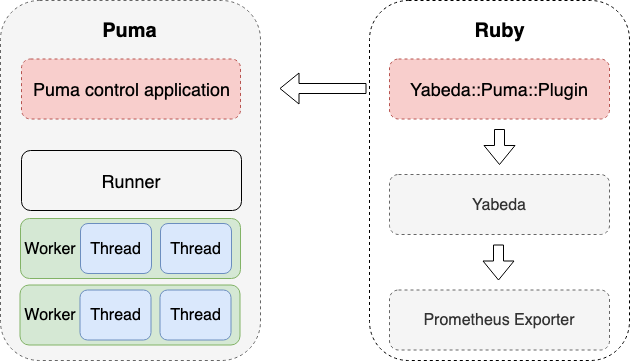
It will activate default puma control application working over the unix socket, and runs the yabeda puma plugin, for registering and collecting the metrics.
Some monitoring system agents (like NewRelic or DataDog) will send metrics automatically in the background. But for some of monitoring systems (like Prometheus) you have to explicitly set up metrics export.
For non-Rails applications place following line in your config.ru before running your application:
use Yabeda::Prometheus::Exporter, path: "/metrics"In Ruby on Rails applications you can add following line in config/routes.rb instead:
mount Yabeda::Prometheus::Exporter => "/metrics"In both cases your Puma instance metrics (along with your application metrics) will be available at /metrics endpoint.
Sometimes you don't want to expose metrics publicly for security reasons. For that case prometheus exporter plugin is bundled with this gem.
Don't forget to add either yabeda-prometheus or yabeda-prometheus-mmap gem into your Gemfile!
Add this plugin into your config/puma.rb:
plugin :yabeda_prometheusBy default metrics will be available at http://0.0.0.0:9394/metrics.
Bind host, port, and path can be controlled either by config file option prometheus_exporter_url:
# config/puma.rb
prometheus_exporter_url "tcp://127.0.0.1:9395/shmetrics"
Or by environment variables PROMETHEUS_EXPORTER_URL, PROMETHEUS_EXPORTER_BIND, PROMETHEUS_EXPORTER_PORT, and PROMETHEUS_EXPORTER_PATH (takes precedence over configuration option).
In accordance with the architecture of the puma web server lets look how it works:
For the configuration above, we will have the list of metrics (with help of yabeda-prometheus exporter):
GET /metrics

puma_backlog{index="0"} 0
puma_backlog{index="1"} 0
puma_running{index="0"} 5
puma_running{index="1"} 5
puma_pool_capacity{index="0"} 1
puma_pool_capacity{index="1"} 5
puma_max_threads{index="0"} 5
puma_max_threads{index="1"} 5
puma_workers 2
puma_booted_workers 2
puma_old_workers 0
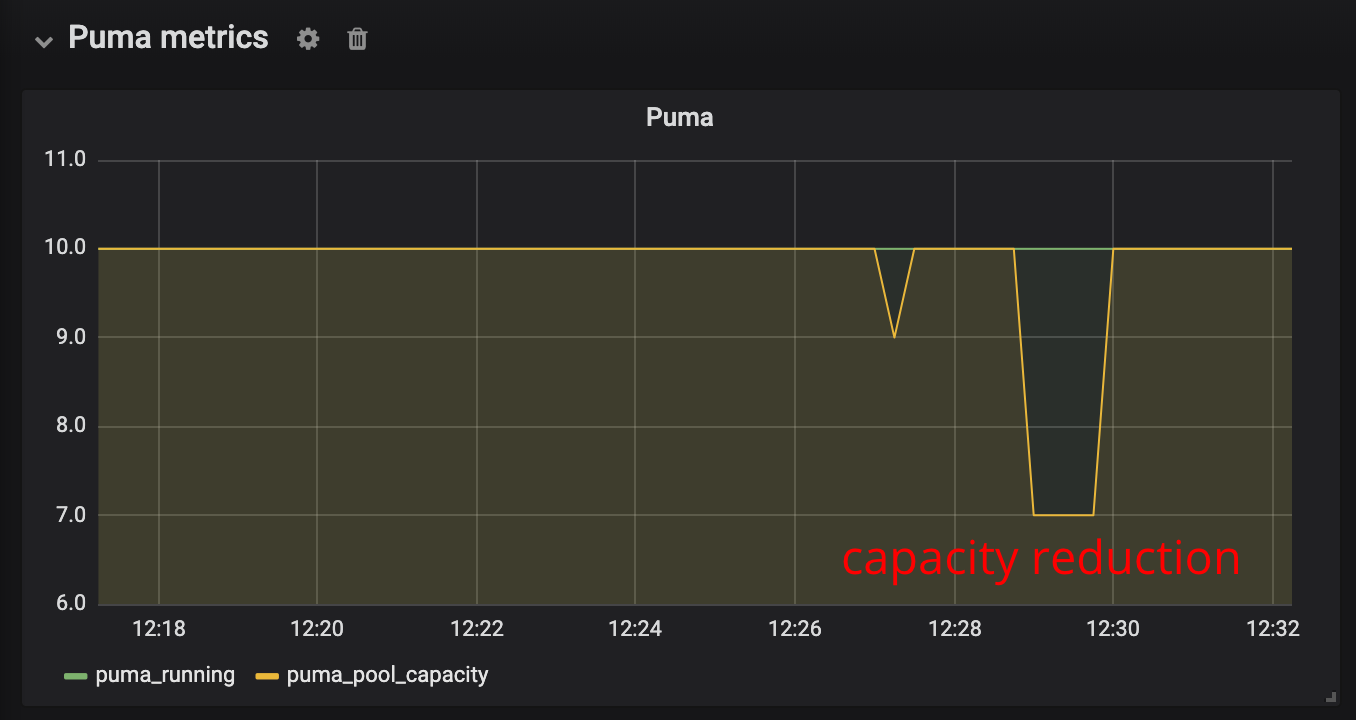
See also the grafana screenshot of monitoring puma pool size and it's capacity when application is overloaded:
- Collect also
control-gcpuma metrics
Get local development environment working and tests running is very easy with docker-compose:
docker-compose run app bundle
docker-compose run app bundle exec rspecBug reports and pull requests are welcome on GitHub at https://github.com/yabeda-rb/yabeda-puma-plugin.
-
Bump version number in
lib/yabeda/puma/plugin/version.rbIn case of pre-releases keep in mind rubygems/rubygems#3086 and check version with command like
Gem::Version.new(Yabeda::VERSION).to_s -
Fill
CHANGELOG.mdwith missing changes, add header with version and date. -
Make a commit:
git add lib/yabeda/puma/plugin/version.rb CHANGELOG.md
version=$(ruby -r ./lib/yabeda/puma/plugin/version.rb -e "puts Gem::Version.new(Yabeda::Puma::Plugin::VERSION)")
git commit --message="${version}: " --edit
-
Create annotated tag:
git tag v${version} --annotate --message="${version}: " --edit --sign
-
Fill version name into subject line and (optionally) some description (list of changes will be taken from changelog and appended automatically)
-
Push it:
git push --follow-tags
-
GitHub Actions will create a new release, build and push gem into RubyGems! You're done!
The gem is available as open source under the terms of the MIT License.


