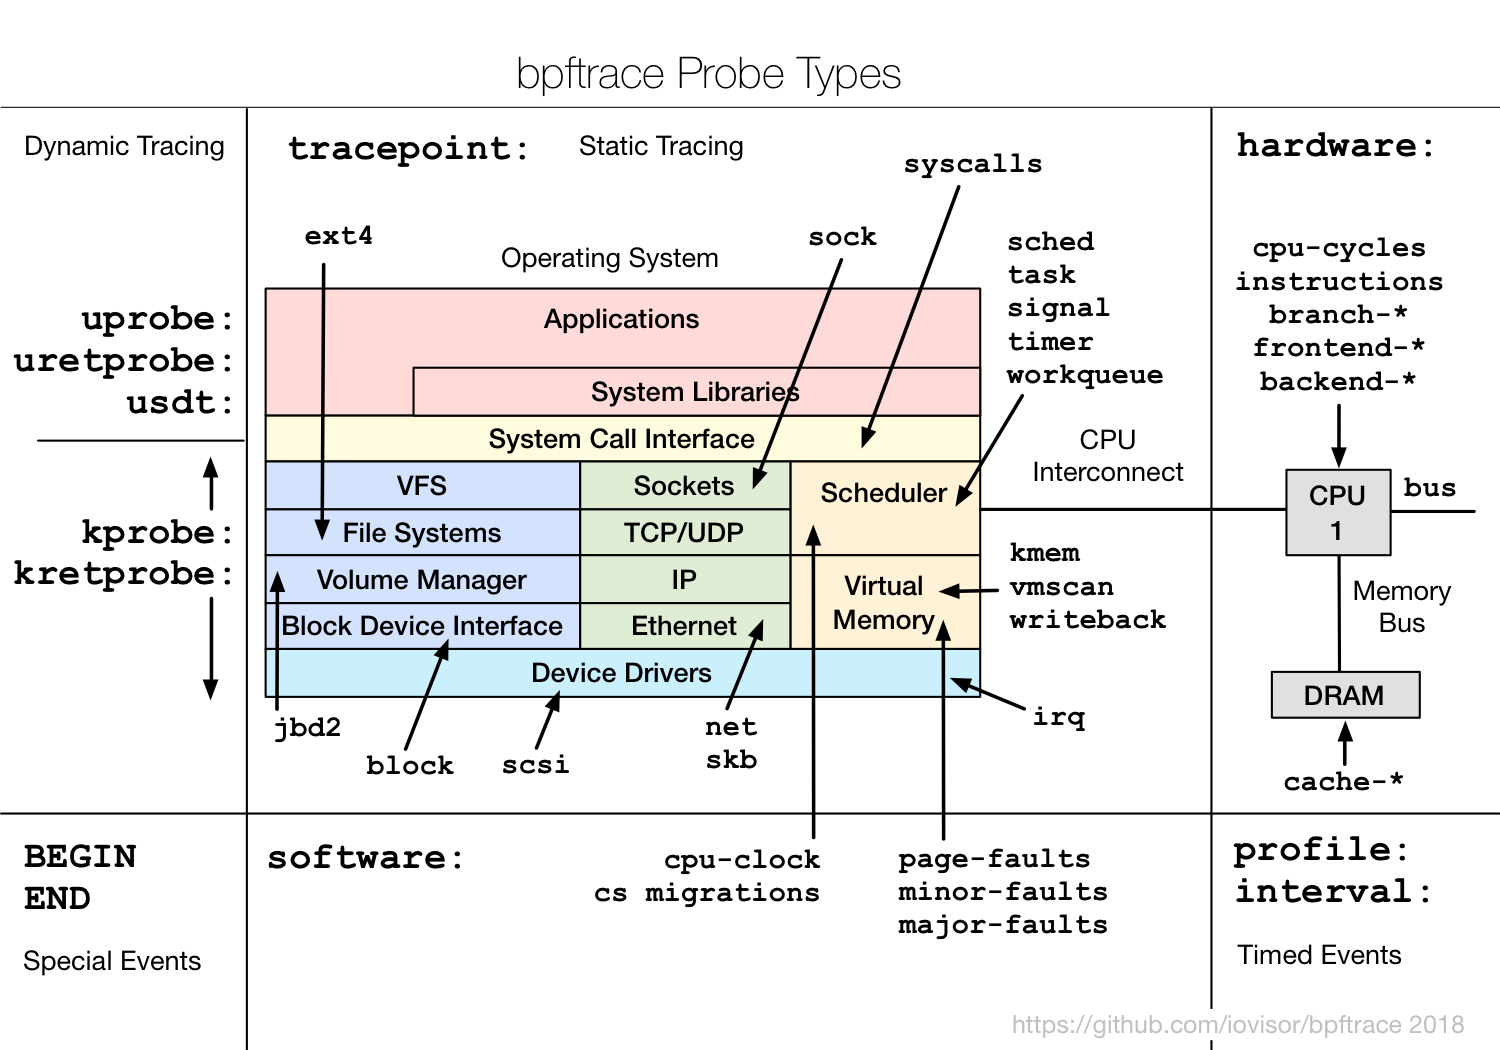
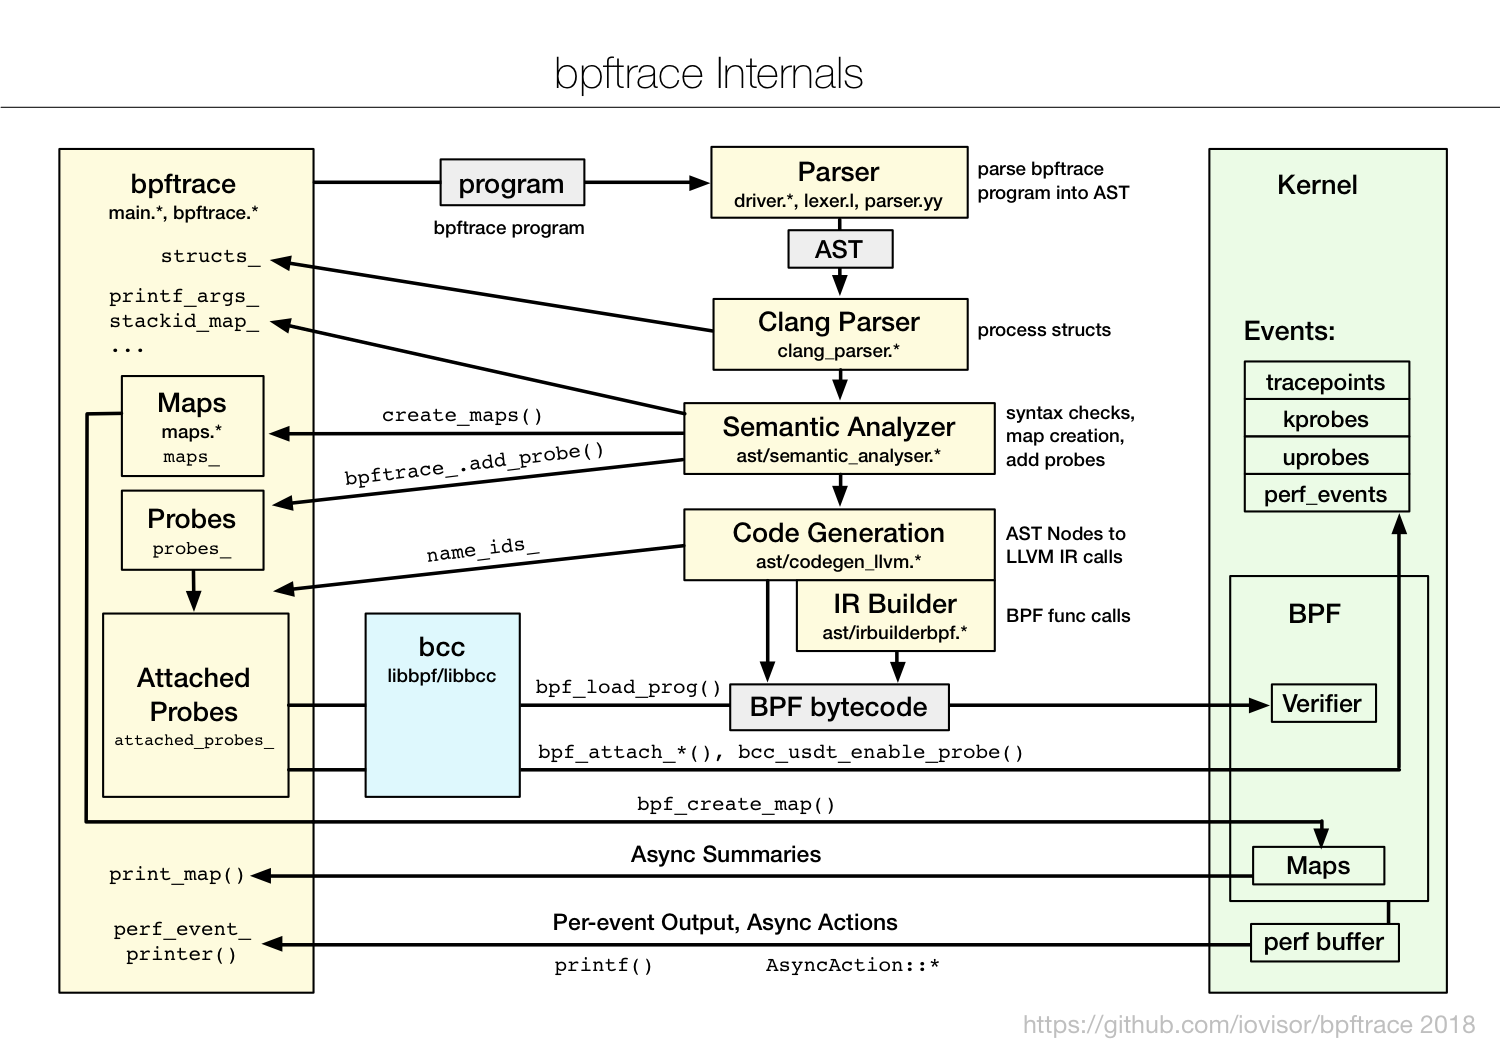
bpftrace is a high-level tracing language for Linux enhanced Berkeley Packet Filter (eBPF) available in recent Linux kernels (4.x). bpftrace uses LLVM as a backend to compile scripts to BPF-bytecode and makes use of BCC for interacting with the Linux BPF system, as well as existing Linux tracing capabilities: kernel dynamic tracing (kprobes), user-level dynamic tracing (uprobes), and tracepoints. The bpftrace language is inspired by awk and C, and predecessor tracers such as DTrace and SystemTap. bpftrace was created by Alastair Robertson.
To learn more about bpftrace, see the Reference Guide and One-Liner Tutorial.
For build and install instructions, see INSTALL.md.
Count system calls using tracepoints:
# bpftrace -e 'tracepoint:syscalls:sys_enter_* { @[probe] = count(); }'
Attaching 320 probes...
^C

...
@[tracepoint:syscalls:sys_enter_access]: 3291
@[tracepoint:syscalls:sys_enter_close]: 3897
@[tracepoint:syscalls:sys_enter_newstat]: 4268
@[tracepoint:syscalls:sys_enter_open]: 4609
@[tracepoint:syscalls:sys_enter_mmap]: 4781
Produce a histogram of time (in nanoseconds) spent in the read() system call:
// read.bt file
tracepoint:syscalls:sys_enter_read
{
  @start[tid] = nsecs;
}

tracepoint:syscalls:sys_exit_read / @start[tid] /
{
  @times = hist(nsecs - @start[tid]);
  delete(@start[tid]);
}
# bpftrace read.bt
Attaching 2 probes...
^C

@times:
[256, 512)           326 |@                                                   |
[512, 1k)           7715 |@@@@@@@@@@@@@@@@@@@@@@@@@@                          |
[1k, 2k)           15306 |@@@@@@@@@@@@@@@@@@@@@@@@@@@@@@@@@@@@@@@@@@@@@@@@@@@@|
[2k, 4k)             609 |@@                                                  |
[4k, 8k)             611 |@@                                                  |
[8k, 16k)            438 |@                                                   |
[16k, 32k)            59 |                                                    |
[32k, 64k)            36 |                                                    |
[64k, 128k)            5 |                                                    |
Print process name and paths for file opens, using kprobes (kernel dynamic tracing) of do_sys_open():
# bpftrace -e 'kprobe:do_sys_open { printf("%s: %s\n", comm, str(arg1)) }'
Attaching 1 probe...
git: .git/objects/da
git: .git/objects/pack
git: /etc/localtime
systemd-journal: /var/log/journal/72d0774c88dc4943ae3d34ac356125dd
DNS Res~ver #15: /etc/hosts
^C
CPU profiling, sampling kernel stacks at 99 Hertz:
# bpftrace -e 'profile:hz:99 { @[stack] = count() }'
Attaching 1 probe...
^C

...
@[
    queue_work_on+41
    tty_flip_buffer_push+43
    pty_write+83
    n_tty_write+434
    tty_write+444
    __vfs_write+55
    vfs_write+177
    sys_write+85
    entry_SYSCALL_64_fastpath+26
]: 97
@[
    cpuidle_enter_state+299
    cpuidle_enter+23
    call_cpuidle+35
    do_idle+394
    cpu_startup_entry+113
    rest_init+132
    start_kernel+1083
    x86_64_start_reservations+41
    x86_64_start_kernel+323
    verify_cpu+0
]: 150
The following one-liners demonstrate different capabilities:
# Files opened by process
bpftrace -e 'tracepoint:syscalls:sys_enter_open { printf("%s %s\n", comm, str(args->filename)); }'

# Syscall count by program
bpftrace -e 'tracepoint:raw_syscalls:sys_enter { @[comm] = count(); }'

# Read bytes by process:
bpftrace -e 'tracepoint:syscalls:sys_exit_read /args->ret/ { @[comm] = sum(args->ret); }'

# Read size distribution by process:
bpftrace -e 'tracepoint:syscalls:sys_exit_read { @[comm] = hist(args->ret); }'

# Show per-second syscall rates:
bpftrace -e 'tracepoint:raw_syscalls:sys_enter { @ = count(); } interval:s:1 { print(@); clear(@); }'

# Trace disk size by process
bpftrace -e 'tracepoint:block:block_rq_issue { printf("%d %s %d\n", pid, comm, args->bytes); }'

# Count page faults by process
bpftrace -e 'software:faults:1 { @[comm] = count(); }'

# Count LLC cache misses by process name and PID (uses PMCs):
bpftrace -e 'hardware:cache-misses:1000000 { @[comm, pid] = count(); }'

# Profile user-level stacks at 99 Hertz, for PID 189:
bpftrace -e 'profile:hz:99 /pid == 189/ { @[ustack] = count(); }'

# Files opened, for processes in the root cgroup-v2
bpftrace -e 'tracepoint:syscalls:sys_enter_openat /cgroup == cgroupid("/sys/fs/cgroup/unified/mycg")/ { printf("%s\n", str(args->filename)); }'
bpftrace contains various tools, which also serve as examples of programming in the bpftrace language.
- tools/bashreadline.bt: Print entered bash commands system wide. Examples.
- tools/biolatency.bt: Block I/O latency as a histogram. Examples.
- tools/biosnoop.bt: Block I/O tracing tool, showing per I/O latency. Examples.
- tools/bitesize.bt: Show disk I/O size as a histogram. Examples.
- tools/capable.bt: Trace security capability checks. Examples.
- tools/cpuwalk.bt: Sample which CPUs are executing processes. Examples.
- tools/dcsnoop.bt: Trace directory entry cache (dcache) lookups. Examples.
- tools/execsnoop.bt: Trace new processes via exec() syscalls. Examples.
- tools/gethostlatency.bt: Show latency for getaddrinfo/gethostbyname[2] calls. Examples.
- tools/killsnoop.bt: Trace signals issued by the kill() syscall. Examples.
- tools/loads.bt: Print load averages. Examples.
- tools/mdflush.bt: Trace md flush events. Examples.
- tools/opensnoop.bt: Trace open() syscalls showing filenames. Examples.
- tools/oomkill.bt: Trace OOM killer. Examples.
- tools/pidpersec.bt: Count new processes (via fork). Examples.
- tools/runqlat.bt: CPU scheduler run queue latency as a histogram. Examples.
- tools/runqlen.bt: CPU scheduler run queue length as a histogram. Examples.
- tools/statsnoop.bt: Trace stat() syscalls for general debugging. Examples.
- tools/syncsnoop.bt: Trace sync() variety of syscalls. Examples.
- tools/syscount.bt: Count system calls. Examples.
- tools/tcpaccept: Trace TCP passive connections (accept()). Examples.
- tools/tcpconnect: Trace TCP active connections (connect()). Examples.
- tools/tcpdrop: Trace kernel-based TCP packet drops with details. Examples.
- tools/tcpretrans: Trace TCP retransmits. Examples.
- tools/vfscount.bt: Count VFS calls. Examples.
- tools/vfsstat.bt: Count some VFS calls, with per-second summaries. Examples.
- tools/writeback.bt: Trace file system writeback events with details. Examples.
- tools/xfsdist.bt: Summarize XFS operation latency distribution as a histogram. Examples.
For more eBPF observability tools, see bcc tools.

Attach a bpftrace script to a kernel function, to be executed when that function is called:
kprobe:vfs_read { ... }
Attach script to a userland function:
uprobe:/bin/bash:readline { ... }
Attach script to a statically defined tracepoint in the kernel:
tracepoint:sched:sched_switch { ... }
Tracepoints are guaranteed to be stable between kernel versions, unlike kprobes.
Attach script to kernel software events, executing once every provided count or use a default:
software:faults:100
software:faults:
Attach script to hardware events (PMCs), executing once every provided count or use a default:
hardware:cache-references:1000000
hardware:cache-references:
Run the script on all CPUs at specified time intervals:
profile:hz:99 { ... }
profile:s:1 { ... }
profile:ms:20 { ... }
profile:us:1500 { ... }
Run the script once per interval, for printing interval output:
interval:s:1 { ... }
interval:ms:20 { ... }
A single probe can be attached to multiple events:
kprobe:vfs_read,kprobe:vfs_write { ... }
Some probe types allow wildcards to be used when attaching a probe:
uprobe:/bin/bash:read* { ... }
kprobe:vfs_* { ... }
Define conditions for which a probe should be executed:
kprobe:sys_open / uid == 0 / { ... }
The following variables and functions are available for use in bpftrace scripts:
Variables:
pid- Process ID (kernel tgid)tid- Thread ID (kernel pid)cgroup- Cgroup ID of the current processuid- User IDgid- Group IDnsecs- Nanosecond timestampelapsed- Nanosecond timestamp since bpftrace initializationcpu- Processor IDcomm- Process namestack- Kernel stack traceustack- User stack tracearg0,arg1, ... etc. - Arguments to the function being tracedretval- Return value from function being tracedfunc- Name of the function currently being tracedprobe- Full name of the probecurtask- Current task_struct as a u64rand- Random number of type u32$1,$2, ... etc. - Positional parameters to the bpftrace program
Functions:
hist(int n)- Produce a log2 histogram of values ofnlhist(int n, int min, int max, int step)- Produce a linear histogram of values ofncount()- Count the number of times this function is calledsum(int n)- Sum this valuemin(int n)- Record the minimum value seenmax(int n)- Record the maximum value seenavg(int n)- Average this valuestats(int n)- Return the count, average, and total for this valuedelete(@x)- Delete the map element passed in as an argumentstr(char *s [, int length])- Returns the string pointed to bysprintf(char *fmt, ...)- Print formatted to stdoutprint(@x[, int top [, int div]])- Print a map, with optional top entry count and divisorclear(@x)- Delete all key/values from a mapsym(void *p)- Resolve kernel addressusym(void *p)- Resolve user space addressntop(int af, int addr)- Resolve ip addresskaddr(char *name)- Resolve kernel symbol nameuaddr(char *name)- Resolve user space symbol namereg(char *name)- Returns the value stored in the named registerjoin(char *arr[] [, char *delim])- Prints the string arraytime(char *fmt)- Print the current timesystem(char *fmt)- Execute shell commandexit()- Quit bpftrace
See the Reference Guide for more detail.

bpftrace employs various techniques for efficiency, minimizing the instrumentation overhead. Summary statistics are stored in kernel BPF maps, which are asynchronously copied from kernel to user-space, only when needed. Other data, and asynchronous actions, are passed from kernel to user-space via the perf output buffer.
-
Have ideas for new bpftrace tools? CONTRIBUTING-TOOLS.md
-
Bugs reports and feature requests: Issue Tracker
-
bpftrace development IRC: #bpftrace at irc.oftc.net
Copyright 2019 Alastair Robertson
Licensed under the Apache License, Version 2.0 (the "License"); you may not use this file except in compliance with the License. You may obtain a copy of the License at
http://www.apache.org/licenses/LICENSE-2.0
Unless required by applicable law or agreed to in writing, software distributed under the License is distributed on an "AS IS" BASIS, WITHOUT WARRANTIES OR CONDITIONS OF ANY KIND, either express or implied. See the License for the specific language governing permissions and limitations under the License.