epicrop: Simulation Modelling of Crop Diseases Using a Susceptible-Exposed-Infectious-Removed (SEIR) Model
A fork of cropsim
designed to make using the EPIRICE model (Savary et al. 2012) for rice
diseases easier to use. This version provides easy to use functions to
fetch weather data from NASA POWER, via the
nasapower package
(Sparks 2018, Sparks 2020) and predict disease severity of five rice
diseases using a generic SEIR model (Zadoks 1971) function, SEIR().
The original EPIRICE manuscript, Savary et al. (2012), which details the model and results of its use to model global epidemics of rice diseases, was published in Crop Protection detailing global unmanaged disease risk of bacterial blight, brown spot, leaf blast, sheath blight and tungro, which are included in this package.
You can easily simulate any of the five diseases for rice grown anywhere
in the world for years from 1983 to near current using get_wth() to
fetch data from the NASA POWER web API.
Alternatively, you can supply your own weather data for any time period
as long as it fits the model’s requirements.
epicrop is not yet on CRAN. You can install it this way.
if (!require("remotes"))
  install.packages("remotes")
remotes::install_github("adamhsparks/epicrop"
)First you need to provide weather data for the model. epicrop provides
the get_wth() function to do this. Using it you can fetch weather data
for any place in the world from 1983 to near present by providing the
and latitude and dates or length of rice growing season as shown below.
library("epicrop")

# Fetch weather for year 2000 wet season for a 120 day rice variety at the IRRI
# Zeigler Experiment Station
wth <- get_wth(
  lonlat = c(121.25562, 14.6774),
  dates = "2000-07-01",
  duration = 120
)

wth
#>        YYYYMMDD DOY  TEMP  RHUM  RAIN   LAT   LON
#>   1: 2000-07-01 183 25.34 91.07 24.87 14.68 121.3
#>   2: 2000-07-02 184 25.99 85.71 17.63 14.68 121.3
#>   3: 2000-07-03 185 25.35 94.01 33.52 14.68 121.3
#>   4: 2000-07-04 186 25.58 93.28 16.21 14.68 121.3
#>   5: 2000-07-05 187 25.79 92.62 36.28 14.68 121.3
#>  ---
#> 117: 2000-10-25 299 25.56 89.57 11.04 14.68 121.3
#> 118: 2000-10-26 300 25.31 94.35 10.51 14.68 121.3
#> 119: 2000-10-27 301 25.58 90.85  9.13 14.68 121.3
#> 120: 2000-10-28 302 25.25 92.52 77.16 14.68 121.3
#> 121: 2000-10-29 303 24.78 94.41 29.22 14.68 121.3Once you have the weather data, run the model for any of the five rice diseases by providing the emergence or crop establishment date for transplanted rice.
bb <- predict_bacterial_blight(wth, emergence = "2000-07-01")

bb
#>      simday      dates  sites latent infectious removed senesced rateinf
#>   1:      0 2000-06-30  100.0   0.00        0.0     0.0    0.000   0.000
#>   2:      1 2000-07-01  108.7   0.00        0.0     0.0    1.000   0.000
#>   3:      2 2000-07-02  118.1   0.00        0.0     0.0    2.087   0.000
#>   4:      3 2000-07-03  128.3   0.00        0.0     0.0    3.268   0.000
#>   5:      4 2000-07-04  139.3   0.00        0.0     0.0    4.551   0.000
#>  ---
#> 117:    116 2000-10-24 1308.2  44.37      916.6   362.0 2210.703  17.981
#> 118:    117 2000-10-25 1256.5  39.99      895.1   405.9 2267.662  15.735
#> 119:    118 2000-10-26 1211.4  33.72      876.6   446.4 2320.710  13.933
#> 120:    119 2000-10-27 1165.7  47.65      833.0   490.0 2376.432  11.931
#> 121:    120 2000-10-28 1120.0  59.58      786.7   536.2 2434.321   9.753
#>      rtransfer rgrowth rsenesced diseased severity   lat   lon
#>   1:      0.00   9.688     1.000        0     0.00 14.68 121.3
#>   2:      0.00  10.500     1.087        0     0.00 14.68 121.3
#>   3:      0.00  11.374     1.181        0     0.00 14.68 121.3
#>   4:      0.00  12.315     1.283        0     0.00 14.68 121.3
#>   5:      0.00  13.326     1.393        0     0.00 14.68 121.3
#>  ---
#> 117:     22.36  23.254    56.959     1323    42.35 14.68 121.3
#> 118:     22.00  23.659    53.049     1341    42.67 14.68 121.3
#> 119:      0.00  23.922    55.722     1357    42.90 14.68 121.3
#> 120:      0.00  24.177    57.889     1371    43.04 14.68 121.3
#> 121:      0.00  24.410    57.906     1383    43.04 14.68 121.3
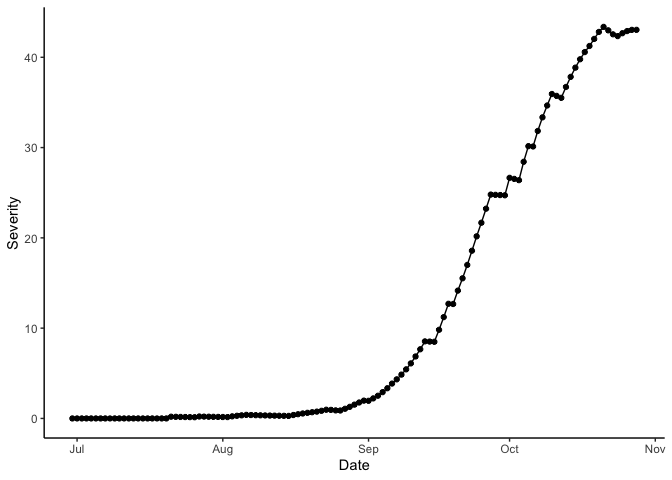
Lastly, you can visualise the result of the model run.
library("ggplot2")

ggplot(data = bb,
       aes(x = dates,
           y = severity)) +
  labs(y = "Severity",
       x = "Date") +
  geom_line() +
  geom_point() +
  theme_classic()
Bacterial blight disease progress over time. Results for wet season year 2000 at IRRI Zeigler Experiment Station shown. Weather data used to run the model were obtained from the NASA Langley Research Center POWER Project funded through the NASA Earth Science Directorate Applied Science Program.
Please note that this project is released with a Contributor Code of Conduct. By participating in this project you agree to abide by its terms.
Serge Savary, Andrew Nelson, Laetitia Willocquet, Ireneo Pangga and Jorrel Aunario. Modeling and mapping potential epidemics of rice diseases globally. Crop Protection, Volume 34, 2012, Pages 6-17, ISSN 0261-2194 DOI: 10.1016/j.cropro.2011.11.009.
Serge Savary, Stacia Stetkiewicz, François Brun, and Laetitia Willocquet. Modelling and Mapping Potential Epidemics of Wheat Diseases-Examples on Leaf Rust and Septoria Tritici Blotch Using EPIWHEAT. European Journal of Plant Pathology 142, no. 4 (August 1, 2015): 771–90. DOI: 10.1007/s10658-015-0650-7.
Jan C. Zadoks. Systems Analysis and the Dynamics of Epidemics. Laboratory of Phytopathology, Agricultural University, Wageningen, The Netherlands; Phytopathology 61:600. DOI: 10.1094/Phyto-61-600.
Adam Sparks (2018). nasapower: A NASA POWER Global Meteorology, Surface Solar Energy and Climatology Data Client for R. Journal of Open Source Software, 3(30), 1035, 10.21105/joss.01035.
Adam Sparks (2020). nasapower: NASA-POWER Data from R. R package version 3.0.1, URL: https://CRAN.R-project.org/package=nasapower.
