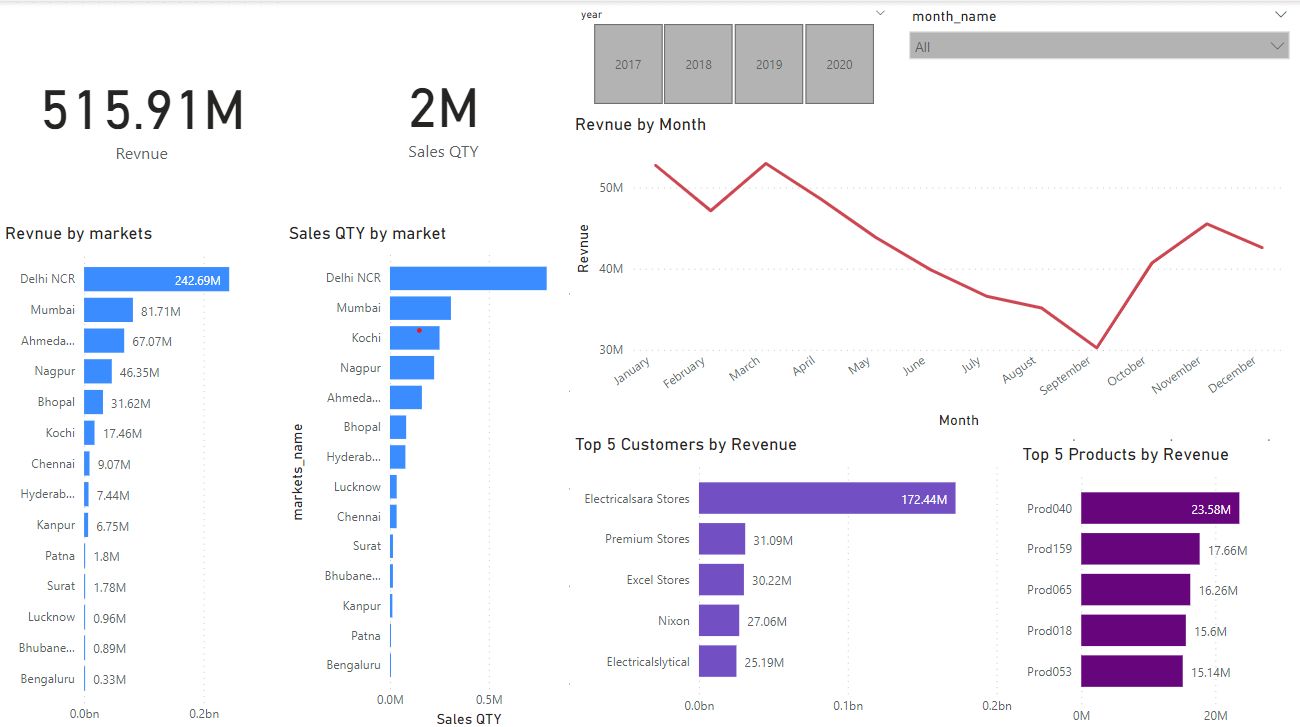
This project aims to perform sales analysis using SQL and visualize the results using Power BI. The analysis will provide insights into sales performance, trends, and key metrics to support data-driven decision-making in sales and marketing.
The project utilizes a SQL database as the data source, which contains relevant sales data.
The key objectives of this project are as follows:
- Sales Performance Analysis: Evaluate sales performance based on different dimensions, such as time, products, and customers. Identify top-selling products and customers, as well as patterns and trends in sales.
- Revenue Analysis: Analyze revenue generation and identify the most profitable products, customers, and sales regions.
- Sales Dashboard: Create an interactive Power BI dashboard to visualize the analysis results and make it easier to interpret and share insights.
- SQL: Used for querying and manipulating the sales data stored in the database.
- Power BI: Used for data visualization and creating interactive dashboards.
The project consists of the following components:
- SQL Queries: SQL queries are used to retrieve and manipulate data from the database. Queries will be written to perform the required analysis, generate summary tables, and extract relevant information.
- Data Preparation: The retrieved data from SQL will be cleaned, transformed, and prepared for analysis. This step involves data cleansing, filtering, and aggregation as necessary.
- Analysis and Visualization: The prepared data will be imported into Power BI for visualization. Various charts, graphs, and tables will be created to represent the analysis results and provide interactive visualizations.
- Sales Dashboard: The visualization components will be combined into a comprehensive Power BI dashboard. The dashboard will provide an overview of key metrics and allow users to explore the data interactively.
- Documentation: A readme file and any necessary documentation will be created to explain the project's objectives, methodology, and the steps to reproduce the analysis.
The sales analysis project combines SQL and Power BI to extract insights from sales data and present them in a visually appealing and interactive manner.
