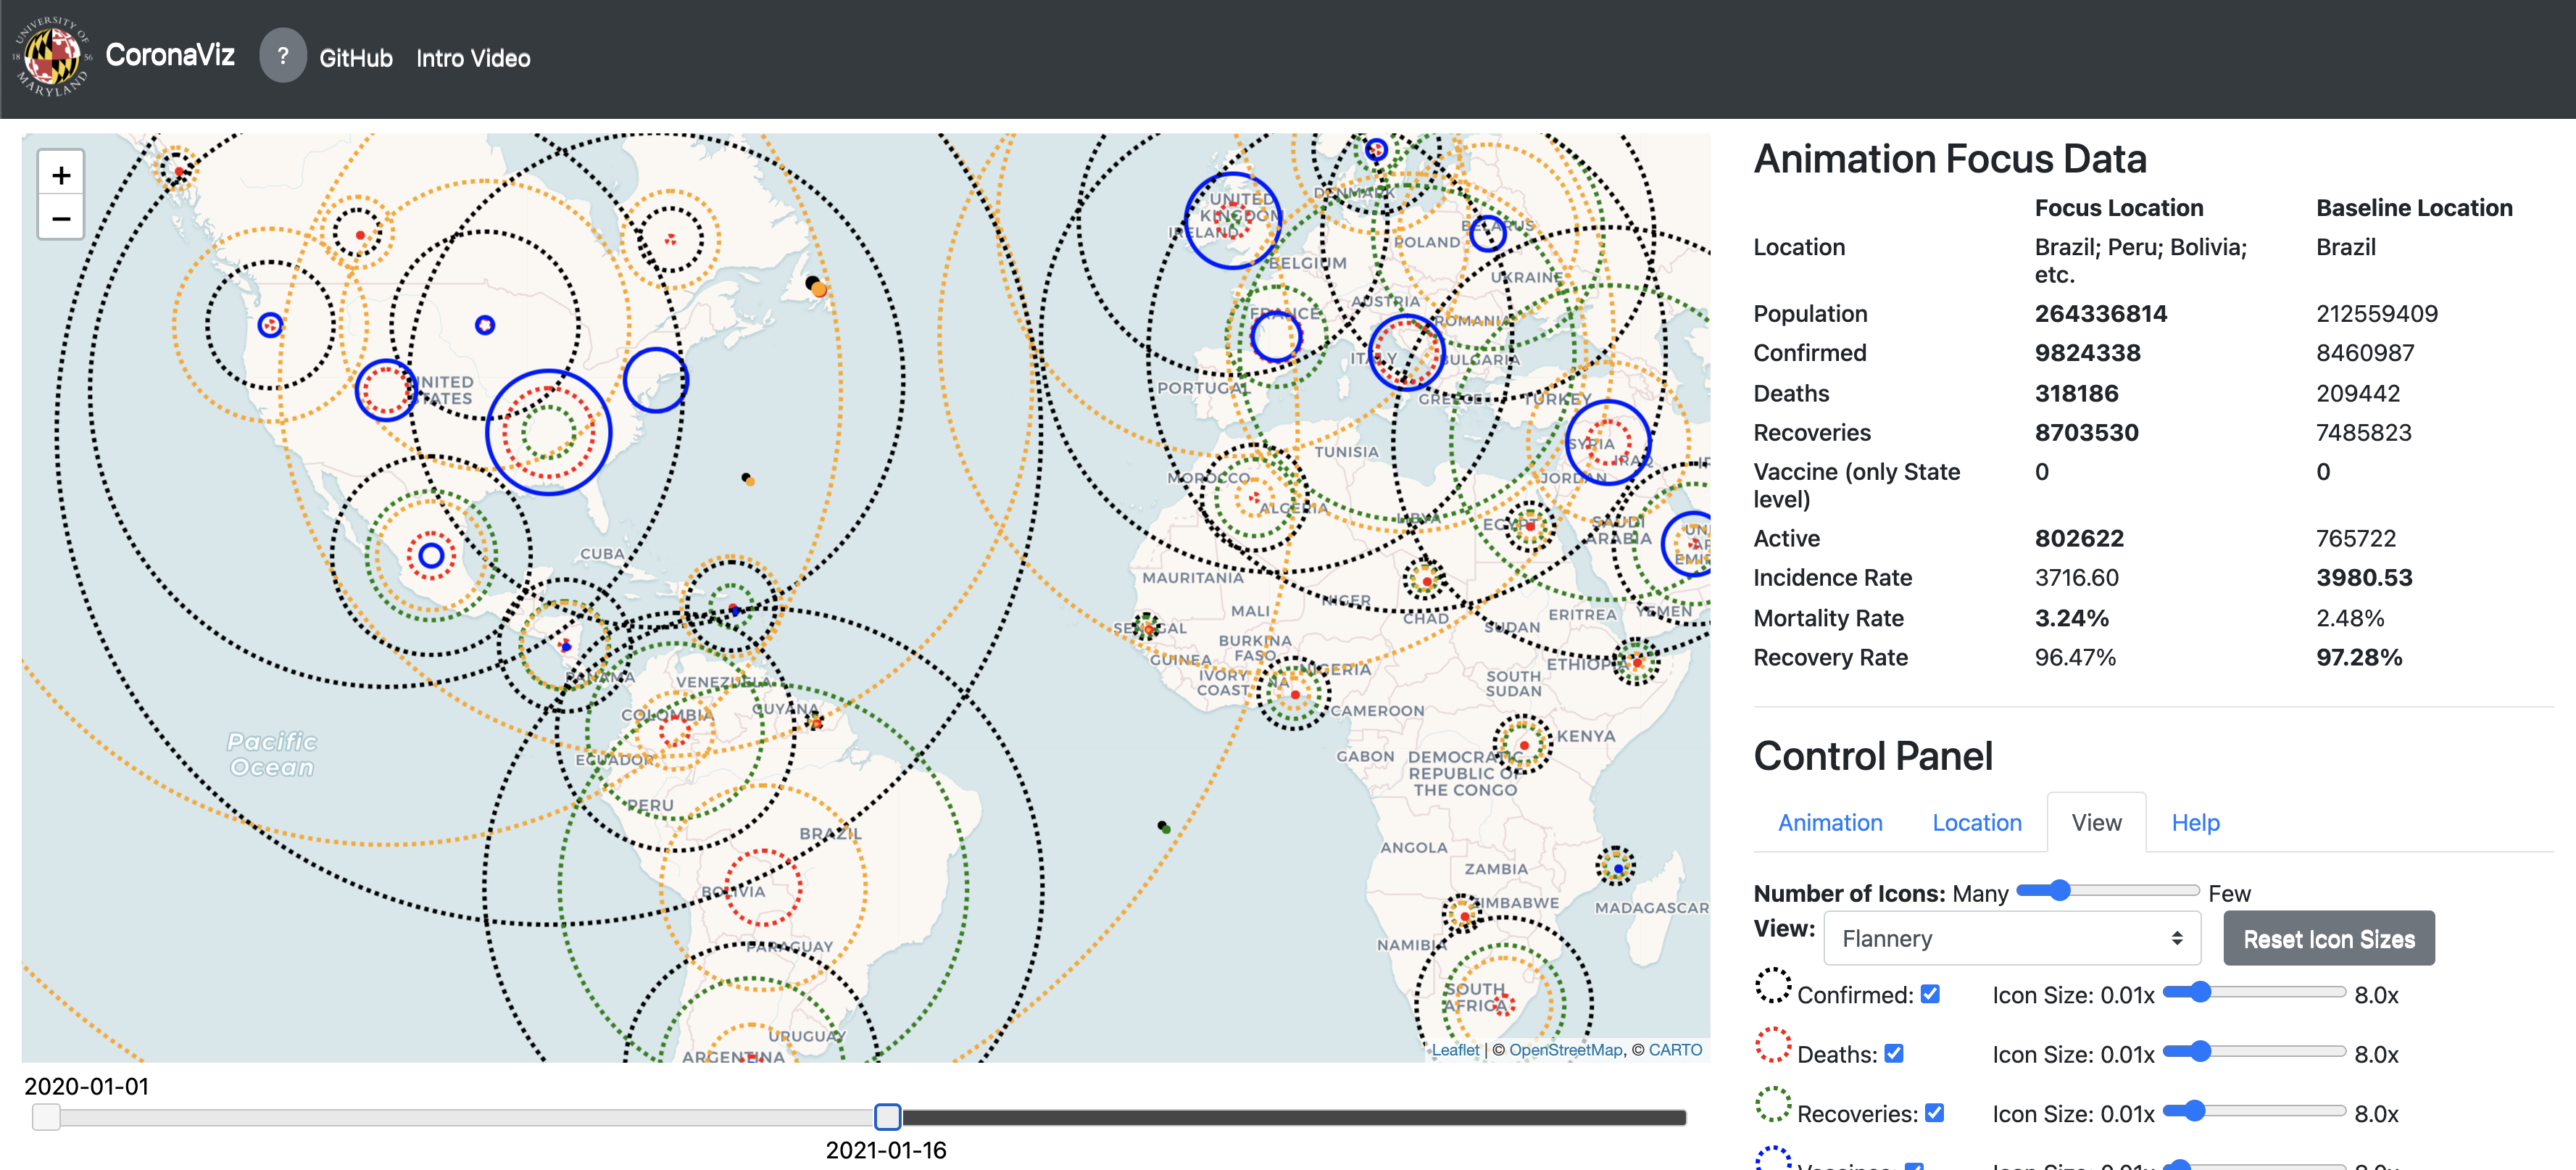
NewsStand CoronaViz is a research prototype that enables the dynamic map visualization of COVID-19 related variables including the number of infections, active cases, recoveries, and deaths all on a daily basis from the Johns Hopkins University web site at https://coronavirus.jhu.edu/map.html, as well as mentions in news articles and tweets as they occur, by allowing the underlying spatial region and the spanned time interval to vary. Any combination of the variables can be viewed subject to a possibility of clutter which is avoided by the use of concentric circles (termed geo-circles whose radii correspond to ranges of variable values. The variable values are provided both on cumulative and day-by-day bases. The visualization enables spatial, temporal, and keyword variation (i.e., it can be used for names of other disease names or entirely other concepts such as names of brands, people, etc. with an appropriate set of variables and document collections).
NewsStand CoronaViz is being developed at the University of Maryland at College Park under the leadership of Prof. Hanan Samet https://www.cs.umd.edu/~hjs with Mr. John Kastner and Mr. Hong Wei. It was motivated by the continuing spread of COVID-19 which led to the desire to track its progress over time to be better prepared to anticipate its emergence in new regions. There exist numerous systems to monitor and map officially released numbers of cases [1] which are the current established means of keeping track of the progress of the virus. However, these systems do not necessarily paint a complete picture. For example, they are primarily mashups in that they do not support zooming in on the map in the sense that they just increase the resolution of the map but do not show the data for the additional units (e.g., states/provinces, counties, etc.) that have become visible as a result of the zoom.
NewsStand CoronaViz is designed to fill in gaps in the official reports thereby providing a more complete picture. It incorporates the NewsStand system [2,4] http://newsstand.umiacs.umd.edu (see also the related TwitterStand system [3] http://twitterstand.umiacs.umd.edu) which are example applications of a general framework being developed at the University of Maryland at College Park under the direction of Prof. Hanan Samet with his associates to enable searching for information using a map query interface. When the information domain is news, the underlying search domain results from monitoring the output of over 10,000 RSS news sources and is available for retrieval within minutes of publication. The advantage of doing so is that a map, coupled with the ability to vary the zoom level at which it is viewed, provides an inherent granularity to the search process that facilitates an approximate search.
NewsStand CoronaViz makes use of NewsStand to find all news articles and tweets (identified by containing a pointer to a URL of an RSS feed) that contain the keyword (COVID-19 or Coronavirus in our case). It also identifies each toponym (geographic location) that is mentioned in the article or tweet. Next, it takes the cross product of these sets as the set of geocoded keywords. In other words, a pair associating every keyword in the article or tweet with every location mentioned in the article or tweet. Each of the keyword location pairs is also associated with the time of publication of the article in order to enable the temporal component of NewsStand CoronaViz. The result is the ability to explore the spread of the disease through analysis of keyword prevalence in geotagged news article and tweets over spatial and temporal ranges.
- E. Dong, H. Du, and L. Gardner. An interactive web-based dashboard to track COVID-19 in real time. The Lancet Infectious Diseases, 2020.
- H. Samet, J. Sankaranarayanan, M. D. Lieberman, M. D. Adelfio, B. C. Fruin, J. M. Lotkowski, D. Panozzo, J. Sperling, B. E. Teitler. Reading news with maps by exploiting spatial synonyms. Communications of the ACM, 57(10):64-77, October 2014. Cover article of the October CACM issue. Video specially made by ACM at http://vimeo.com/106352925
- J. Sankaranarayanan, H. Samet, B. Teitler, M. D. Lieberman, J. Sperling. TwitterStand: News in tweets. Proceedings of the 17th ACM SIGSPATIAL International Conference on Advances in Geographic Information Systems, pages 42-51, Seattle, WA, November 2009.
- B. Teitler, M. D. Lieberman, D. Panozzo, J. Sankaranarayanan, H. Samet, J. Sperling. NewsStand: A new view on news. Proceedings of the 16th ACM SIGSPATIAL International Conference on Advances in Geographic Information Systems, pages 144-153, Irvine, CA, November 2008. (2008 ACM SIGSPATIAL (ACMGIS08) Best Paper Award and 2018 SIGSPATIAL 10 Year Impact Award).
* This work was sponsored in part by the National Science Foundation under Grant IIS-1816889.
