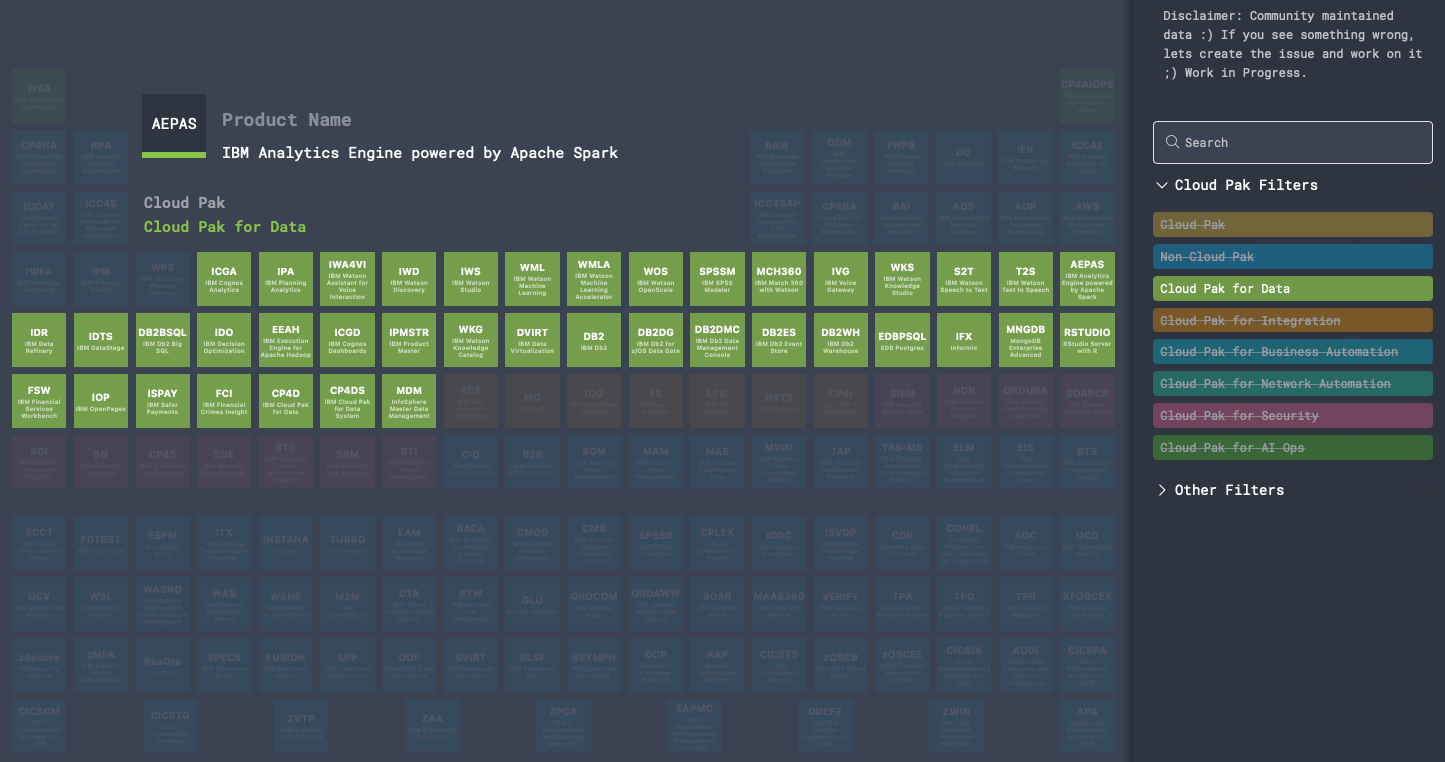
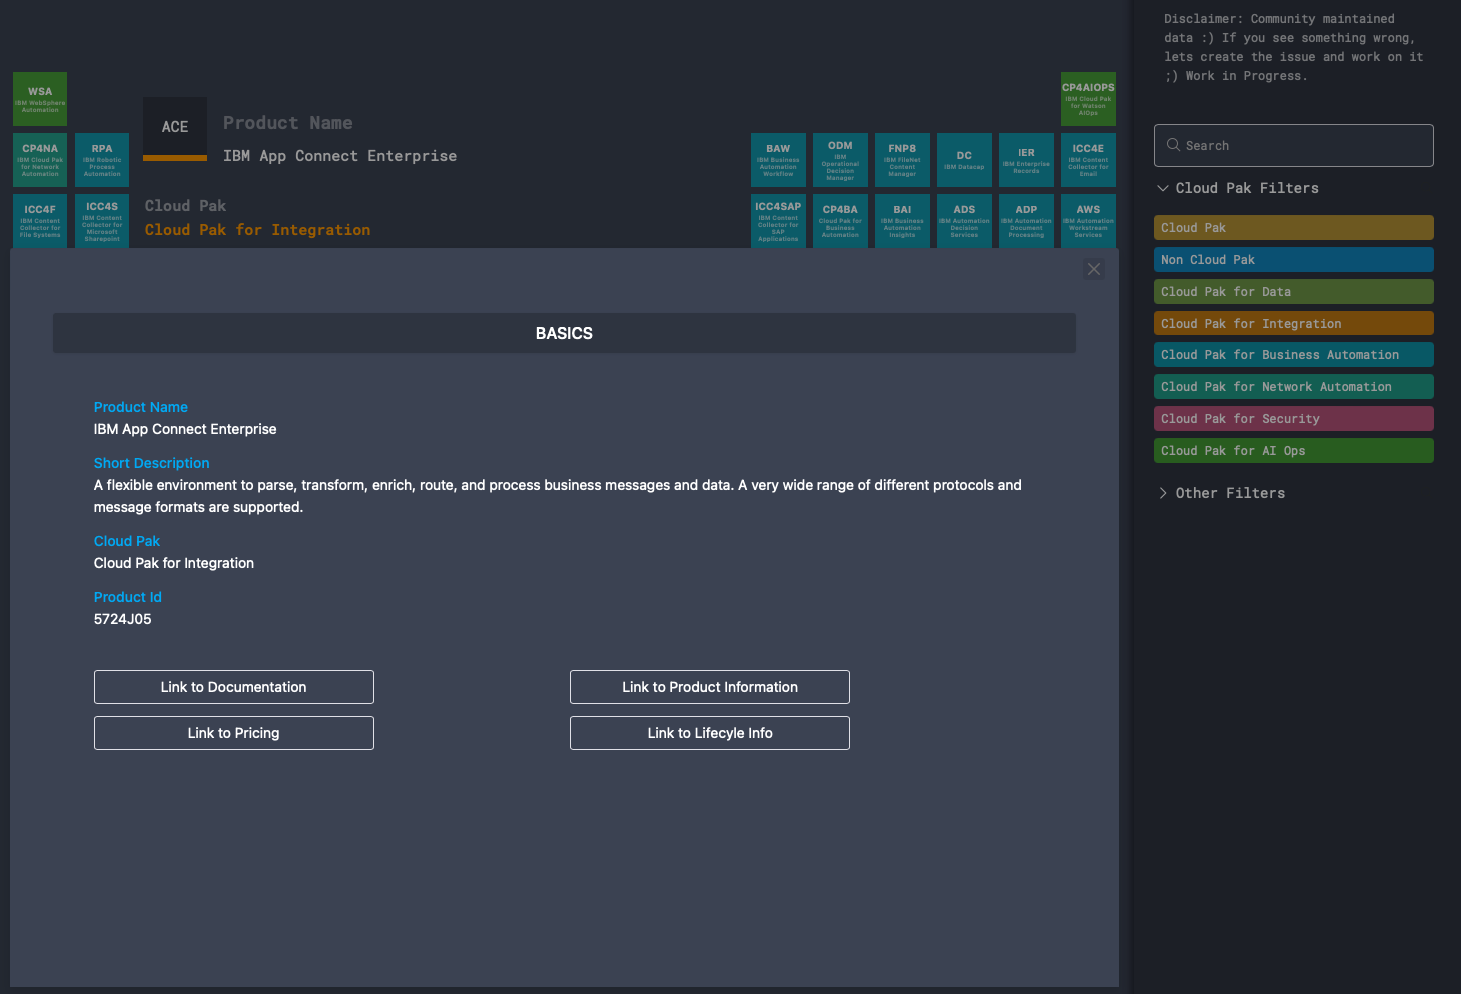
Repository with the IBM software displayed in a periodic table for easier visualisation of many of the products offered by IBM.
I am more than happy if someone can help in advancing this project 🤗. I've split this section on visuals and product data, but also here are guidelines into working with the repository:
- If you find something not right or missing or exciting that could be added, please create a descriptibe Issue 😉
- Master branch is protected
- To contribute follow the following steps OR edit directly through the Web Interface of GitHub.
- create your own branch
- create a pull request from the branch
- commit your work frequently
- when done, ask for approval of the pull request
- reviewers will do so and it will be merged
- If you want to test how the changes look, you can do so locally via
yarn installand thenyarn dev
All product data are located in: ./assets/data/areas
All the product descriptions have to adhere to the schema in ./assets/data/schema/schema.json
All is based on VueJS framework, but it is actually quite simple, be sure to test locally before commiting your changes to the repository.
This repository is based on the work of open-source community that built periodic table in vue.js, the following repositories where used to create this one:


