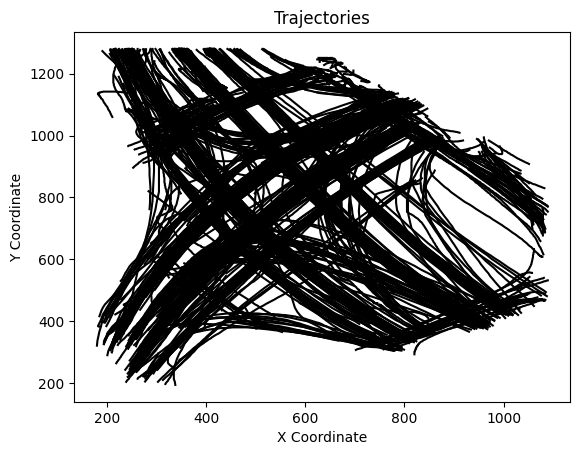
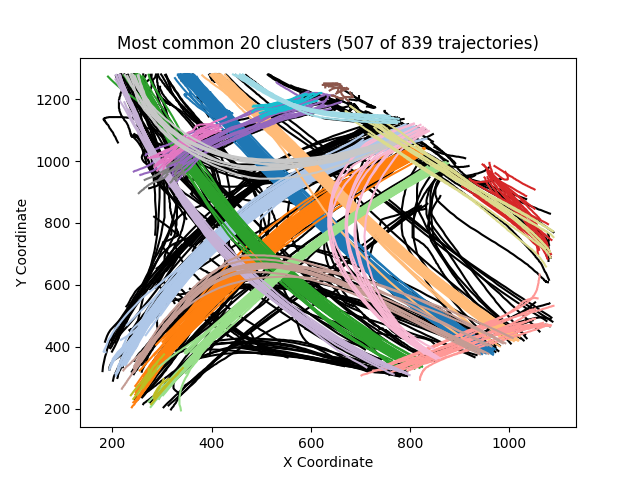
This repository contains the solution to a technical test involving the clustering of trajectories based on their similarity in direction. The goal of the project is to group trajectories that exhibit similar directions using hierarchical clustering.
Given a JSON file containing trajectories, the task is to group these trajectories based on their similarity in direction. Similar trajectories are expected to belong to the same cluster, while trajectories with distinct directions should be assigned to different clusters.
To address this problem, I developed a Python script that performs trajectory clustering using hierarchical clustering. Here's how my code works:
-
Classes: I created two classes,
CoordinatesandTrajectory, to handle the trajectory data and calculate the similarity between trajectories. -
Similarity Calculation: I computed the similarity between trajectories by comparing their directions. The similarity metric was then used as the distance metric for clustering. The idea of similarity calculation is from Dilation process in image processing. With dilation operation, the prajectories became a range of area. Then calculate the ratio of the dilation area of a trajectory overlapping coordinates of the next trajectory to get the similarity score.
-
Hierarchical Clustering: I used the hierarchical clustering algorithm provided by the
scikit-learnlibrary. The calculated similarity was utilized as the distance metric to create clusters of trajectories. -
Visualization: After clustering, I visualized the trajectories using different colors for each cluster. This allows easy identification of the most common trajectory groups.
Check out the Google Colab demo to see the trajectory clustering process in action. The demo includes an interactive environment where you can run the clustering code, visualize the results, and experiment with different parameters.
-
Clone this repository to your local machine.
-
Install the required libraries using the following command:
pip install -r requirements.txt
-
Replace the provided JSON file in data folder with your own trajectory data.
-
Open the main.py script and locate the hyperparameters section:
# You can adjust the following hyperparameters as needed

windowSize = 200  # The window size for trajectory comparison in similarity calculation. Bigger value indicate merging the trajectories with further distance into the same cluster.
distanceThreshold = 0.5  # The threshold for merging clusters. Bigger value indicate merging the trajectories with further distance into the same cluster.
sampleSize = 1000  # The number of trajectories to process
numMostCommonGroupToDisplay = 30  # The number of trajectory clusters to show
Modify the values of these hyperparameters to customize the behavior of the clustering process.
- Run the Python script to perform trajectory clustering and generate the visualization in the images folder.
- Python (>= 3.x)
- scikit-learn
- matplotlib
- numpy
python main.pyTo ensure the reliability and correctness of the trajectory clustering script, a set of unit tests have been implemented. These tests cover various aspects of the script's functionality and help identify any potential issues.
To run the unit tests, execute the following command:
python test.py- Optimizing Execution Time: One of the areas I plan to focus on is optimizing the execution time of the script, particularly for larger datasets. One approach I'm considering is precomputing and storing the near area of each trajectory. By doing so, I can reduce redundant calculations and streamline the clustering process, resulting in faster execution times

