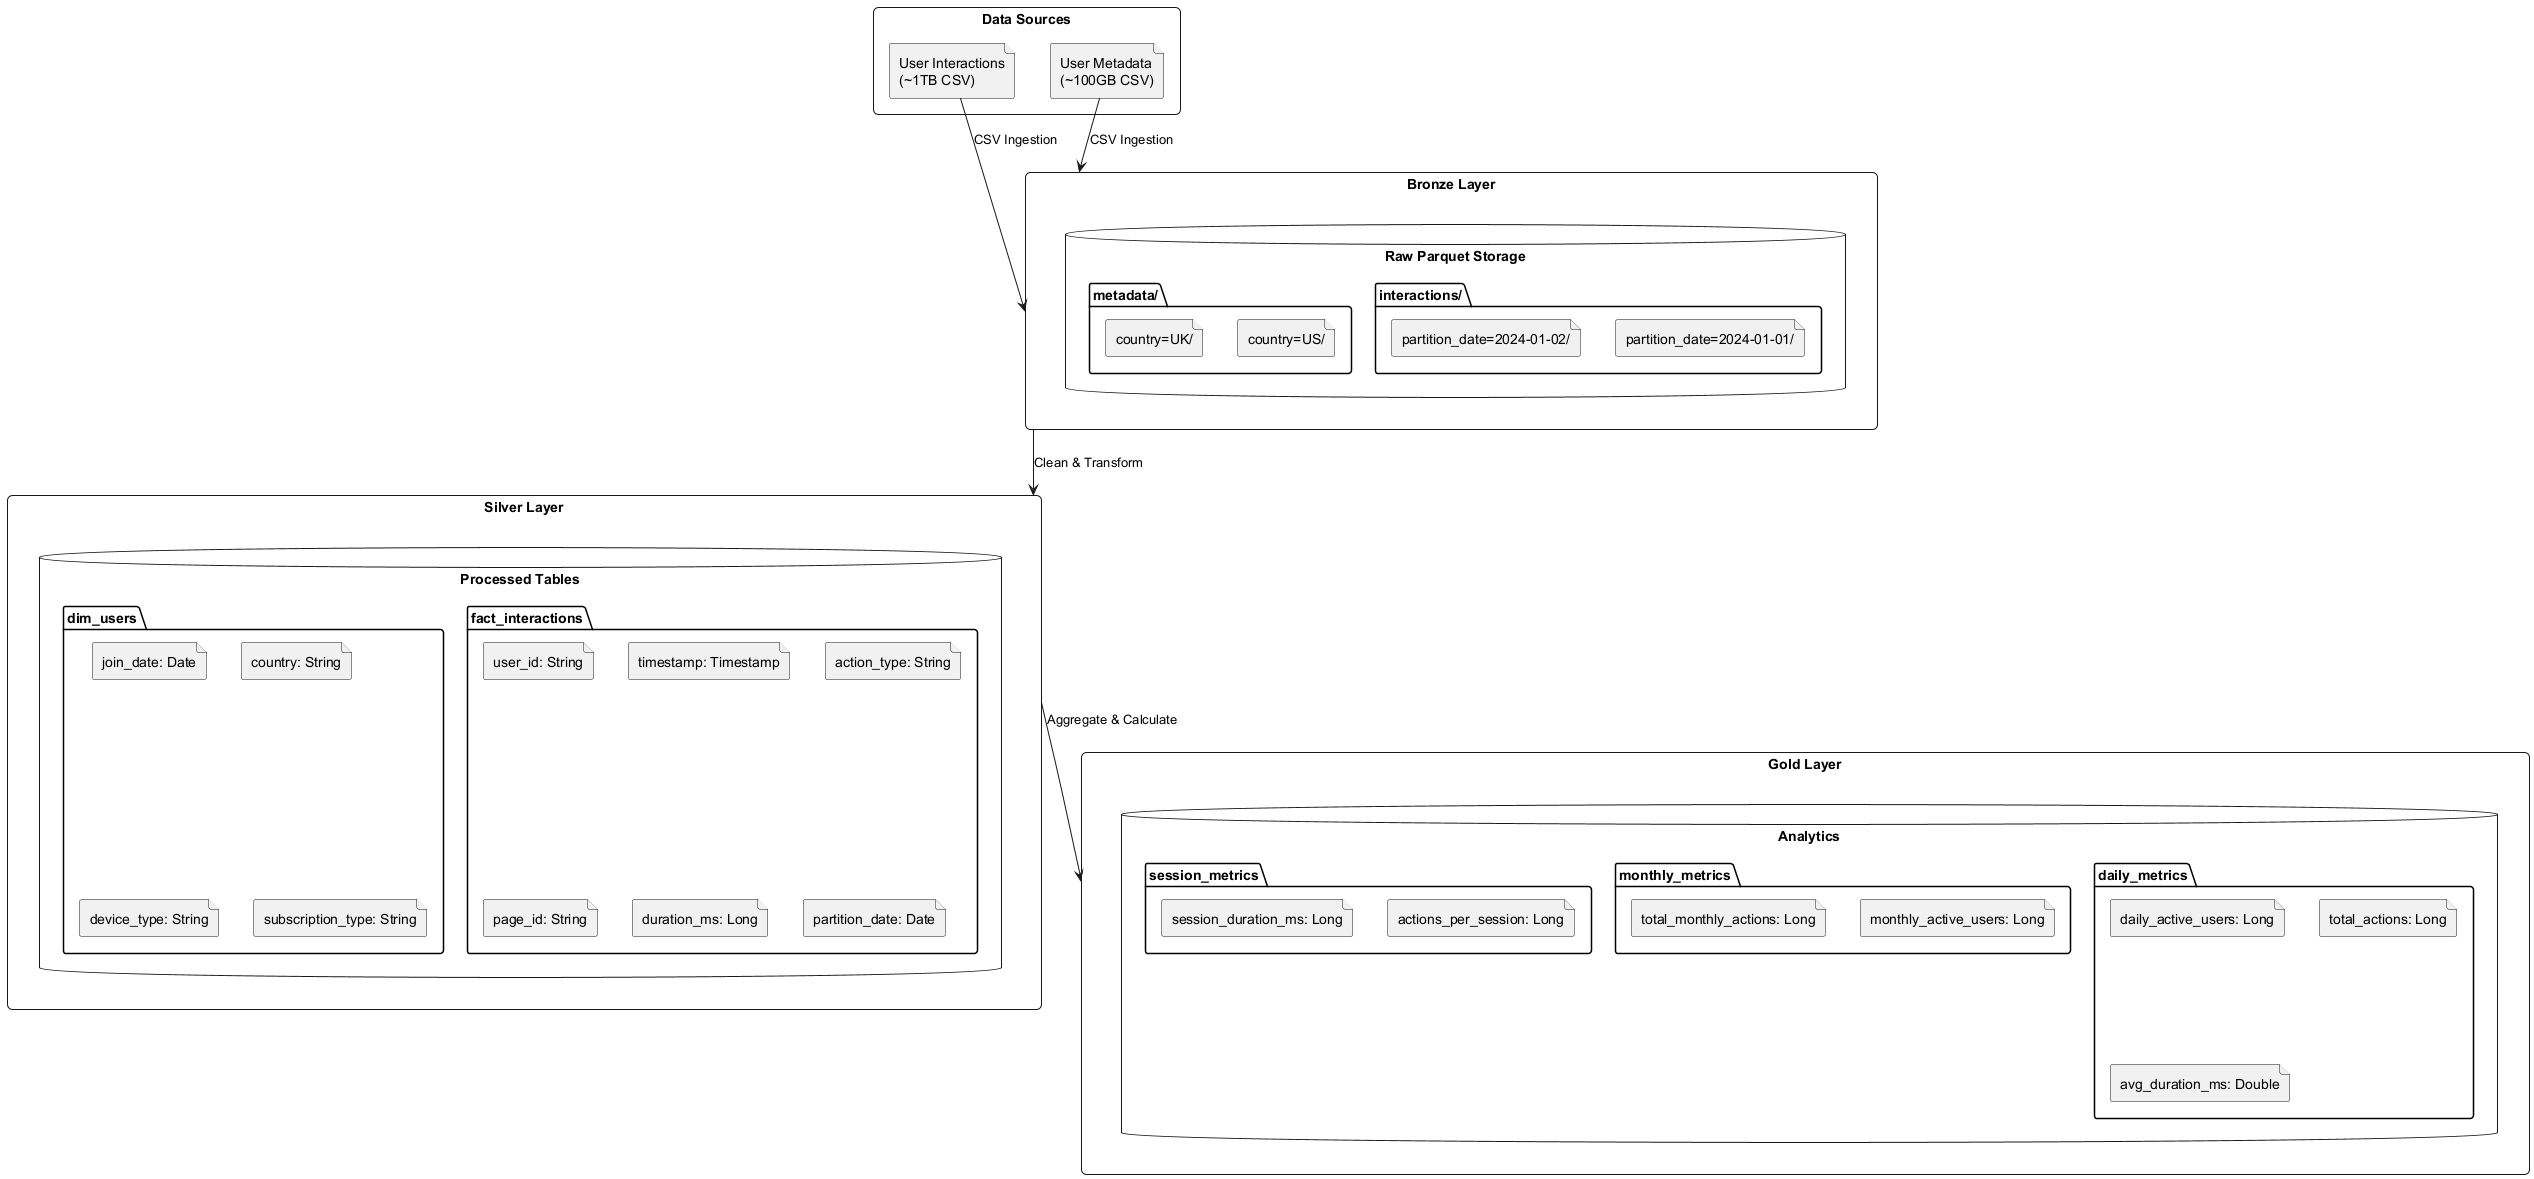
This documentation outlines my solution for processing and analyzing user interaction data. The pipeline is built using Apache Spark and follows a modern data lakehouse architecture with bronze, silver, and gold layers for optimal data processing and analytics.
- Infrastructure Introduction: https://www.loom.com/share/7c2753b699894fe7bf889276962cb4c8?sid=4139a172-693e-4c1b-a809-fb39da99f273
- First Data Analysis Implementation: https://www.loom.com/share/ad1622866fa846f89ecbbbea2a9f39c0?sid=c0bf155d-32bf-47dc-91bf-1305a8b22b59
- Data Optimization Strategies: https://www.loom.com/share/ae76d5d27a1c42eabe5f80a857ac0295?sid=1fd1336b-d60a-4832-9017-de9bc684835a
- Storage System: MinIO (S3-compatible storage)
- Data Format: Parquet (columnar storage)
- Partitioning Strategy:
- Interactions data: Partitioned by date
- User metadata: Partitioned by country
- Bronze Layer: Raw data ingested from CSV sources
- Silver Layer: Cleaned and transformed data in fact/dimension model
- Gold Layer: Pre-aggregated metrics and analytics
-
Efficient Data Storage
- Parquet format for columnar compression
- Date-based partitioning for quick data access
- Partition pruning during query execution
-
Incremental Processing
- Daily incremental updates instead of full reprocessing
- Lookback windows for handling period boundaries
- Partition-based writes for atomic updates
-
Performance Optimizations
- Pre-aggregated metrics in gold layer
- Broadcast joins for dimension tables
- Caching of frequently accessed DataFrames
- Daily Processing
etl = DataLakehouseETL()
metrics = etl.create_gold_layer(datetime.now().date())- Historical Backfill
etl.backfill_gold_metrics(
    start_date=datetime(2023, 1, 1).date(),
    end_date=datetime(2023, 12, 31).date(),
    parallel=True
)project_root/
├── data/ # Sample datasets and data artifacts
├── diagrams/ # Architecture and design diagrams
├── notebooks/ # Jupyter notebooks for analysis
├── profiles/ # Data profiling reports
├── spark/ # Spark configuration and deployment
└── scripts/ # Main processing scripts
01.data_generation.py: Generates sample datasets for development and testing02.data_profiling.py: Creates detailed data quality and statistics reports03.data_transformation.ipynb: Documents the ETL process and transformations04.data_optimization.ipynb: Performance optimization and tuning notebooks
- Contains sample datasets:
user_interactions_sample.csv: User activity datauser_metadata_sample.csv: User profile information
figures/: Generated diagrams in PNG formatplantuml/: Source files for architecture diagrams- Architecture diagrams illustrating:
- Data flow
- System components
- Processing stages
docker-compose.yaml: Containerization setup for the entire pipelinenotebooks/Dockerfile: Environment for Jupyter analysisspark/Dockerfile: Spark cluster configuration
Detailed analysis and development notebooks:
01.exploration.ipynb: Initial data exploration03.data_transformation.ipynb: ETL process documentation04.data_optimization.ipynb: Performance optimization studies
spark-defaults.conf: Spark configuration for optimal performancerequirements.txt: Python package dependencies
- Environment Setup
# Start the containers
docker-compose up -d

# Install dependencies
pip install -r requirements.txt- Running the Pipeline
# Generate sample data
python 01.data_generation.py

# Run data profiling
python 02.data_profiling.py
- Accessing Results
- Data profiles:
profiles/ - Analysis notebooks:
http://localhost:8888
-
Calculate Daily Active Users (DAU) and Monthly Active Users (MAU) for the past year:
- Define clear criteria for what constitutes an "active" user
An active user is defined based on the following criteria: - Any user who performs at least one interaction (page_view, edit, create, delete, share) within the measurement period - Duration of interaction must be valid (between 0 and 2 hours) - Duplicate interactions within the same timestamp are excluded- Implement a solution that scales efficiently for large datasets
1. Partitioning Strategy - Data is partitioned by date in the bronze layer - Enables efficient processing of daily increments - Supports parallel processing of different date partitions 2. Incremental Processing - Daily runs process only the latest partition - Monthly metrics are updated incrementally - Historical data remains immutable 3. Performance Optimizations - Efficient use of partitioning for data locality - Broadcast joins for dimension tables - Pre-aggregation of metrics for the gold layer- [Optional] Explain how you:
- Handle outliers and extremely long duration values, OR
- Describe challenges you might face while creating similar metrics and how you would address them
 Outlier Detection and Handling
 - Duration outliers: Filtered out interactions longer than 2 hours
 - Duplicate events: Removed using composite key deduplication
-
Calculate session-based metrics:
- Calculate metrics including:
- Average session duration
- Actions per session
- Define clear criteria for what constitutes a "session"
A session is defined based on the following criteria:
- A sequence of user interactions where the time gap between consecutive actions is less than 30 minutes
- Session starts with the first interaction or after a 30+ minute gap
- Session ends when either:
- No activity for 30+ minutes
- User day changes (midnight boundary)
- Last known interaction of the user
- Calculate metrics including:
