This repo is created as part of a tutorial / workshop series intended to ease programming beginners into the world of Shiny web apps.
The lecture is divided into 5 parts and its intended audience are absolute beginners in Shiny and web development in general.
Scripts are periodically updated to work with the file and data structure from CSSE: https://github.com/CSSEGISandData/COVID-19/tree/master/csse_covid_19_data/csse_covid_19_time_series
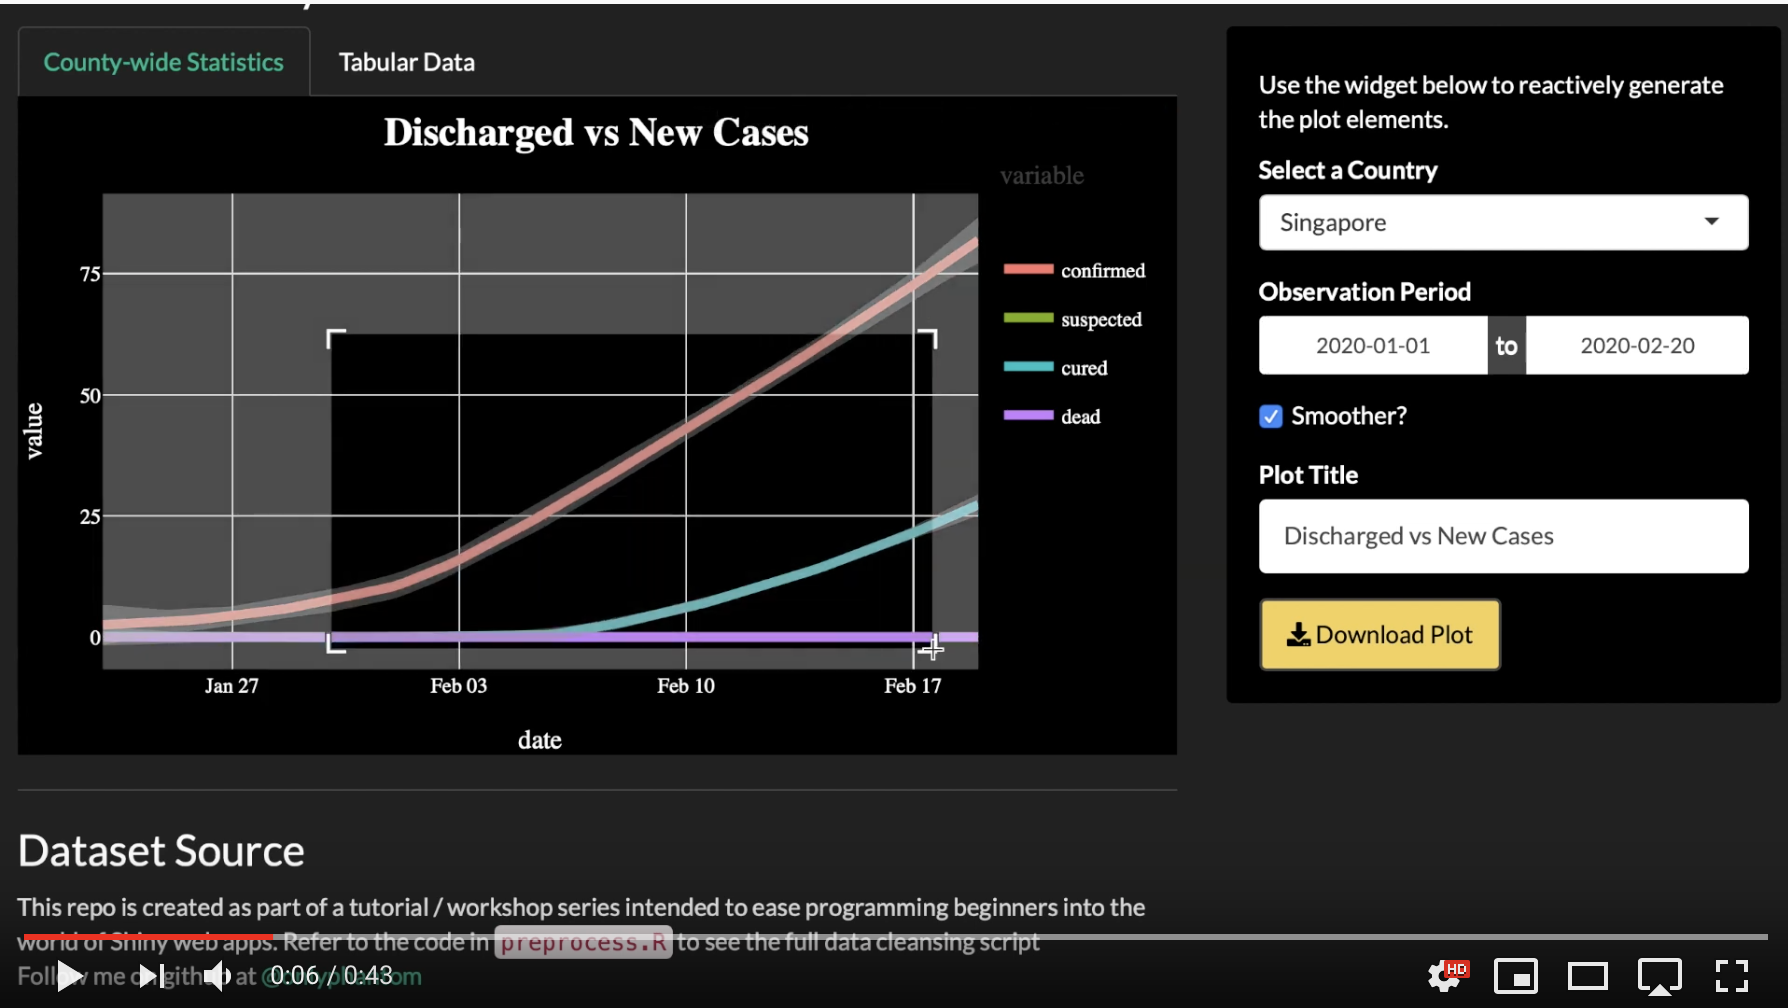
A preview of the app we're building:
The final variant of your web app (shiny_05) reads updated data from Novel Coronavirus (COVID-19) Cases, provided by JHU CSSE and offer the most up-to-date analytics on New Cases, Recovery and Deaths by country.
app.R: The code for your UI and Serverreader.R: Read data from JHU CSSE githubpreprocess.R: Clean and transform your data from a "wide" format to "long"darker.R: A custom ggplot2 theme I created for the sleek, modern, dark look
To keep the focus on the mechanics of Shiny, all of the data provided in this repo from variant 1 to varian 4 has been cleaned. Rather than spending 2 hours cleaning and reshaping data, you can invest that 2 hours into learning the features of Shiny. Variant 5 doesn't read from a static CSV file, but directly from the web source to ensure the most up-to-date data.
- Fork the DarkerShiny template and work your data into the darker template
- Attend a workshop on this topic (more details coming soon)
- Cheatsheet from RStudio
To use real-time data on the Corona virus epidemic, read from the end points below:
