Erlang telemetry collector
system_monitor is a BEAM VM monitoring and introspection application
that helps troubleshooting live systems. It collects various
information about Erlang processes and applications.
Unlike observer, system_monitor does not require
connecting to the monitored system via Erlang distribution protocol,
and can be used to monitor systems with very tight access
restrictions.
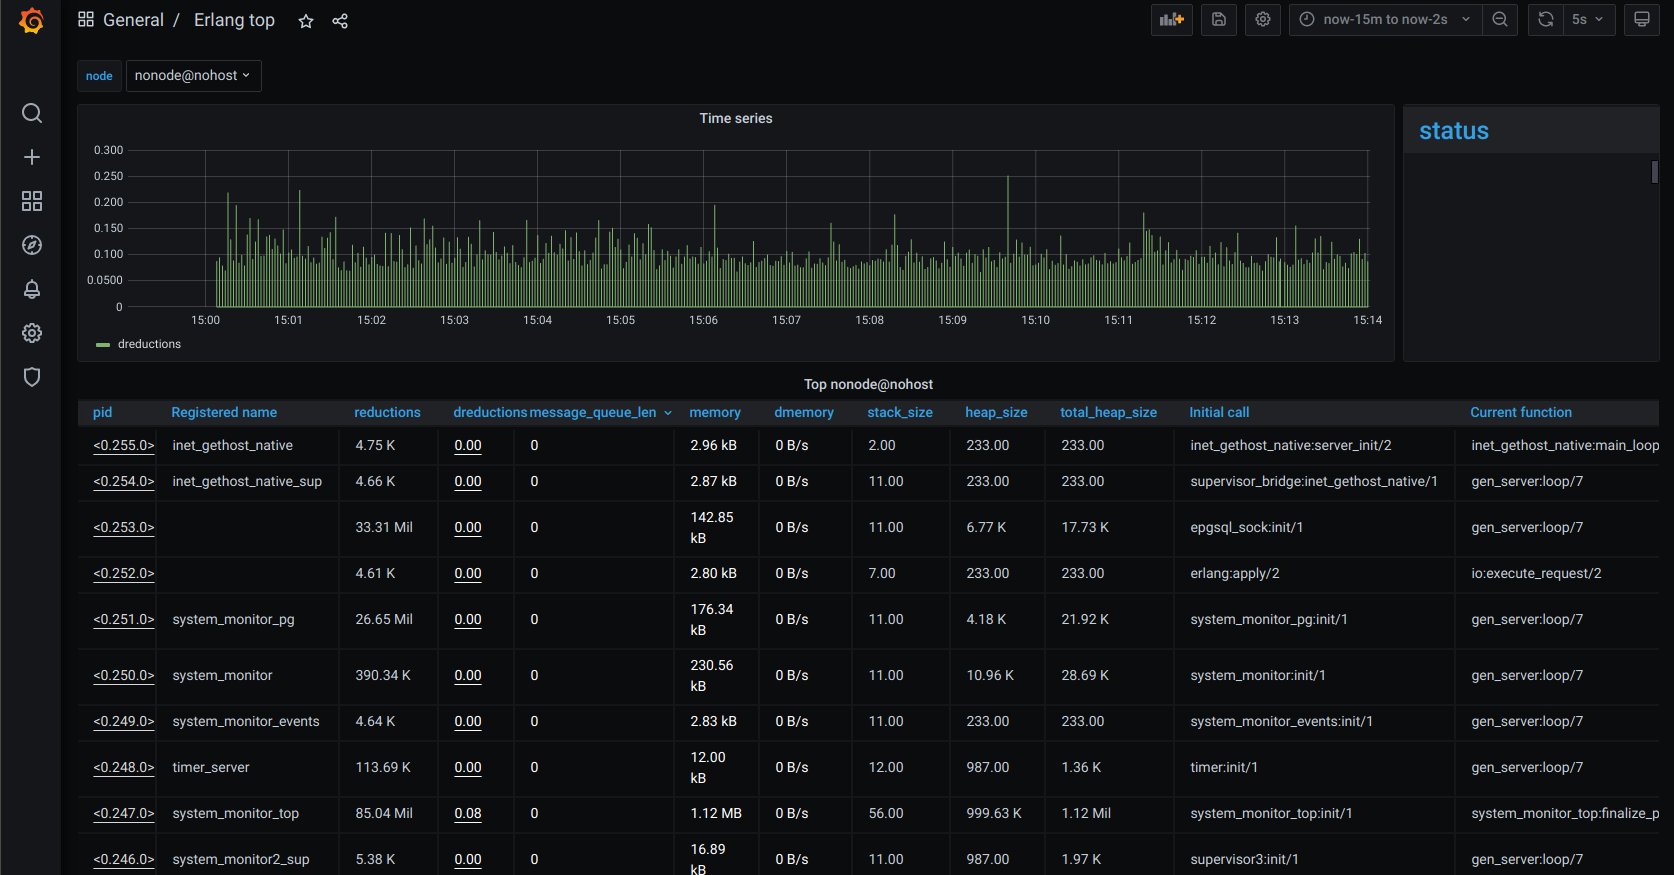
Information about top N Erlang processes consuming the most resources (such as reductions or memory), or have the longest message queues, is presented on process top dashboard:
Historical data can be accessed via standard Grafana time
picker. status panel can display important information about the
node state. Pids of the processes on that dashboard are clickable
links that lead to the process history dashboard.
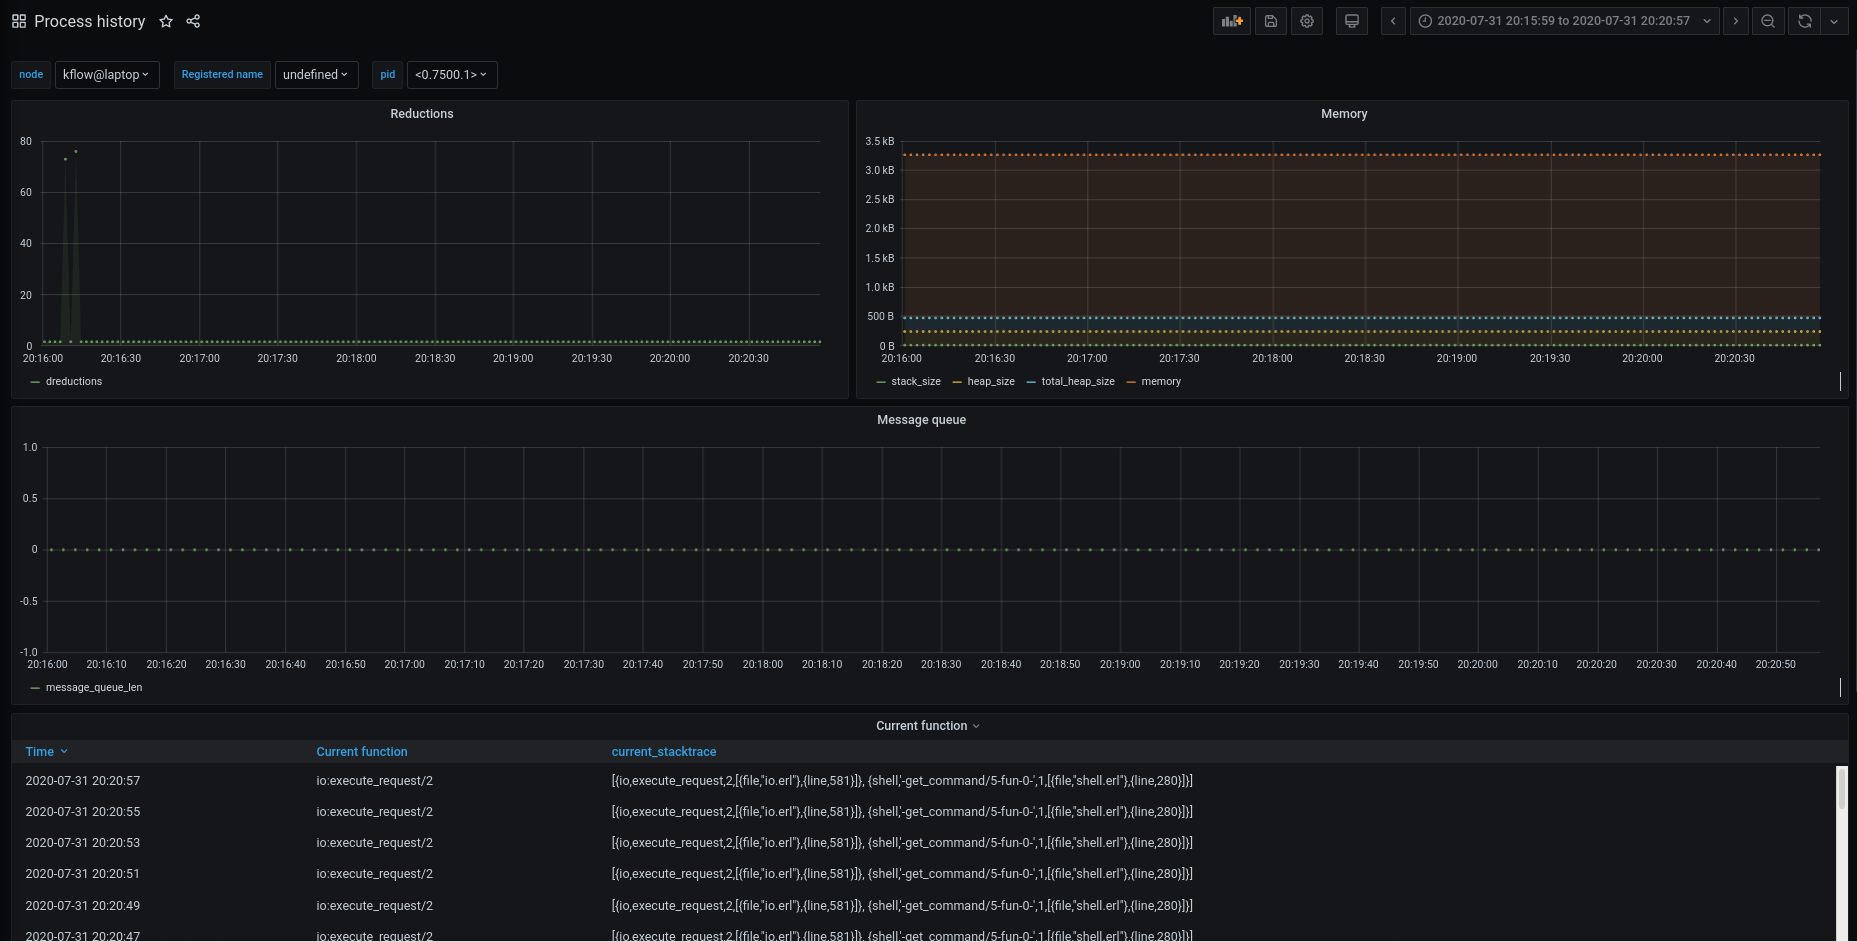
Process history dashboard displays time series data about certain Erlang process. Note that some data points can be missing if the process didn't consume enough resources to appear in the process top.
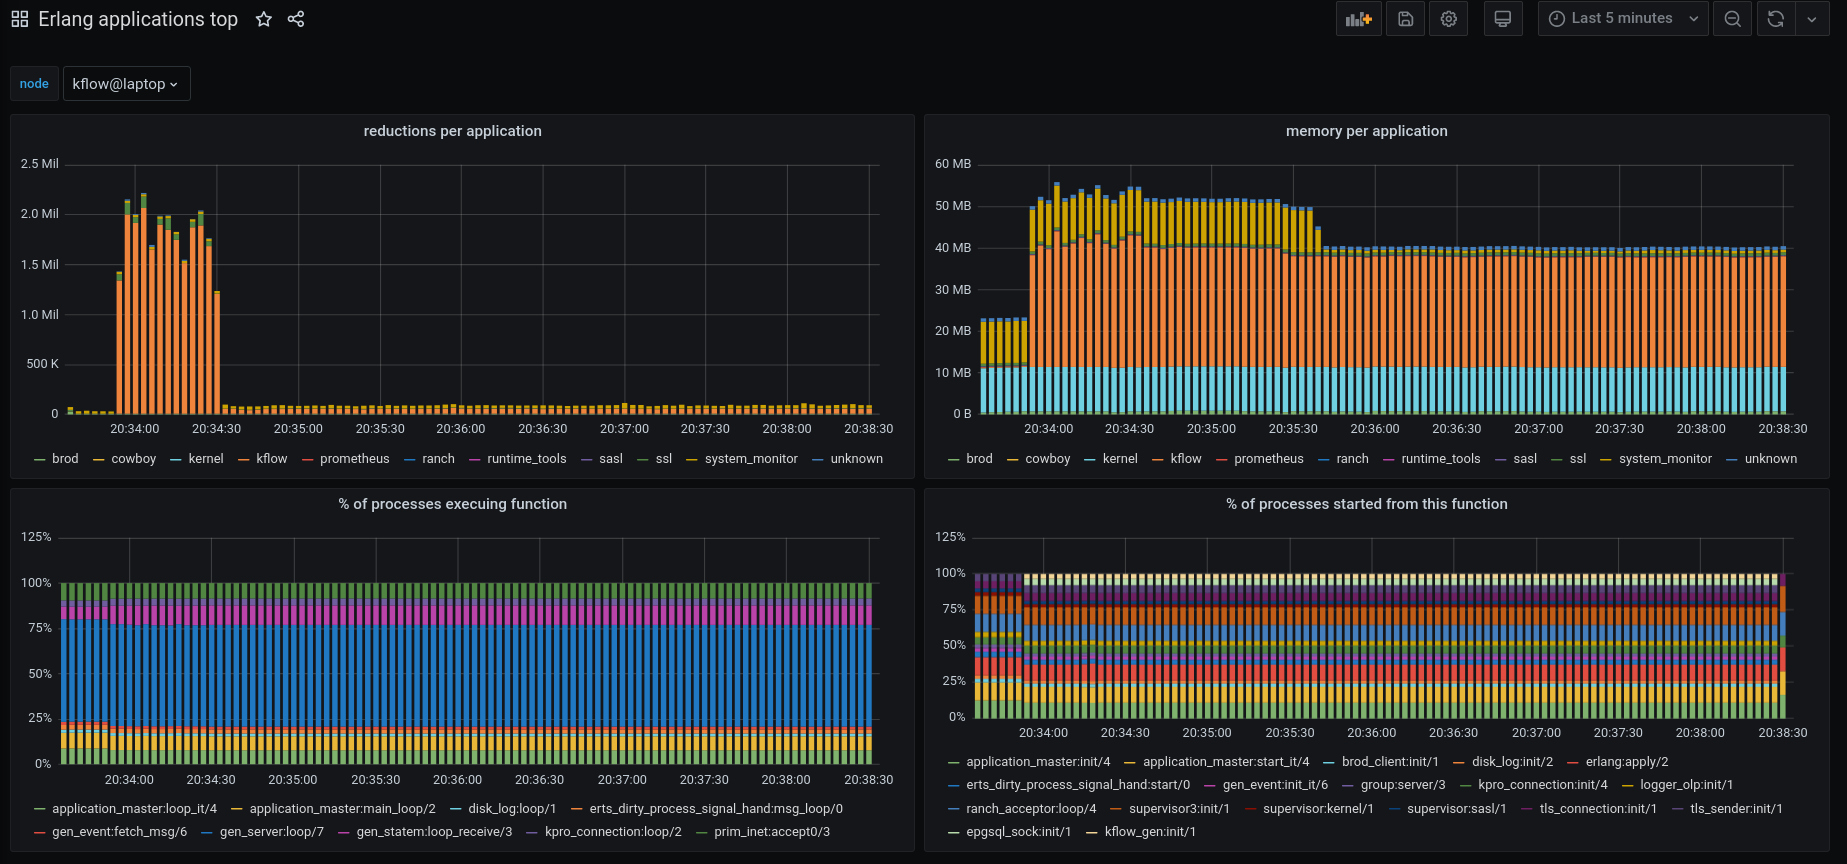
Application top dashboard contains various information aggregated per OTP application.
In order to integrate system_monitor into your system, simply add it
to the release apps. Add the following lines to rebar.config:
{deps, [..., system_monitor]}.

{relx,
 [ {release, {my_release, "1.0.0"},
    [kernel, sasl, ..., system_monitor]}
]}.system_monitor can export arbitrary node status information that is
deemed important for the operator. This is done by defining a callback
function that returns an HTML-formatted string (or iolist):
-module(foo).

-export([node_status/0]).

node_status() ->
  ["my node type<br/>",
   case healthy() of
     true  -> "<font color=#0f0>UP</font><br/>"
     false -> "<mark>DEGRADED</mark><br/>"
   end,
   io_lib:format("very important value=~p", [very_important_value()])
  ].
This callback then needs to be added to the system_monitor application environment:
{system_monitor,
   [ {node_status_fun, {foo, node_status}}
   ...
   ]}
More information about configurable options is found here.
System_monitor will spawn several processes that handle different states:
system_monitor_topCollects a certain amount of data from BEAM for a preconfigured number of processessystem_monitor_eventsSubscribes to certain types of preconfigured BEAM events such as: busy_port, long_gc, long_schedule etcsystem_monitorRuns periodically a set of preconfiguredmonitors
check_process_countLogs if the process_count passes a certain thresholdsuspect_procsLogs if it detects processes with suspiciously high memoryreport_full_statusGets the state fromsystem_monitor_topand produces to a backend module that implements thesystem_monitor_callbackbehavior, selected by bindingcallback_modin thesystem_monitorapplication environment to that module. Ifcallback_modis unbound, this monitor is disabled. The preconfigured backend is Postgres and is implemented viasystem_monitor_pg.
system_monitor_pg allows for Postgres being temporary down by storing the stats in its own internal buffer.
This buffer is built with a sliding window that will stop the state from growing too big whenever
Postgres is down for too long. On top of this system_monitor_pg has a built-in load
shedding mechanism that protects itself once the message length queue grows bigger than a certain level.
A Postgres and Grafana cluster can be spun up using make dev-start and stopped using make dev-stop.
Start system_monitor by calling rebar3 shell and start the application with application:ensure_all_started(system_monitor).
At this point a grafana instance will be available on localhost:3000 with default login "admin" and password "admin" including some predefined dashboards.
For production, a similar Postgres has to be setup as is done in the Dockerfile for Postgres in case one chooses to go with a system_monitor -> Postgres setup.
See our guide on contributing.
See our changelog.
Copyright © 2020 Klarna Bank AB
For license details, see the LICENSE file in the root of this project.


