- Table of Contents
- Cloud-Native Application Resource Estimation - Part 1: Concepts
- Cloud-Native Application Resource Estimation - Part 2: Process
- Resource Estimation Setup
- Resource Estimation Process
- Todo Application Deployment and Tools Setup
- Designing the Load Testing Plan
- Test Script Execution, Performance, and Resource Monitoring
- Conclusion
As a developer or an Architect, one of the first decisions you need to make when deploying an application to the cloud (whether public, private or on-prem) is to determine how much memory and CPU resources the application needs. More often, teams get their applications to production before realizing the resources the application needs are either under or over estimated, which often leads to fire fighting in the production environment. Most of the operational challenges faced in production are because this process is often overlooked.
The benefits of properly estimating the resources an application needs before getting to production, among others are:
- It helps in understanding application requirements in terms of how much memory and CPU the application needs
- It helps to understand whether an application is more memory intensive or CPU intensive.
- It simplifies the carving of resources on Openshift/Kubernetes, which in turn simplifies the creation of quotas and limits for the application namespace.
- It allows capacity planning from operations perspective; for instance, a cluster administrator can easily determine how many worker nodes is required to run workloads in the cluster.
- It leads to substantial cost savings, especially if your the kubernetes cluster is in the public cloud infrastructure.
Estimating the resources an application needs is very challenging to be honest, it involves some trial and error. Identifying accurately how many resources a container, for instance, will require, and how many replicas a service will need at a given time to meet service-level agreements takes time and effort; hence the process is more of an art than science. You’ll first want to identify a good starting point for the application; aiming for a good balance of CPU and memory. After you’ve decided on a suitable resource size for the application, you will also need to set up a process where you can constantly monitor the application's resource actual usage over a period of time.
In this workshop, we'll be walking you through how to properly estimate your application resources in terms of memory and CPU. At the end of this 2 part article, we will come up with Table 1, which can be used to create the resource quota for the application namespace.
| Application | # of Pods | mem. req/pod | mem. lim/Pod | Total mem req | Total mem lim | CPU req/Pod | CPU lim/Pod | Total CPU req | Total CPU lim |
|---|---|---|---|---|---|---|---|---|---|
| Todo Application | 2 | 512Mi | 768Mi | 1024Mi | 1536Mi | 576m | 692m | 1152m | 1384m |
| Postgesql | 1 | 512Mi | 512Mi | 512Mi | 512Mi | 200m | 200m | 200m | 200m |
| . | |||||||||
| Margin to Deploy | 256Mi | 256Mi | 256Mi | 256Mi | 100m | 100m | 100m | 100m | |
| Total | 3 | 1,280Mi | 1,536Mi | 1792Mi | 2304Mi | 876m | 992m | 1452m | 1684m |
| Resource Quota | 3 | 1792Mi | 2304Mi | 1452m | 1684m |
Table 1
Before we dive into codes, let's define some concepts.
Compute resources are measurable quantities that can be requested, allocated, and consumed. These are different from API resources such as Pods, Services, Routes, etc that are accessible and modified through the Kubernetes/Openshift API server.
There are two types of Compute resources:
-
Compressible resources: these are resources that are technically available in limited quality in a given time slice; however, there is an unlimited amount of them if you can wait. Examples of this type of resource are CPU, block i/o, and network i/o. With respect to application resource estimation, we will focus on CPU. Once an application hits the CPU limits allocated, the application starts throttling, which adversely leads to performance degradation. Openshift/Kubernetes will not terminate those applications.
-
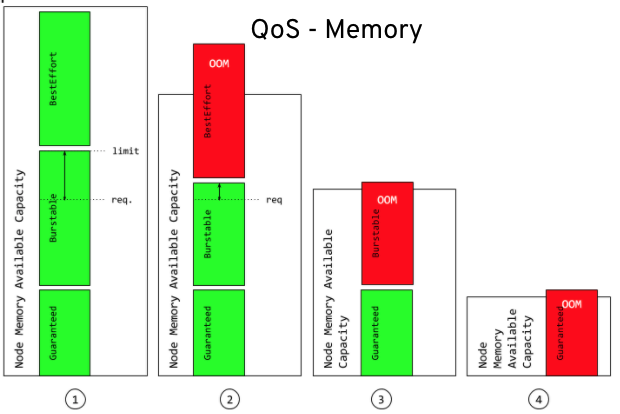
Incompressible resources: these are technically limited resources; once you run out of them, your application will not get any more. Examples of such are memory and disk space. Unlike CPU, memory can't be made to run slower. Instead, Openshif/Kubernetes automatically restarts or terminates the applications once it reaches the memory limit.
Therefore, an Architect needs to put these behaviours into consideration during application resource planning to avoid any issues in production.
-
CPU: - CPU resources are measured in millicore. If a node has two cores, the node’s CPU capacity would be represented as 2000m. The unit suffix m stands for “thousandth of a core.”
-
Memory: Memory, on the other hand, is measured in bytes. However, you can express memory with various suffixes (E,P,T,G,M,K and Ei, Pi, Ti, Gi, Mi, Ki) to express mebibytes (Mi) to petabytes (Pi). Most simply use Mi.
...
spec:
   containers:
   - image: quay.io/ooteniya/todo-spring:v1.3.6
       imagePullPolicy: Always
       name: todo-spring
       resources:
       limits:
           memory: "512Mi"
           cpu: "60m"
       requests:
           memory: "128Mi"
           cpu: "30m"
...
Here's an example of a Container with a request of 30m cpu and 128MiB of memory. The Container has a limit of 60m cpu and 512MiB of memory.
A resource quota, provides constraints that limit aggregate resource consumption per project. It can limit the quantity of objects that can be created in a project by type, as well as the total amount of compute resources and storage that resources might consume in that project. It is defined by a ResourceQuota object.
Below snippet defines a resource quota object on cpu and memory.
apiVersion: v1
kind: ResourceQuota
metadata:
 name: compute-resources
spec:
 hard:
   pods: "4"
   requests.cpu: "1"
   requests.memory: 1Gi
   requests.ephemeral-storage: 2Gi
   limits.cpu: "2"
   limits.memory: 2Gi
   limits.ephemeral-storage: 4Gi
This is usually defined to limit how many resources a single tenant in a multitenant environment can request so that they don't take over the cluster. This is evaluated at Request Time.
...
containers:
   - image: quay.io/ooteniya/todo-spring:v1.3.6
       imagePullPolicy: Always
       name: todo-spring
       resources:
       limits:
           memory: "512Mi"
           cpu: "60m"
       requests:
           memory: "128Mi"
           cpu: "30m"
...
Requests are evaluated at Scheduling Time and it's counted towards the quota. Limits in turn are evaluated at Run Time and it's not counted towards the quota.
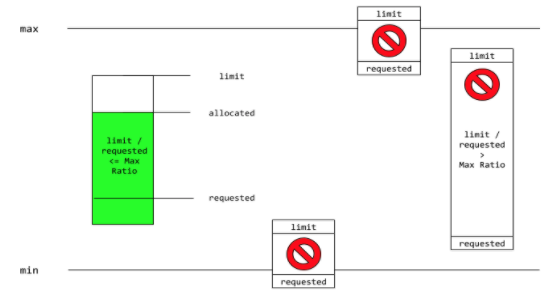
A limit range restricts resource consumption in a project. You can set specific resource limits for a pod, container, image, image stream, or persistent volume claim (PVC) in the project. It is defined by a LimitRange object.
apiVersion: "v1"
kind: "LimitRange"
metadata:
 name: "resource-limits"
spec:
 limits:
   - type: "Container"
     max:
       cpu: "2"
       memory: "1Gi"
     min:
       cpu: "100m"
       memory: "4Mi"
     default:
       cpu: "300m"
       memory: "200Mi"
     defaultRequest:
       cpu: "200m"
       memory: "100Mi"
     maxLimitRequestRatio:
       cpu: "10"
When Request and Limit are not set for a container, whatever the administrator for the namespace defines is used as the default. It is strongly recommended that application Architects and developers always specify resource requests and limits for their pods.
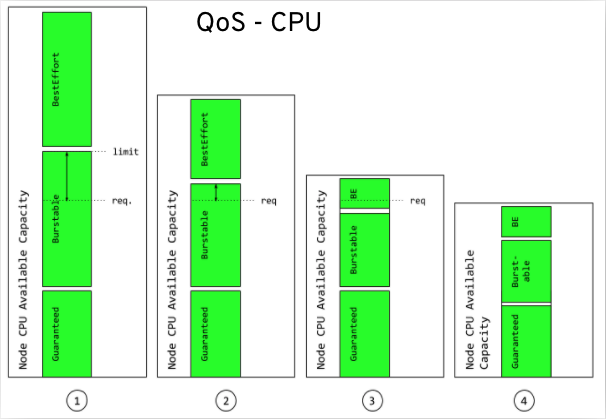
In an overcommitted environment, i.e. a situation where the scheduled pod has no request, or the sum of limits across all pods on that node exceeds available machine capacity, the node must give priority to one pod over another. The mechanism that is used to determine which pod to prioritize is known as Quality of Service (QoS) Class.
There are three classes:
- A BestEffort quality of service is provided when a request and limit are not specified.
- A Burstable quality of service is provided when a request is specified that is less than an optionally specified limit
- A Guaranteed quality of service is provided when a limit is specified that is equal to an optionally specified request.
QoS behavior with respect to CPU
In terms of priority, the Guaranteed, Burstable, and BestEffort have priority 1 (highest), priority 2, and priority 3 (lowest), respectively.
QoS behavior with respect to Memory
As mentioned, the request set on a pod is counted towards the quota. To determine whether an application is well estimated, underestimated or overestimated depends on comparing resource requests and the actual resource consumption.
Generally, a certain threshold is set above and below the request to determine how an application performs resource-wise. Let's assume a certain percentage threshold, say 20% of the request, is set above and below the request. A well-estimated application resource usage stays above the overestimated threshold and below the underestimated threshold. If the actual usage of the resource is below the overestimated threshold, the application is considered Overestimated. If the actual usage is above the underestimated threshold, it is considered underestimated. Raffaele Spazzoli wrote a very nice article about this.
Now that we have a very good understanding of some concepts that Openshift/Kunbernetes uses to determine an application resources and how they are scheduled, let's discuss the approach to use in order to estimate an application’s resource requirments properly.
Compute Resource Estimation Approach
-
Don’t optimize before you know it’s necessary - You need to define how fast your application code has to be, for example, by specifying a maximum response time for all API calls or the number of records that you want to import within a specified time frame—measure which parts of your application are too slow and need to be improved.
-
Use a profiler to find the real bottleneck - There are two ways of doing this. It's either you can take a look at your code and start with the part that looks suspicious or where you feel that it might create problems or use a profiler and get detailed information about each part of your code’s behavior and performance. The profiler-based method gives you a better understanding of the performance implications of your code. It allows you to focus on the most critical parts.
-
Use lightweight frameworks and avoid heavy application servers overhead - Use lightweight frameworks and avoid the overhead of heavy application servers if possible. Use frameworks that are based, for instance, on microprofiles instead of heavy JEE Compliant application servers.
-
Create a performance test suite for the whole application. It’s essential to do a performance or load tests on an application to determine the application’s breaking point etc. Based on the result of the test, work on the most significant performance problem first.
-
Work on the most significant bottleneck first - It might be tempting to start with the quick wins because you will be able to show the first results soon. Sometimes, that might be necessary to convince other team members or your management that the performance analysis was worth the effort. But in general, I recommend starting at the top and begin work on the most significant performance problem first.
-
Use Efficient Serialization Techniques - Use efficient serialization formats like protocol buffers, commonly used in gRPC. Another areas to consider for example is, if you have a request with a large message payload and operates on only a handful of fields in a large message payload, before passing it to a downstream service, put those fields into headers so the service does not need to deserialize or reserialize the payload.
Load testing will identify the following:
- maximum operating capacity
- the ability of an application to run in the actual environment
- sustainability of the application during peak user load
- maximum concurrent users the application can support
Perform application load testing to determine the right amount of memory and CPU for an application to function properly at all times. There are several tools such as WedLoad, Apache JMeter, LoadNinja, Smart Meter, k6, Locust etc. available to aid this process.
Openshift/Kubernetes scaling capabilities provide a mechanism to adjust to user workloads dynamically. Scaling can be manual or automatic. For workloads that are static or when you have insight into when an application experience spikes, manual scaling can be used to provide optimal configuration to match the workload. Also, it provides an avenue to discover and apply the optimal configuration to handle the workload. This can be done imperatively using the oc or kubectl commands. Alternatively, it could also be done declaratively on the deployment or deploymentConfig objects of the application.
For workloads that experience sudden spikes, automatic scaling is the most ideal as you can not readily predict the spike periods.
Scaling can be Horizontal i.e. changing the replica of a pod, or Veritcal, changing the resource constraints of the containers in the pod.
In summary, it is crucial to follow the recommendation below to arrive at a very good application resource estimate:
-
Perform load testing
-
Ensure that you set memory and CPU for all pods.
-
Start with manual scaling until you understand your application profile on Openshift.
-
Use VPA in Development to determine your application resource usage.
-
Use the HPA for workloads that are variable and that have unexpected spikes in their usage.
- 11 Simple Java Performance Tuning Tips – Stackify
- Best Website Performance Testing Tools – Stackify
- How Full is My Cluster - Part 3: Capacity Management
- O'reilly Kubernetes Best Practices
- Eric Deandrea for the original Todo-spring-quarkus application.
- Ed Seymour for the QoS and Limit Range diagrams
In the first part of this article, we touched on application resource estimation concepts and approaches. In this second part, we will be walking you through a practical example of estimating the resources an application needs.
In this workshop, we will be determining the resource requirement of a Todo-spring-quakus application which was initially set up by Eric Deandrea but customized to fit the purpose of this workshop.
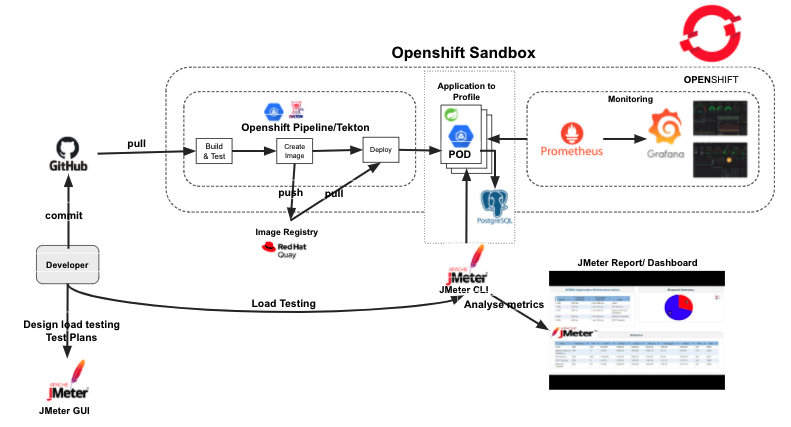
The Architecture diagram below highlights the key components we will be using for the estimation process.
For this workshop, you will need the following:
- Access to Openshift Cluster
- Install Openshift Pipeline Operator
- Install a Postgresql database for the To-do application
- Install Vertical Pod Autoscaler Operator
- Access to an external image registry (we use https://quay.io for this workshop)
- Create a secret for pulling images from the image registry
- Create a secret for Github
- Add the registry and Github secret to Openshift pipeline service account
- Download Apache JMeter for Performance testing
We will use a script to set up the environment. You will need the following tools pre-installed when you run the script.
- tkn (optional Tekton CLI):
tknversion download Red Hat Build - envsubst (gettext):
envsubst--help
To get started, clone or fork the source code repository:
$ git clone https://github.com/ooteniya1/resource-estimation.git
Once you have all the enviroment set up, login to your Openshift cluster.
$ oc login --token=TOKEN --server=https://api.YOUR_CLUSTER_DOMAIN:6443
Create resource-estimation namespace.
$ oc new-project resource-estimation
Run the setup scripts to install the Openshift-pipeline, Postgresql and VerticalPodAutoscaler operators.
$ cd helm
$ ./setup-prereq.sh
You should see output similar to below:
Installing openshift-pipelines operator
Release "openshift-pipelines" has been upgraded. Happy Helming!
NAME: openshift-pipelines
LAST DEPLOYED: Tue Mar 16 20:59:36 2021
NAMESPACE: resource-estimation
STATUS: deployed
REVISION: 1
TEST SUITE: None

Installing postgresql Operator
Release "postgresql" does not exist. Installing it now.
NAME: postgresql
LAST DEPLOYED: Tue Mar 16 20:59:42 2021
NAMESPACE: resource-estimation
STATUS: deployed
REVISION: 1
TEST SUITE: None

Installing vertical pod autoscler
Release "vertical-pod-autoscaler" does not exist. Installing it now.
NAME: vertical-pod-autoscaler
LAST DEPLOYED: Tue Mar 16 20:59:42 2021
NAMESPACE: resource-estimation
STATUS: deployed
REVISION: 1
TEST SUITE: None
Now that we have Openshift-pipeline, postresql and vertical pod autoscaler operators installed, let's set up Github and quay.io secrets and add them to Openshift-pipeline service account.
$ ./add-github-credentials.sh
$ ./add-quay-credentials.sh
To estimate the resource requirements and determine the resource quota to use for the Todo-spring-quarkus namespace, we will go through the following steps:
- Define performance goals.
- Check the start-up time. This is important for scaling in peak periods.
- Adjust to have a fast start-up time initially.
- What is the best resource requirement for the startup time I need?
- Not applicable to every use case
- What’s my breakpoint with one pod - Note the resource usage.
- Is the breakpoint lower than my desired performance target?
- How many replicas do I need to start with to achieve the desired desired performance target?
- What’s the resource required to achieve the desired throughput with a typical workload? (You need to run this for a period of time say one day to one week)
- What’s the resource requirement to cope with spikes and "Black Friday" requests?
- Estimate the resource usage per pod/container
- Use that to determine your quota
Before we go through the processes outlined above, let's prepare the application and the tools.
These steps build on the previous setup steps. Make sure the steps below have been successfully completed.
$ cd helm
$ ./setup-prereq.sh
$ ./add-github-credentials.sh
$ ./add-quay-credentials.sh
The Todo application uses the tekton-pipeline/todo-pipeline.yaml to build and deploy to Openshift. The application can be deployed as a Quarkus or Spring Boot application. We will be using the Spring Boot version.
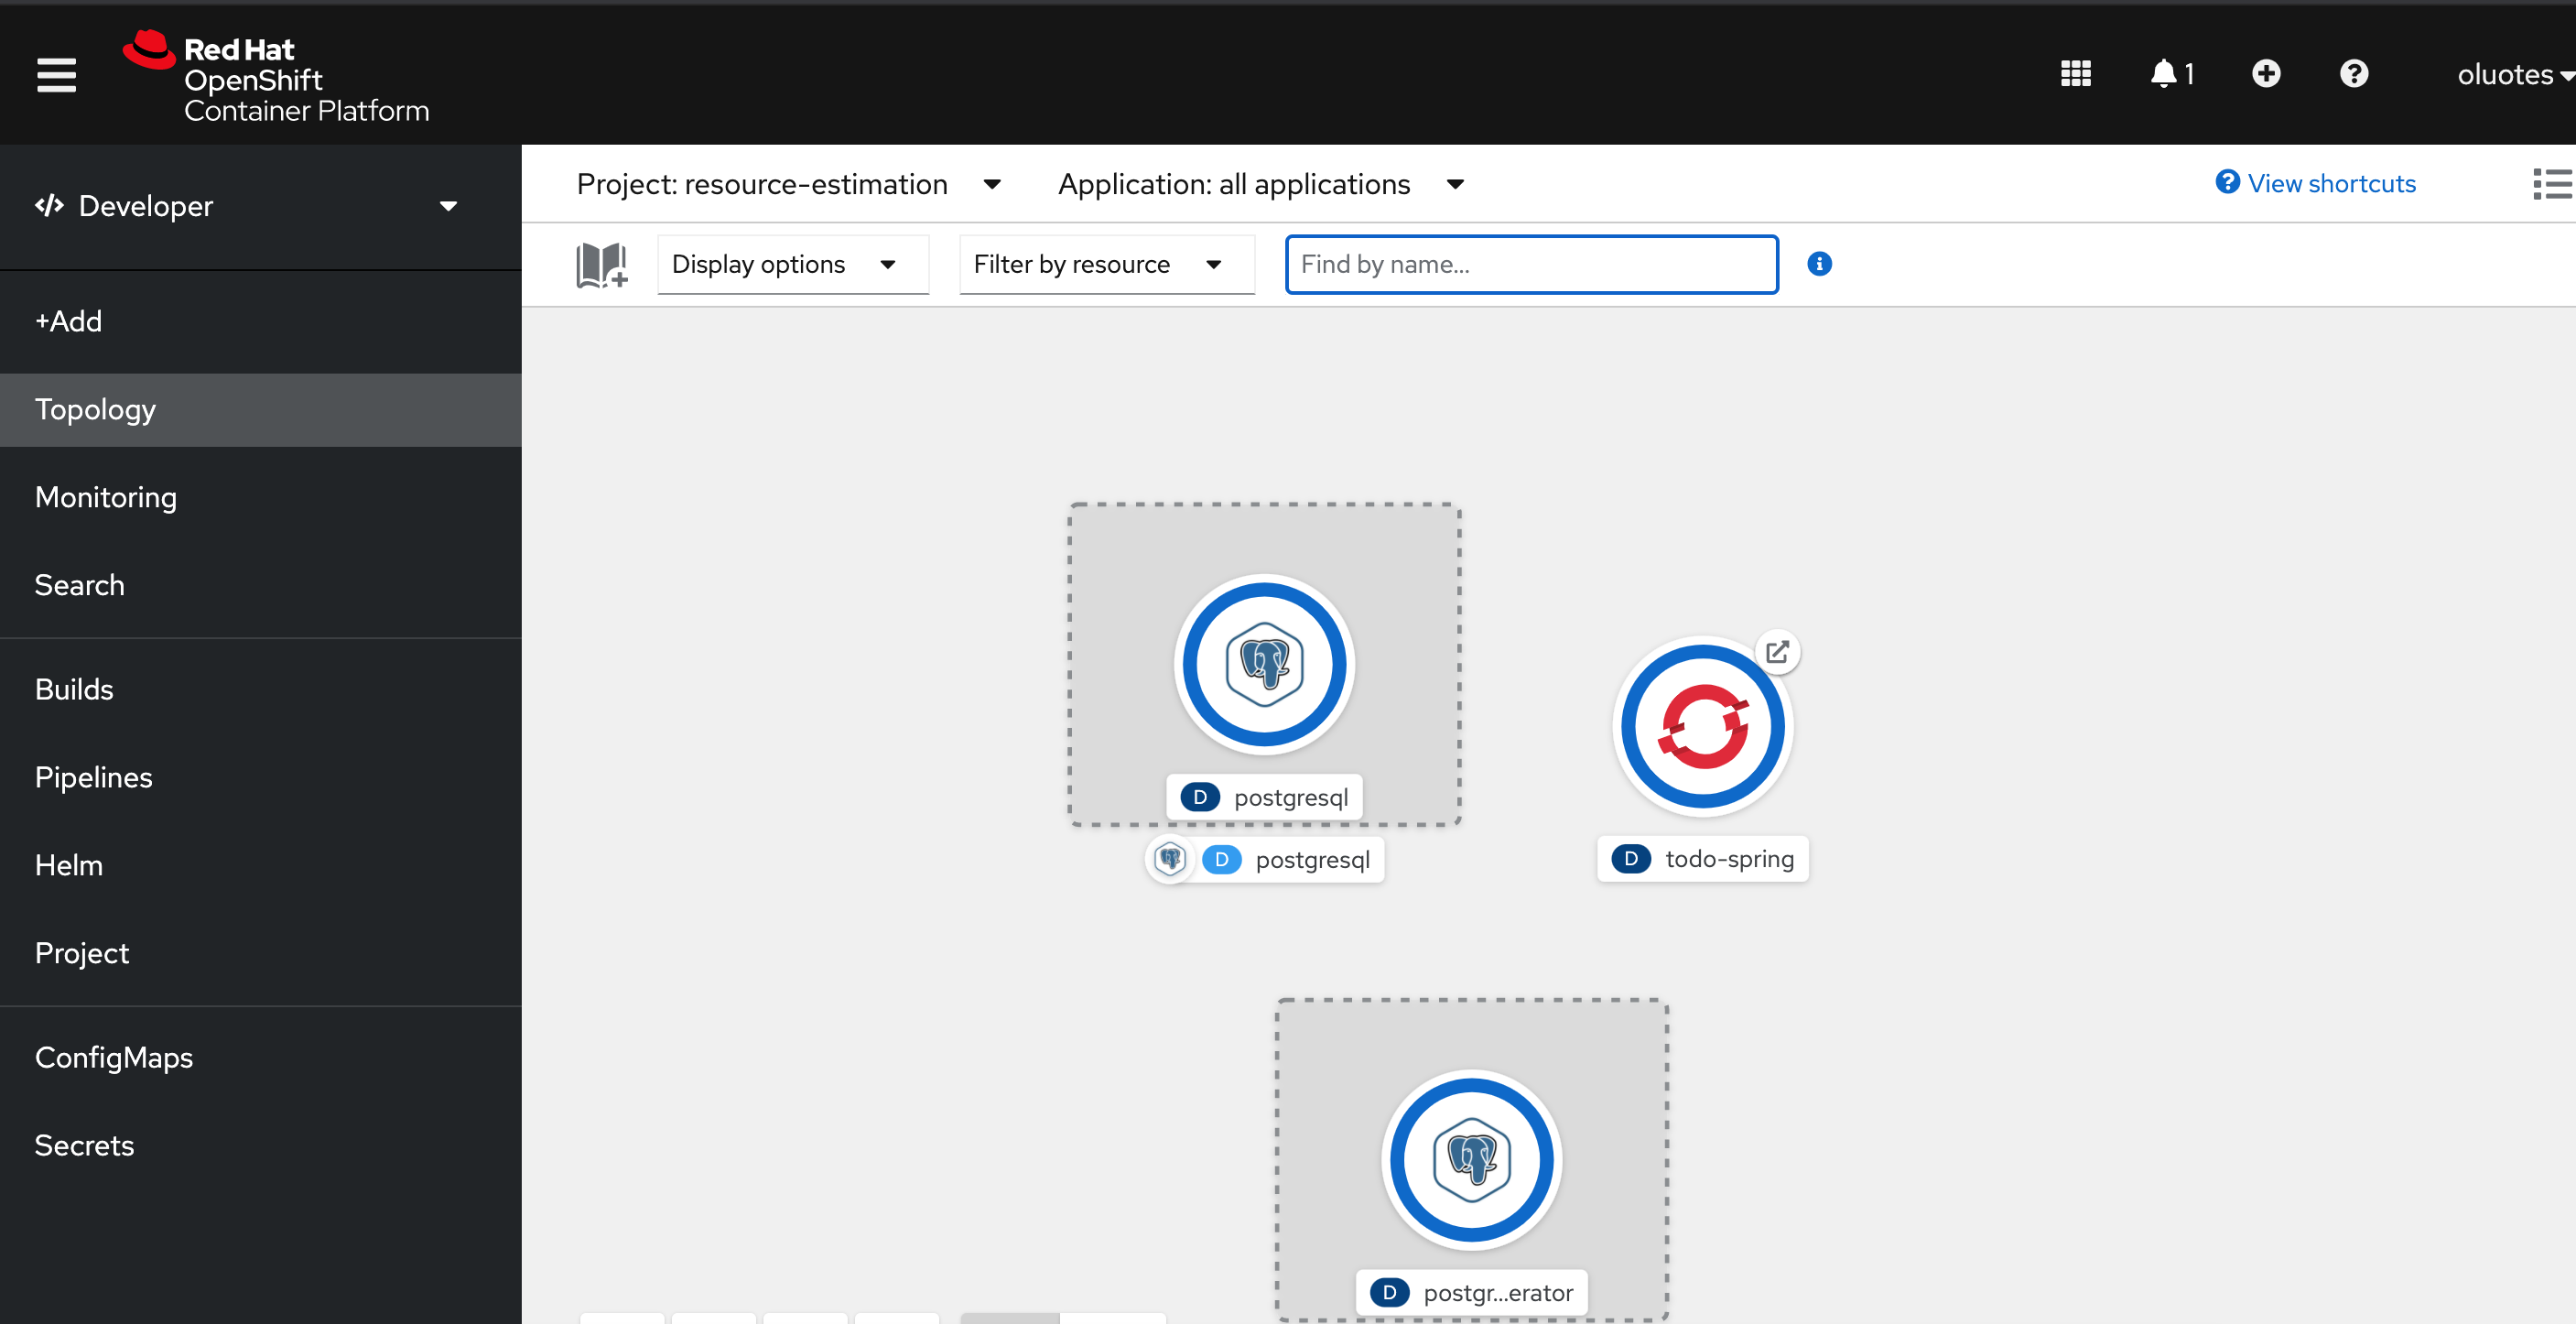
Before then, let's install the PostgreSQL database the application uses.
$ oc apply -f ../todo-spring-quarkus/k8s/postgresql-instance.yaml
database.postgresql.dev4devs.com/postgresql created
Deploy the application
$ cd tekton-pipeline
$ ./build-deploy-todo-spring v1.3.8
This will build the application, tag the created image as v1.3.8 , push to https://quay.io and from there deploy to Openshift.
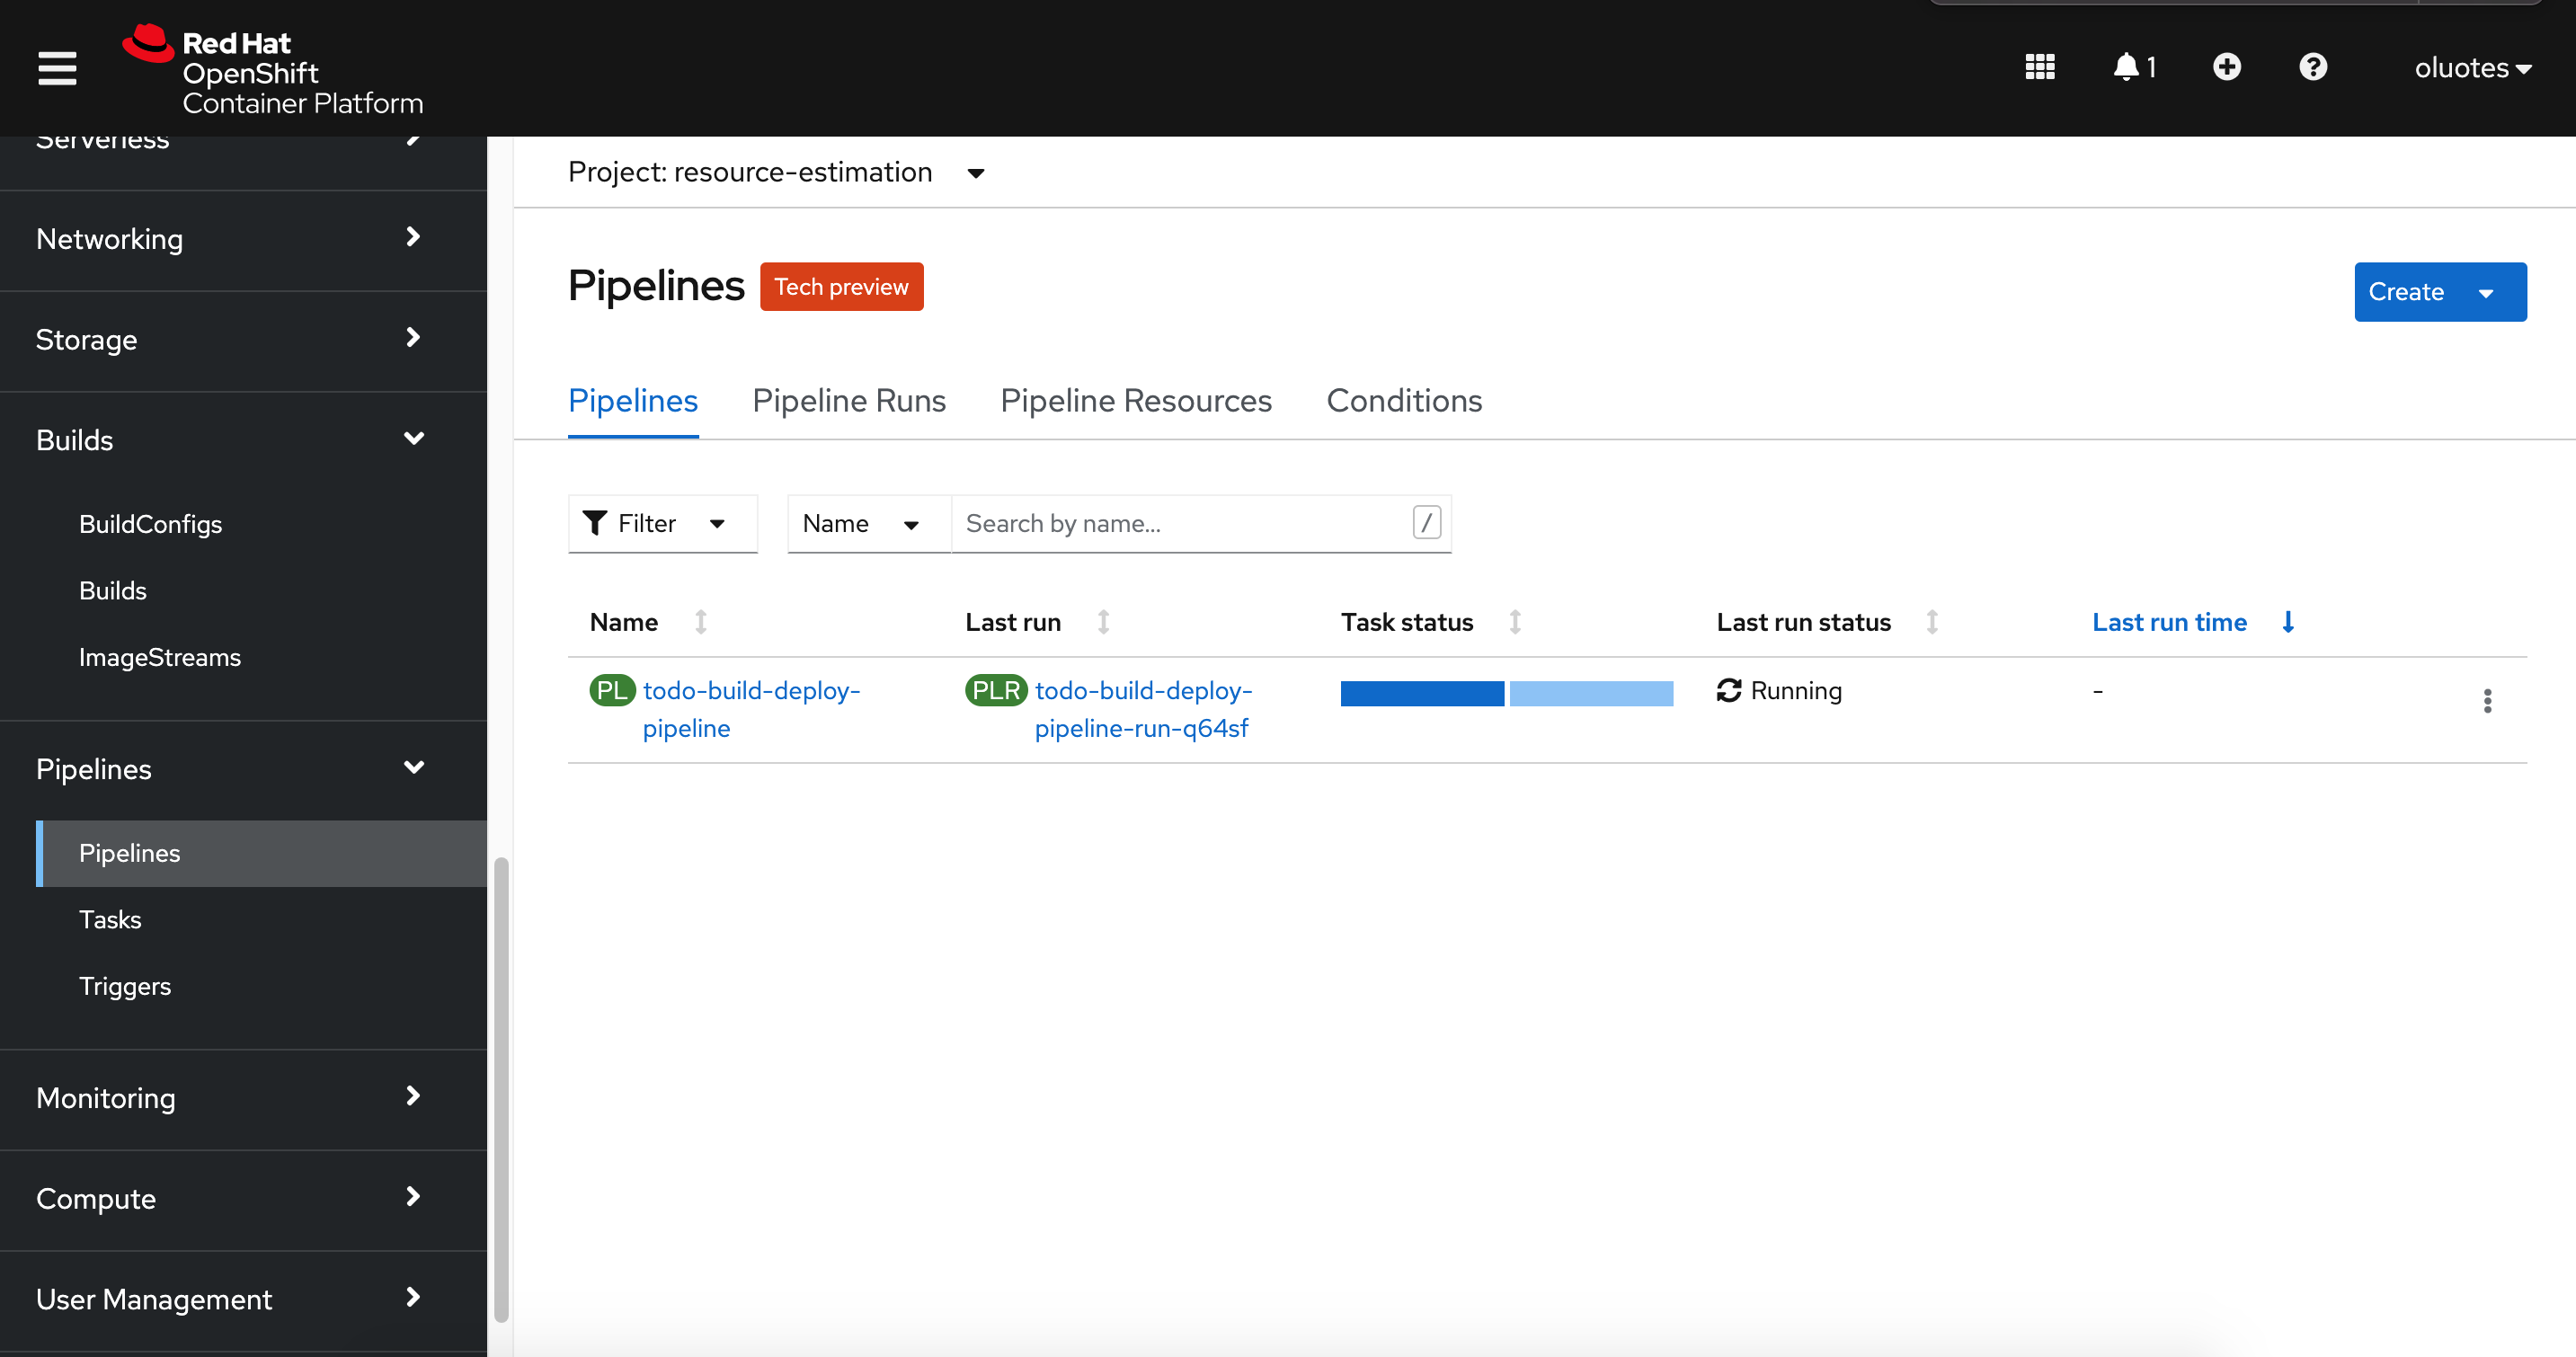
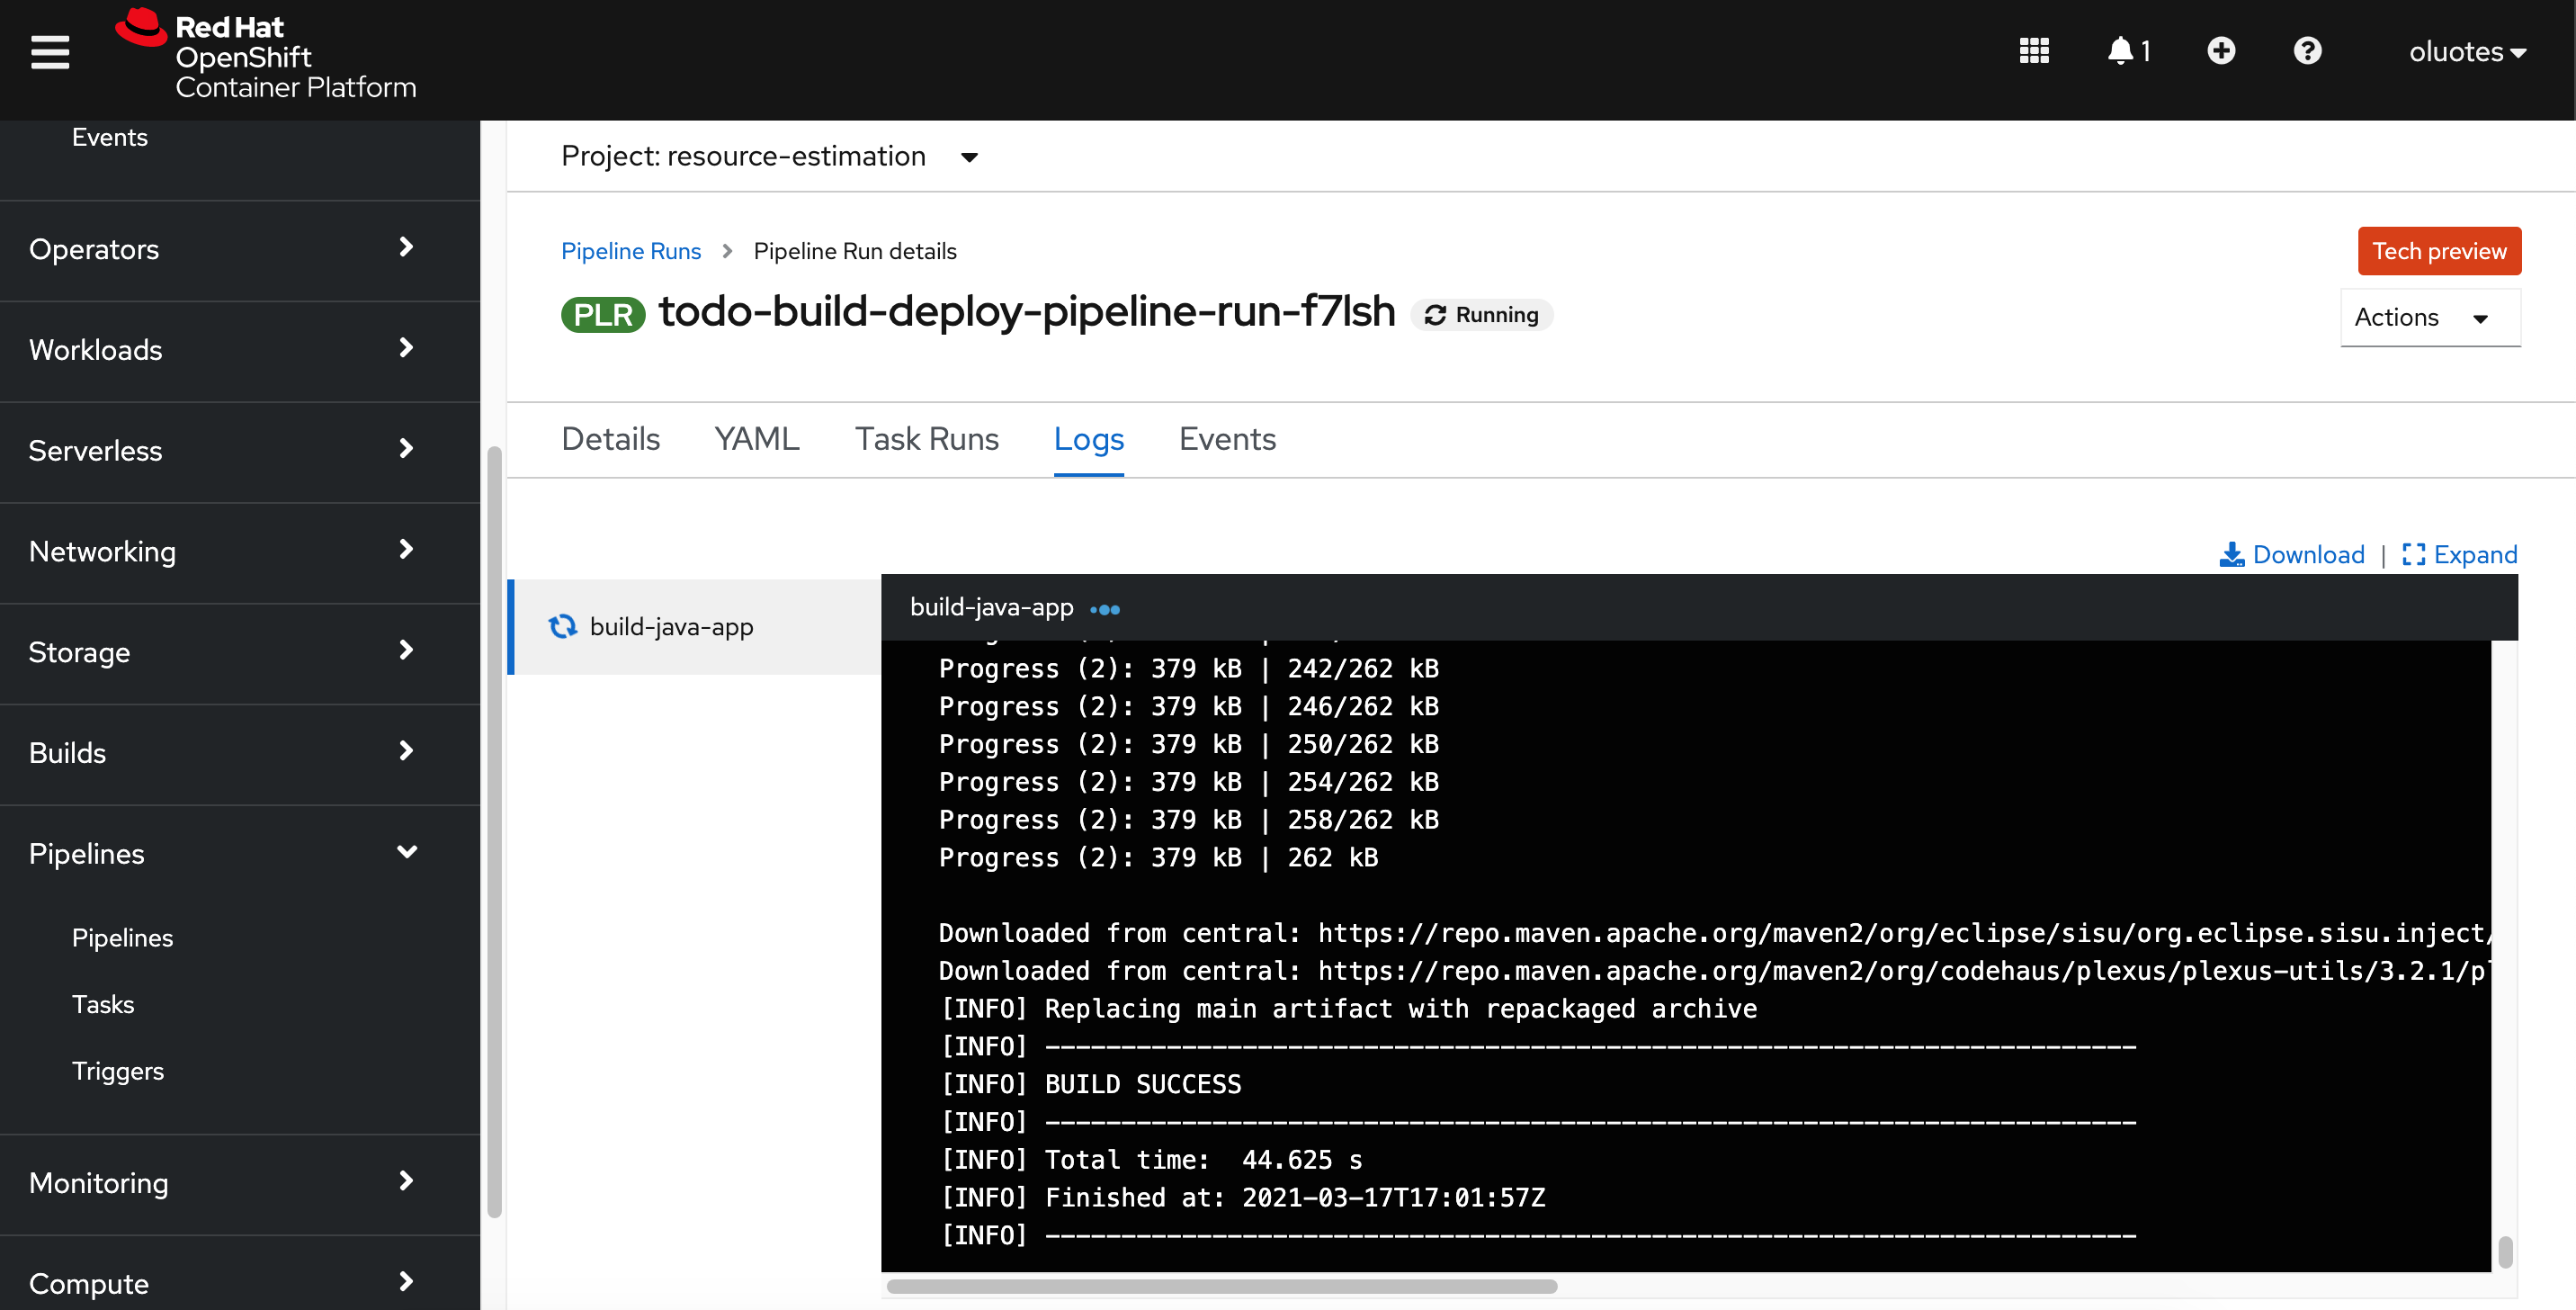 Openshift pipeline - Build Step
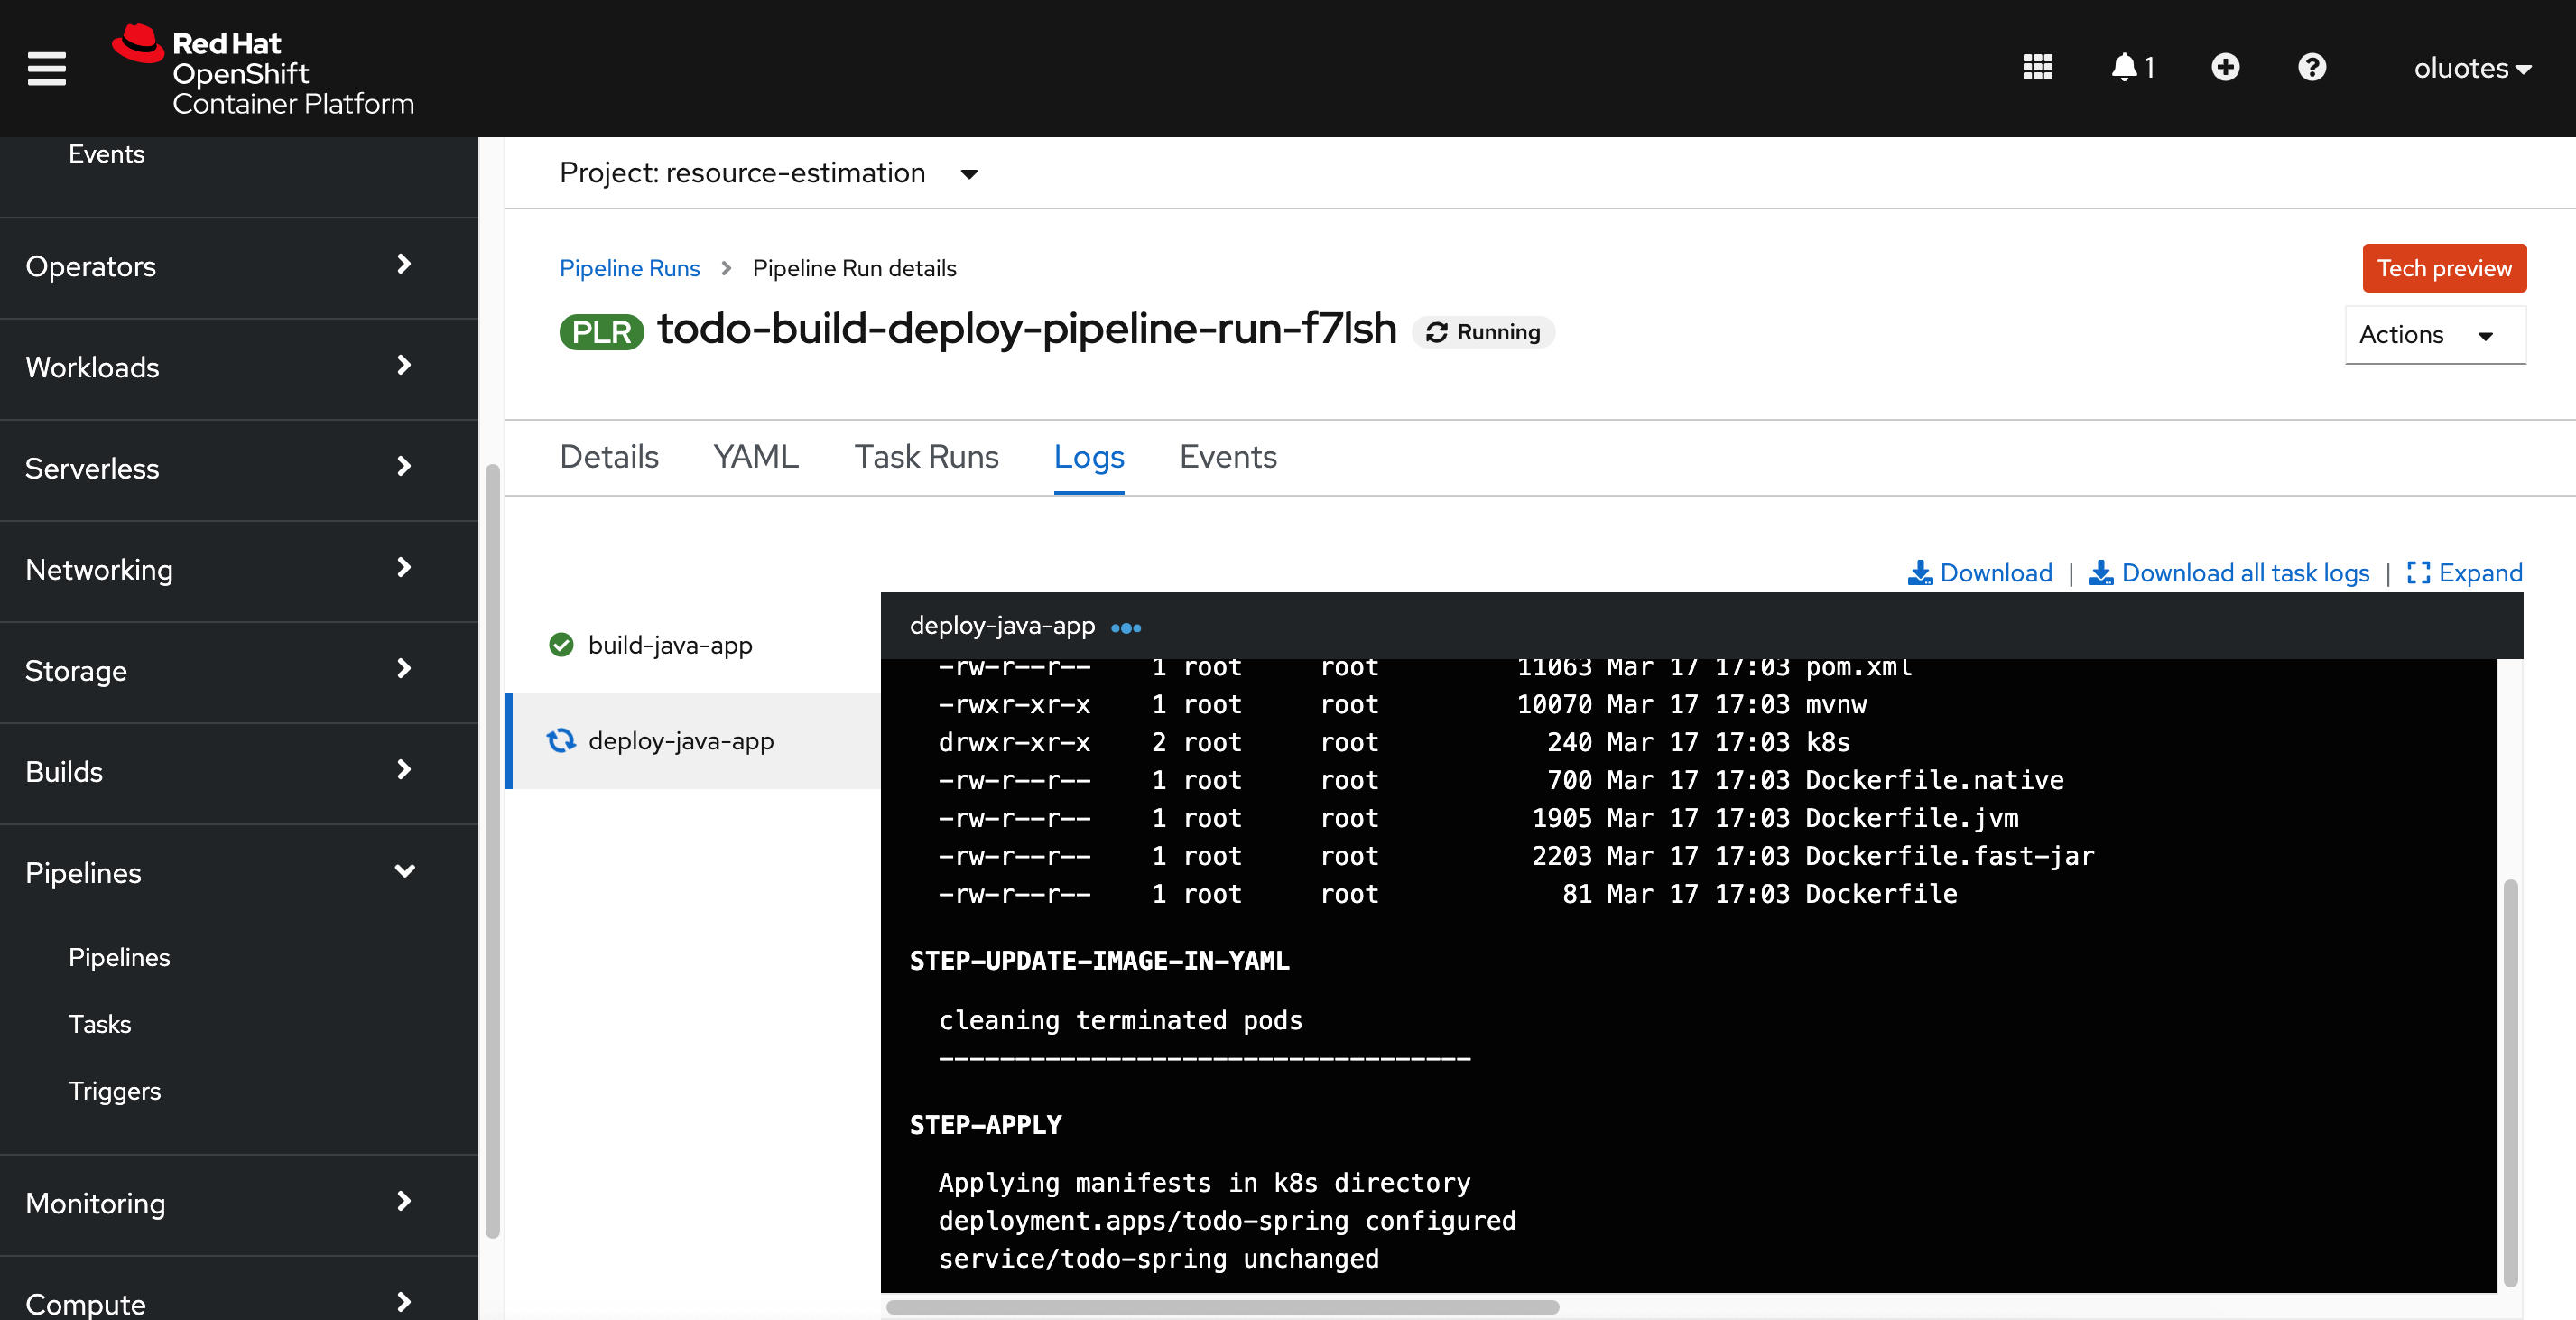 Openshift pipeline - Deploy Step
If the application fails readiness check, that's because the application does not have enough processing unit to complete the initialization process. We will talk more about this later. To meet the required startup time for the readiness probe, update the Deployment as follows:
...
 spec:
     containers:
       - resources:
           limits:
             cpu: 600m
             memory: 512Mi
           requests:
             cpu: 300m
             memory: 128Mi

...
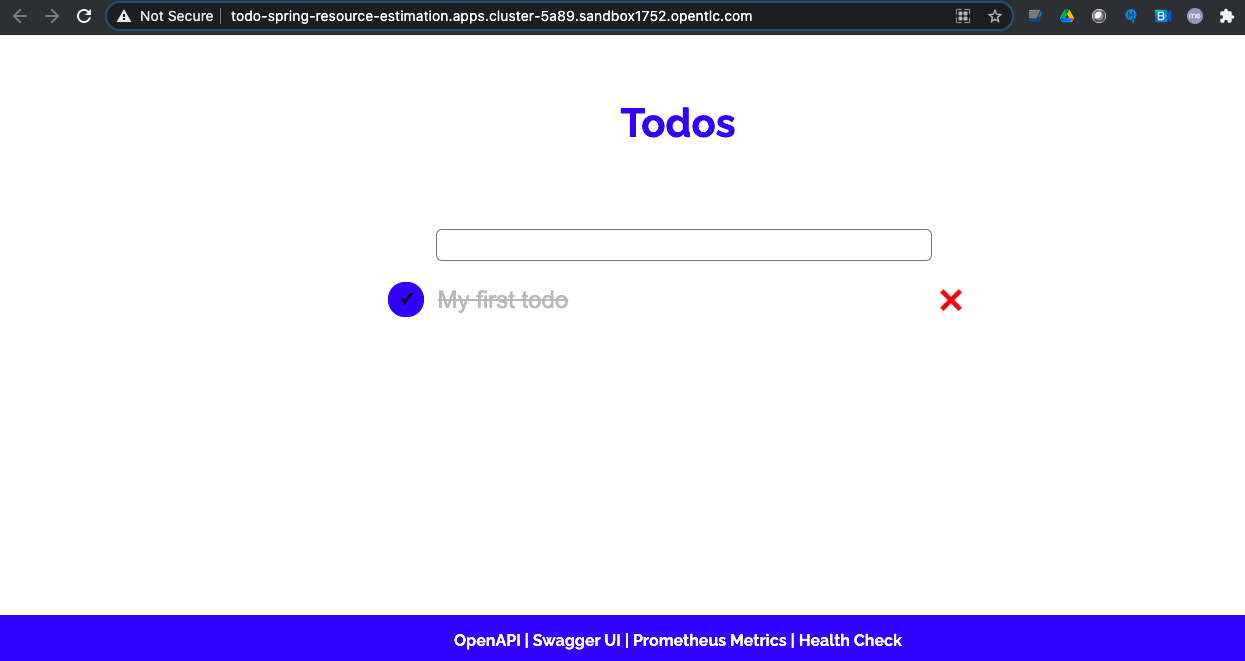
The startup time should be fast enough now for the application to pass the readiness check.
Vertical Pod Autoscaler Operator (VPA) automatically reviews the historical and current CPU and memory resources for containers in pods and can update the resource limits and requests based on the usage values it learns.
The VPA uses individual custom resources (CR) to update all of the pods associated with a workload object, such as a Deployment, Deployment Config, StatefulSet, Job, DaemonSet, ReplicaSet, or ReplicationController.
The VPA helps you to understand the optimal CPU and memory usage for your pods and can automatically maintain pod resources through the pod lifecycle.
VPA has three main components:
-
Recommender - Monitors the current and past resource consumption, and provides recommended values for the container’s CPU and memory requests.
-
Updater - Checks which of the pods have the correct resources set, and if they don’t, kills them so that their controllers with the updated requests can re-create them.
-
Admission Plugin - Sets the correct resource requests on new pods.
vpa.yaml
apiVersion: autoscaling.k8s.io/v1
kind: VerticalPodAutoscaler
metadata:
 name: todo-recommender-vpa
spec:
 targetRef:
   apiVersion: "apps/v1"
   kind: Deployment
   name: todo-spring
 updatePolicy:
   updateMode: "Off"
The VPA recommendations are stored in the status. As you can see in vpa.yaml, the updateMode: "Off" means no changes to the selected resources are performed based on the recommended values in the status. There are two other types: updateMode: "Initial" and updateMode: "Auto" .
Initial: means recommendations are applied during the creation of a Pod and it influences scheduling decisions. Auto: means pods are automatically restarted with the updated resources based on recommendation.
VPA is not currently recommended for Production deployment but for resource usage estimation; it’s an excellent tool to deploy in the development environment.
Let's create the CR.
$ oc apply -f ..//todo-spring-quarkus/k8s/vpa.yaml

verticalpodautoscaler.autoscaling.k8s.io/todo-recommender-vpa created
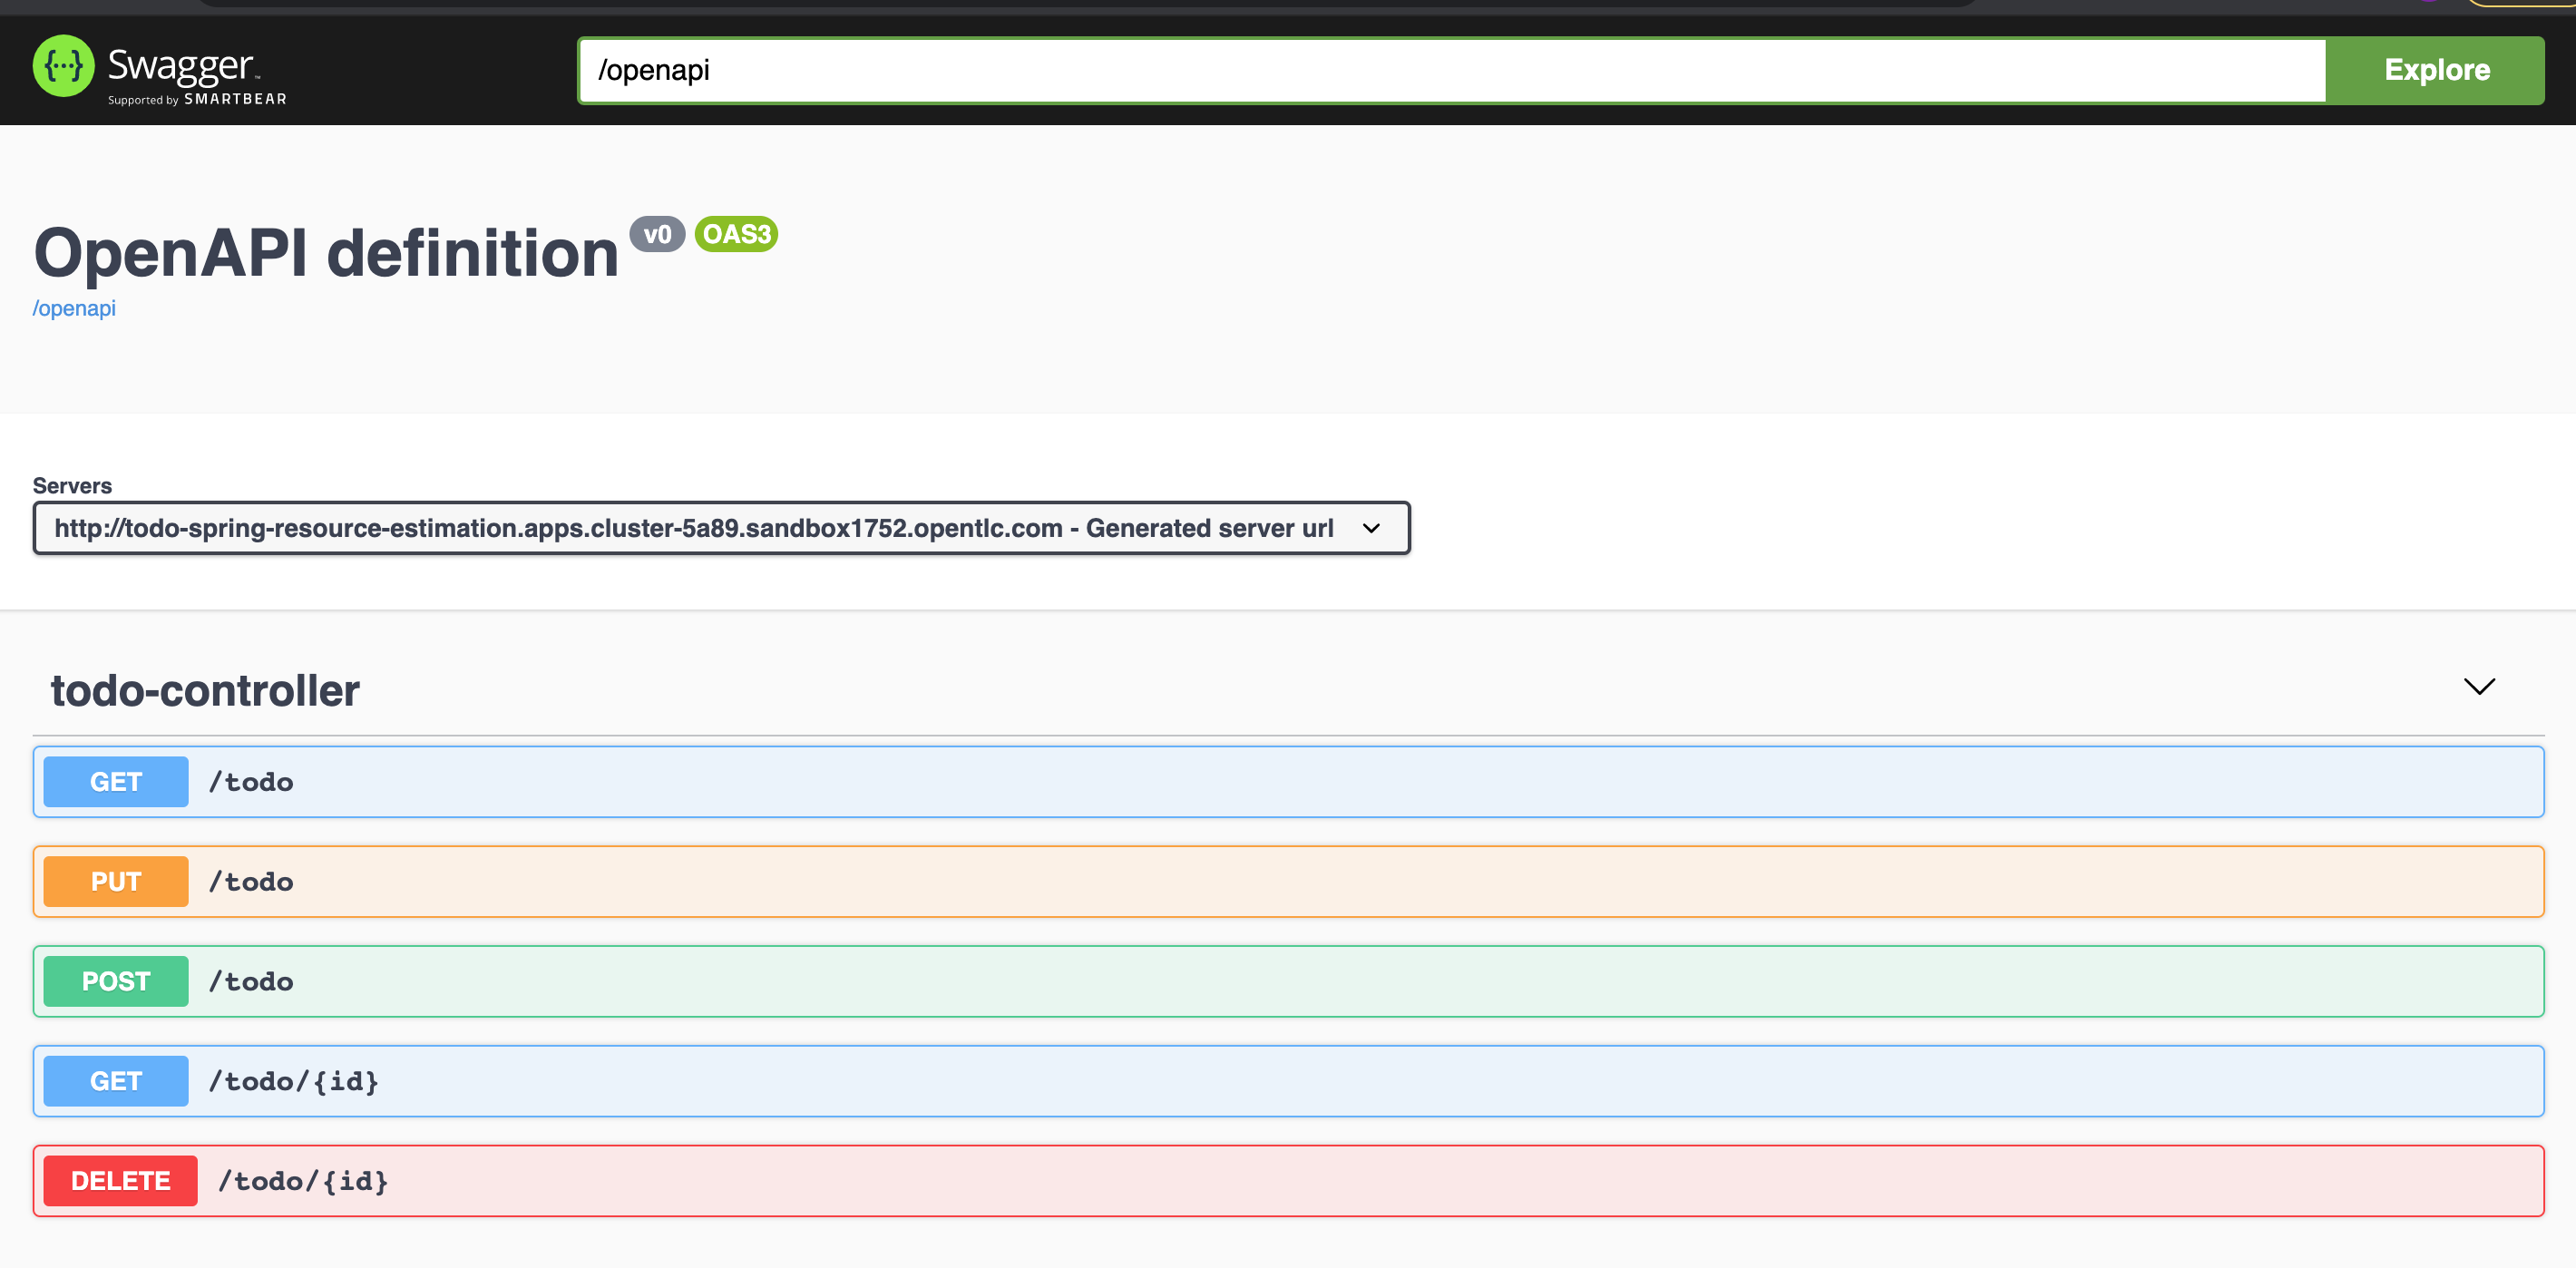
Now that we have the Todo application up and running, the next step is to create our test plans based on the Todo endpoints. For this workshop, the endpoints we would like to profile are:
$ curl -X GET "http://todo-spring-resource-estimation.apps.cluster-5a89.sandbox1752.opentlc.com/todo/1" -H  "accept: */*"

$ curl -X PUT "http://todo-spring-resource-estimation.apps.cluster-5a89.sandbox1752.opentlc.com/todo" -H  "accept: */*" -H  "Content-Type: application/json" -d "{\"id\":0,\"title\":\"Test Resource Estimation\",\"completed\":true}"

$ curl -X POST "http://todo-spring-resource-estimation.apps.cluster-5a89.sandbox1752.opentlc.com/todo" -H  "accept: */*" -H  "Content-Type: application/json" -d "{\"id\":0,\"title\":\"string\",\"completed\":true}"
Let's first download and install JMeter.
Download Apache JMeter and extract in a directory. Start the application.
$ unzip apache-jmeter-5.4.1.zip
$ cd apache-jmeter-5.4.1
$ ./bin/jmeter.sh

================================================================================
Don't use GUI mode for load testing !, only for Test creation and Test debugging.
For load testing, use CLI Mode (was NON GUI):
  jmeter -n -t [jmx file] -l [results file] -e -o [Path to web report folder]
& increase Java Heap to meet your test requirements:
  Modify current env variable HEAP="-Xms1g -Xmx1g -XX:MaxMetaspaceSize=256m" in the jmeter batch file
Check : https://jmeter.apache.org/usermanual/best-practices.html
================================================================================
The first step in design a load testing plan is to understand the performance goal/target of the system under test from business perspectives.
For our Todo application, we have the following performance requirements that the application must meet.
- Throughput: must be able to process minimum 1000 transactions/sec
- Error rate: 0.06% error rate, which means the application must perform at a minimum of 99.94%
- Boot-up time: relatively fast boot time <= 40sec. This is neccessary in case there is need for scaling.
- Concurrent users: handle up to 2000 users or requests/sec
- Peak/Black Friday Period Users: handle up to 4000 users or requests/sec within 1 min windows
One of the ways of setting up your test script is using the Test Script Recorder. See the step-by-step guide for more information.
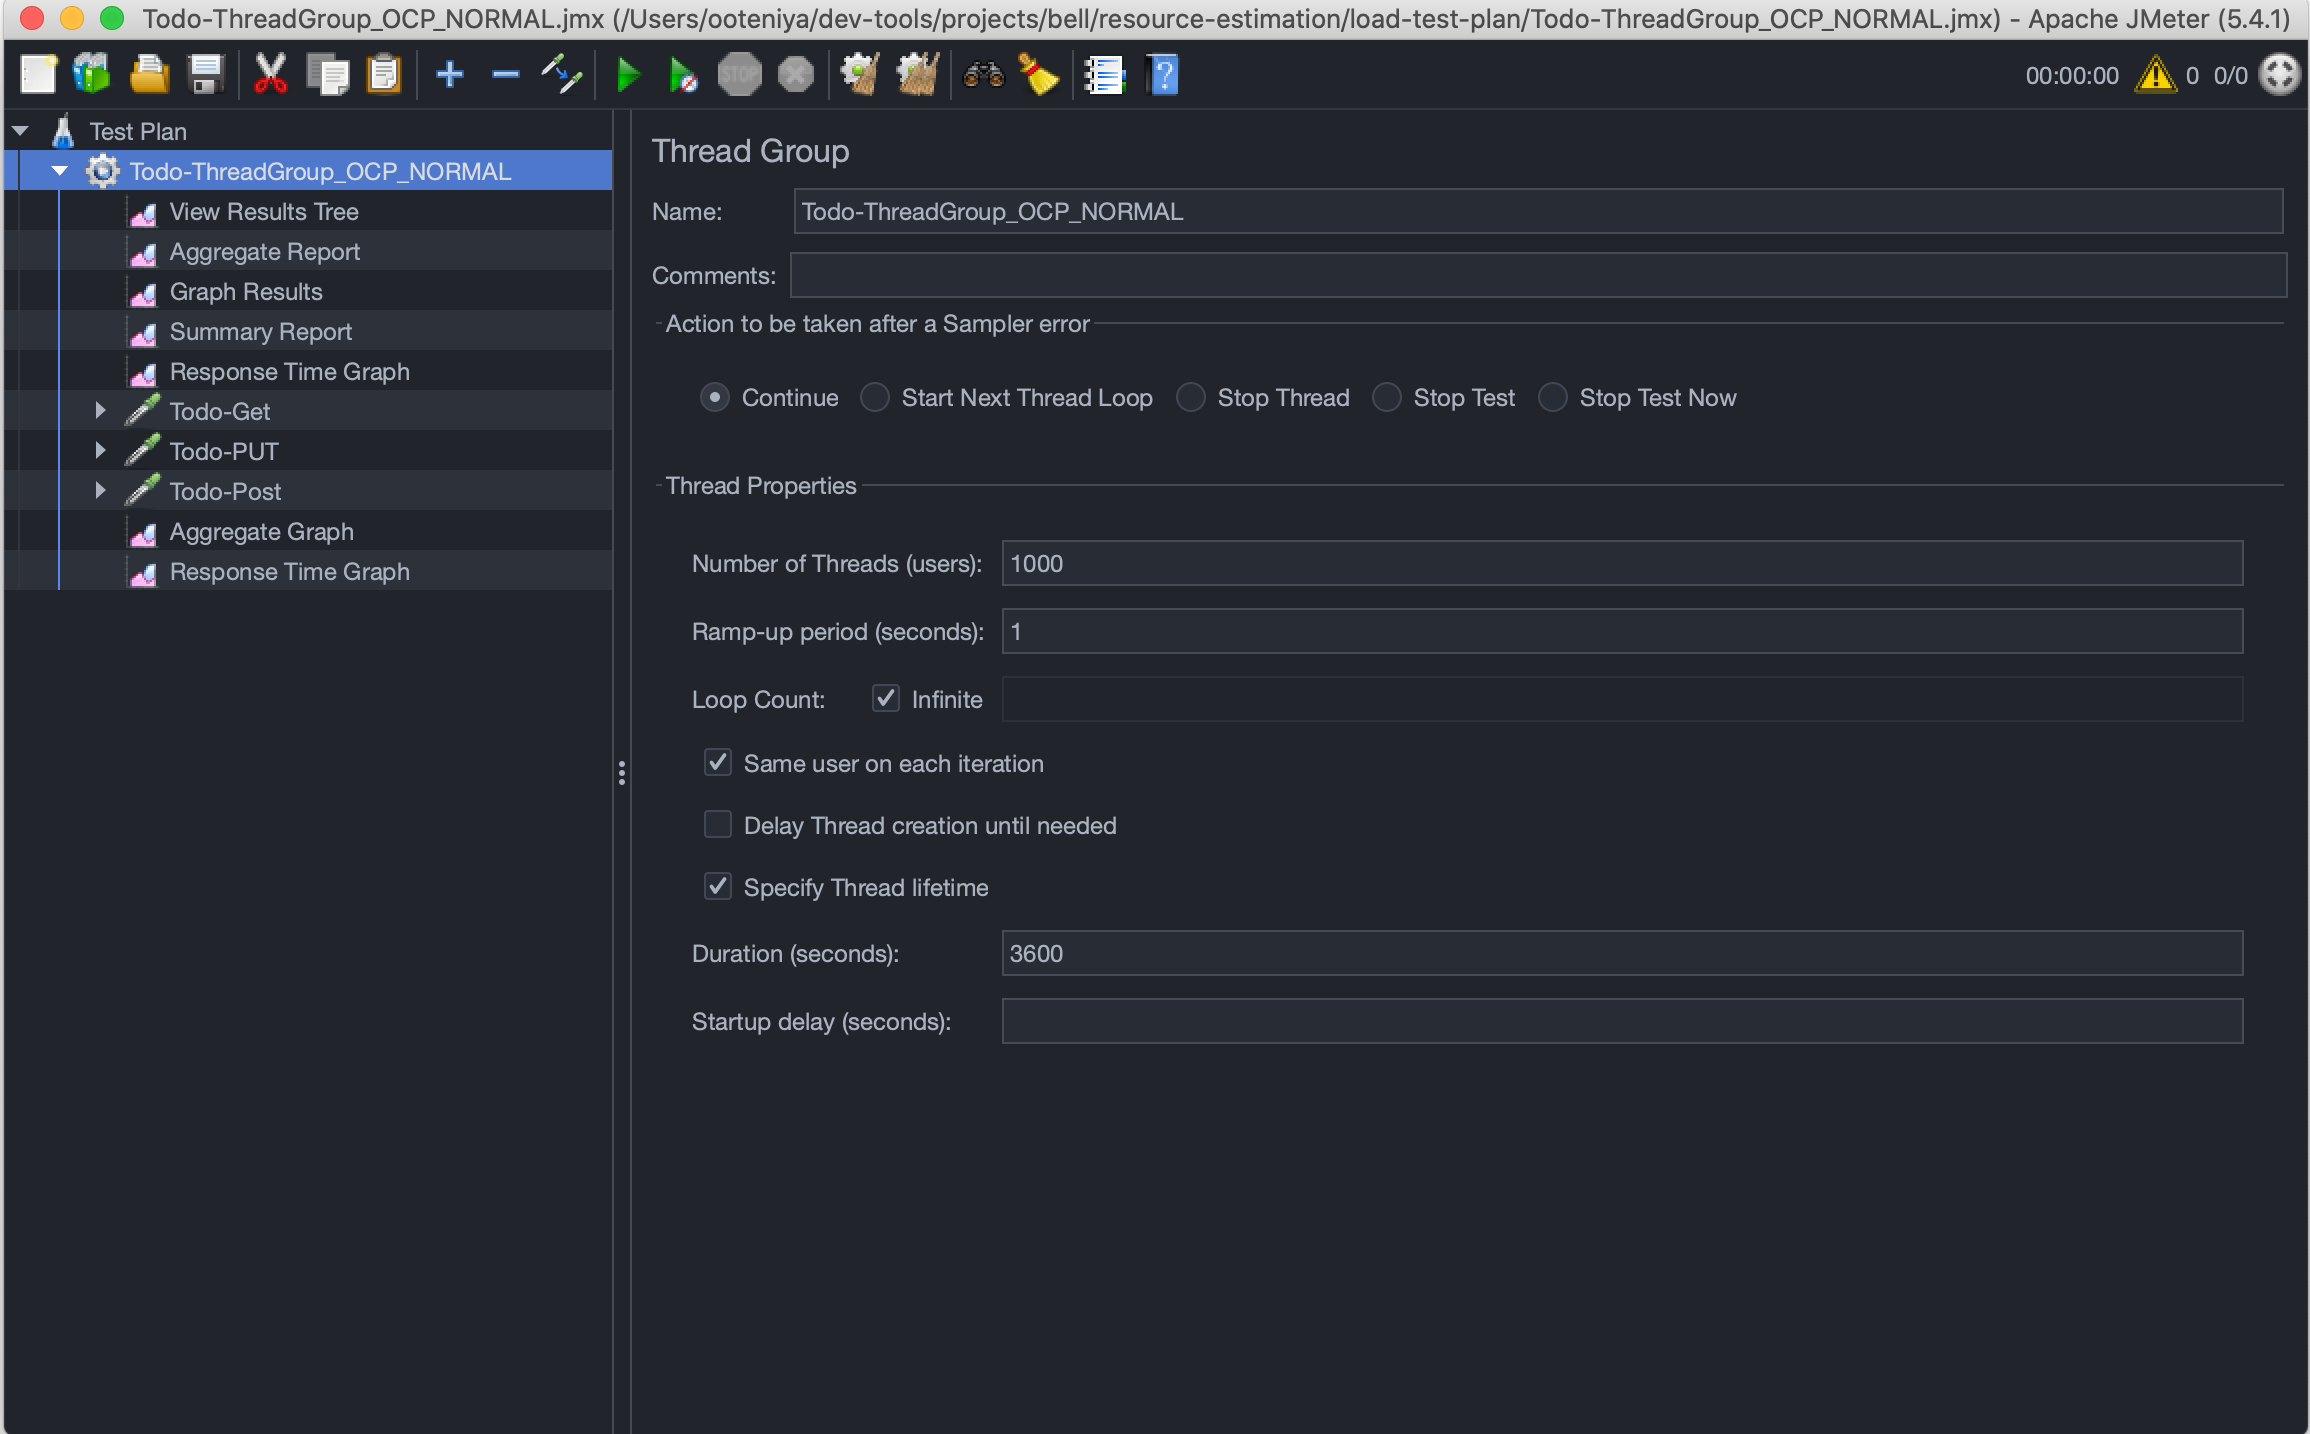
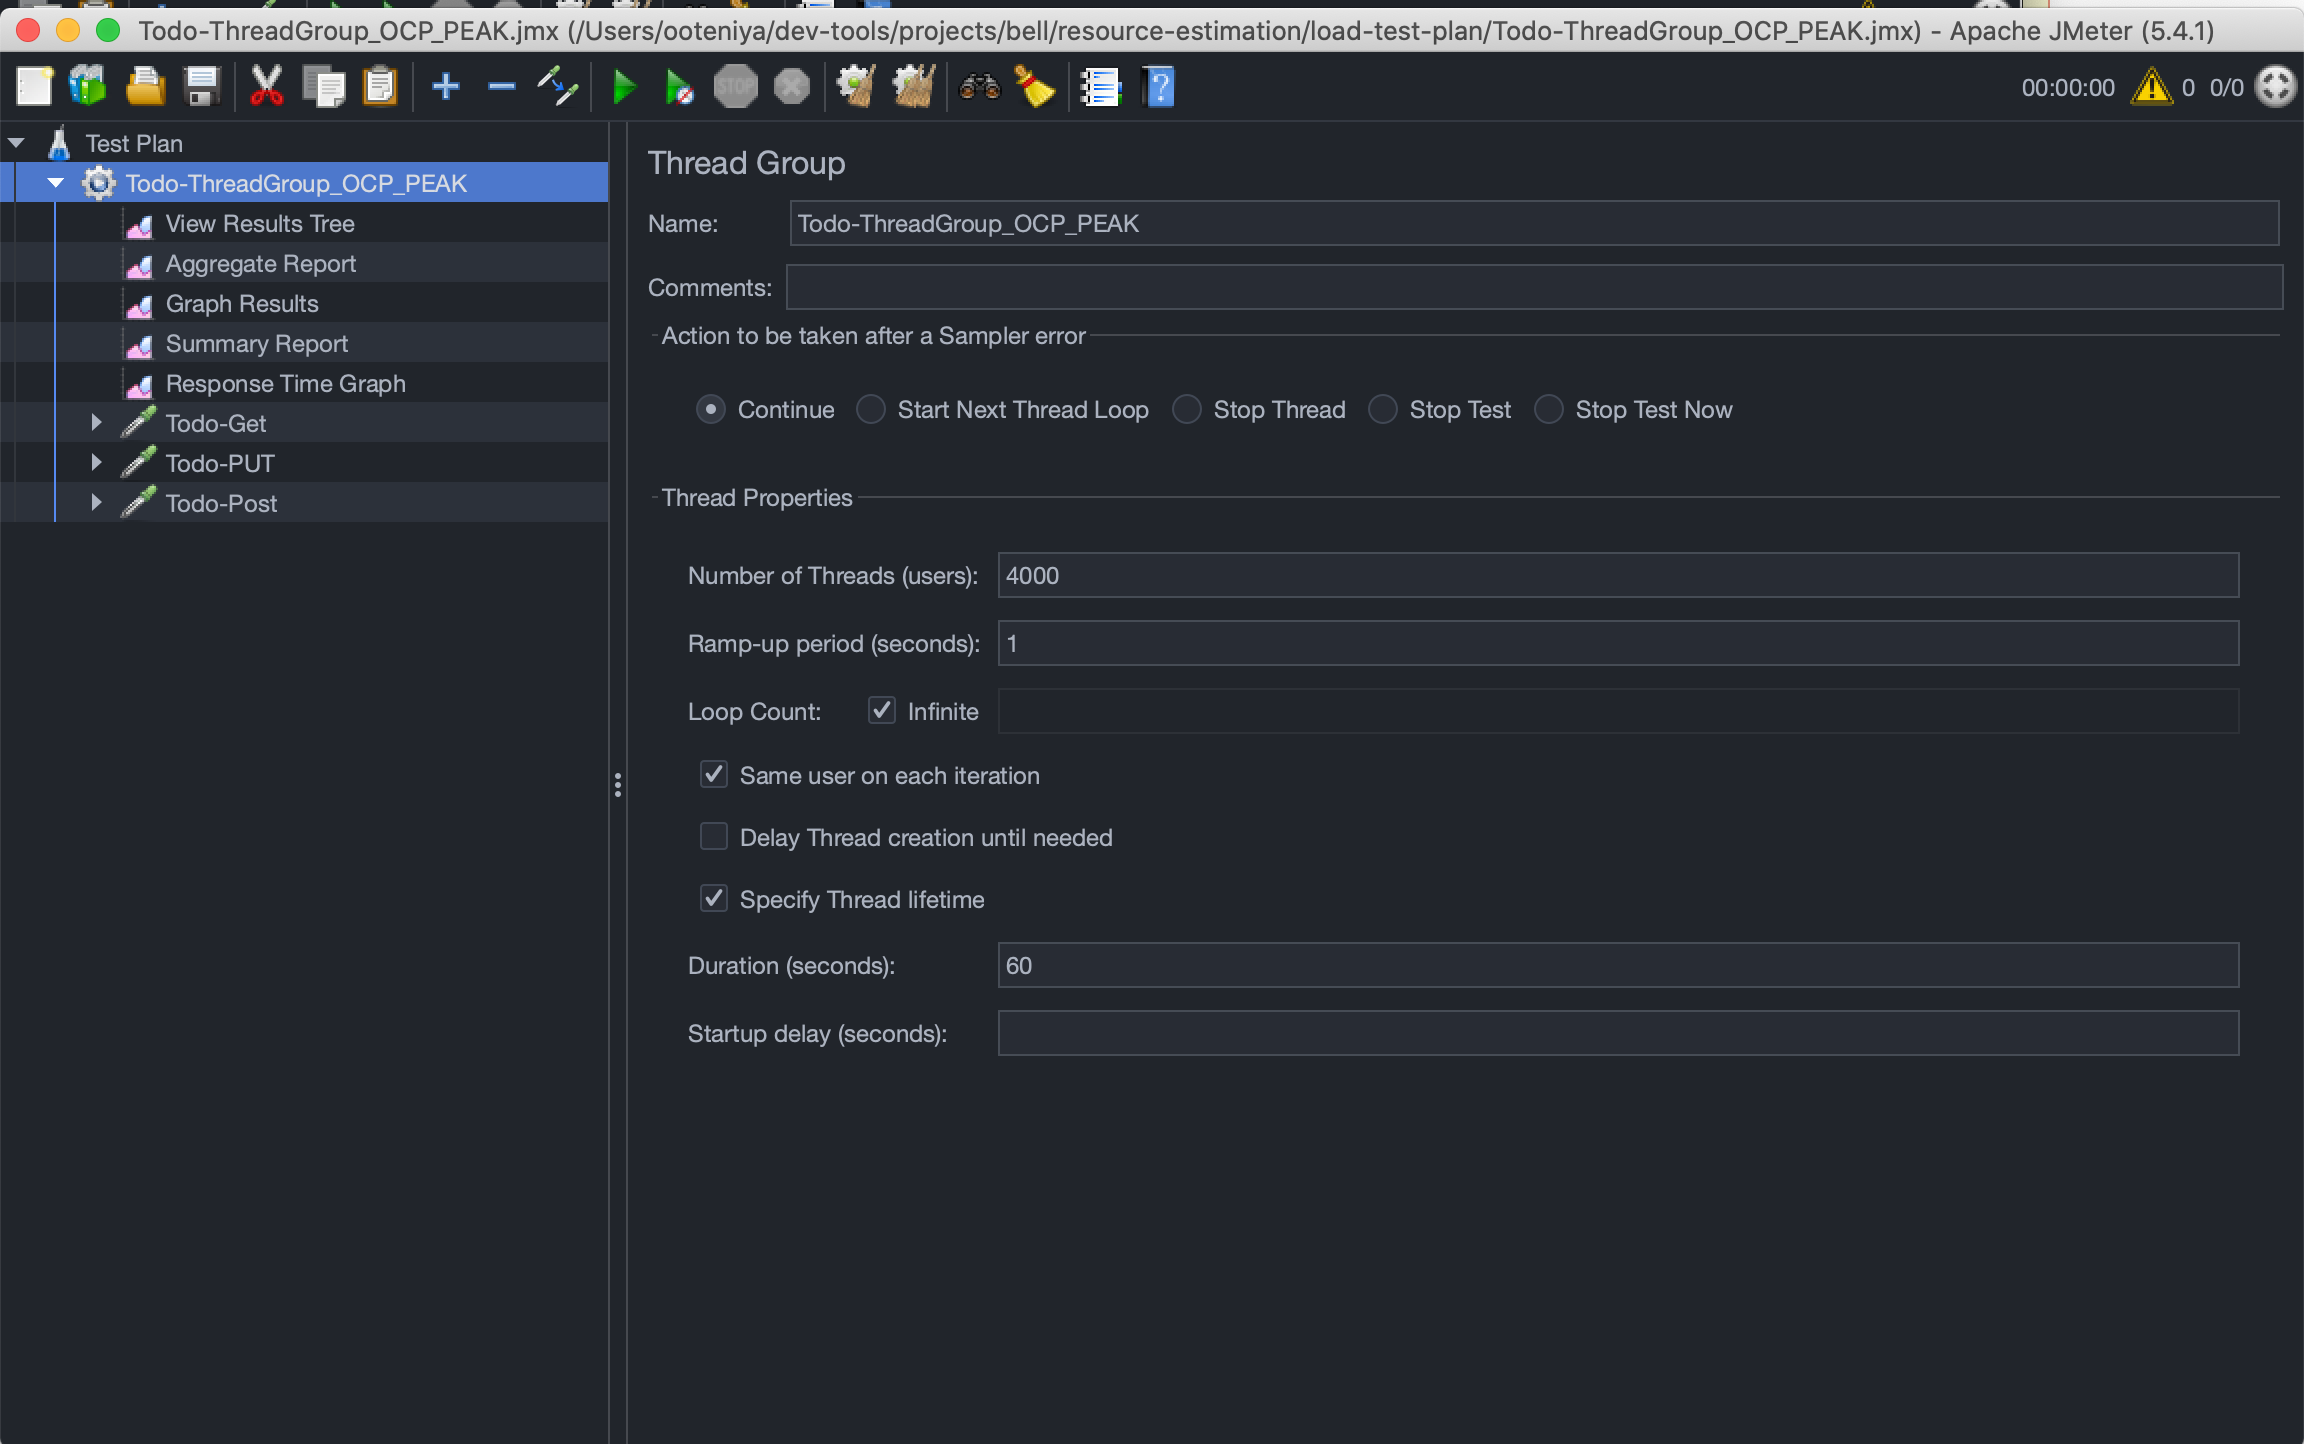
Once you have the test scripts that mimicks the type of user interaction you would like to perform, next is to configure the Thread Group which defines a pool of virtual users that will execute the test case against the system. See the Elements of a Test Plan for more information.
We have designed three test scripts to execute the Todo application:
- Normal Load - at any given point in time, there will be 2000 concurrent users on the system per sec. For this workshop’s purpose, we will run the normal load for 1 hour and then monitor the performance and our configuration’s ability to handle such requests.
- Peak/Black Friday Load - For a peak load, we expect 4000 additional concurrent users to be on the system for several cycles within a second for a total of 1 minute. This is in addition to the 2000 concurrent users on the system per sec in a normal load, making a total of 6000 concurrent users/sec.
To execute the designed Test scripts, we will be using the Apache JMeter CLI. This is a recommended approach for running a load test as it avoids the overhead of the JMeter GUI. The CLI also generates a bunch of reports we can use to analyze the performance of the application. The main benefit of the CLI over the GUI for load testing is that it consumes fewer resources and gives more reliable results than the GUI.
JMeter GUI should only be used to create, maintain, and validate our scripts. Once the script is validated, use the CLI to run the load test.
Openshift Monitoring and the installed VPA CR will be used to monitor the resource usage.
We will follow the steps below to estimate resources to fulfil our performance requirements.
- Check the start-up time. This is important for scaling in peak periods.
- Adjust to have a fast start-up time initially.
- What is the best resource requirement for the startup time I need?
- Not applicable to every use case
- What’s my breakpoint with one pod - Note the resource usage.
- Is the breakpoint lower than my desired performance goal?
- How many replicas do I need to start with to achieve the desired performance goals?
- What’s the resource required to achieve the desired throughput with a normal workload? (You need to run this for a period of time say 1 day to 1 week)
- What’s the resource requirement to cope with spikes and "Black Friday" requests?
- How many pods does the application need to cope effectively?
- What's the required memory or CPU utilization to scale up?
- Estimate the resource usage per pod/container.
- Use that to determine the quota.
We have a start up time requirement of <= 40sec. This is important because during peak periods like "Black Friday", we want to possibly scale by adding more pod replicas to cater to the load. Our current configuration will fail Startup probe because the application will take a long time to initialize. The CPU is throttled based on the current CPU request and limit configurations.
...
spec:
     containers:
       - image: 'quay.io/ooteniya/todo-spring:v1.3.8'
         imagePullPolicy: Always
         name: todo-spring
         resources:
           limits:
             memory: "512Mi"
             cpu: "60m"
           requests:
             memory: "128Mi"
             cpu: "30m"
         ports:
           - containerPort: 8080
             protocol: TCP
         ...
         startupProbe:
           httpGet:
             path: /health
             port: 8080
           failureThreshold: 3
           periodSeconds: 40
...
The Pod will be killed and restarted based on its restartPolicy
Failed Pod
The solution to this is to bump up the CPU resources required to give it enough processing power to startup at the required less than 40 secs startup target. Below is the new configuration.
...
resources:
 limits:
   memory: "768Mi"
   cpu: "240m"
 requests:
   memory: "512Mi"
   cpu: "200m"
...
With a CPU resource request of 200m and 240m (20% of request value) limit, the startup time of 73.902seconds does not meet the startup performance target. The pod will be restarted because it's lower than the startup probe of `
We need to play around with the request and limit (20% of request) to achieve that target.
...
resources:
 limits:
   memory: "768Mi"
   cpu: "480m"
 requests:
   memory: "512Mi"
   cpu: "400m"
...
With this new configuration, we can meet the startup target of less than 40sec.
 Startup Target Met
Do not forget to tune the runtime paramaters such as JVM parameters for Java etc, to achieve the optimal performance.
Now that we have achieved the required startup time, next is to determine the number of resources required to achieve the target throughput under a normal workload. It is also important to note that the Todo application is more CPU intensive than memory. It does not require any data transformation etc.
The table below highlights the resource estimation for a normal load of 2000 virtual user per sec for 2 minutes.
For a more accurate result, you need to run the workload over a period of at least 5hours to 2 weeks.
| # | max CPU/Pod | max Memory/Pod | # of Pods | Throughput(tps) | % in error | Resource Quota (CPU) | Resource Quota (Memory) |
|---|---|---|---|---|---|---|---|
| 1 | 480m | 768Mi | 1 | 171.75 | 0 | 480m | 768Mi |
| 2 | 480m | 768Mi | 2 | 475.55 | 0 | 960m | 1536Mi |
| 3 | 480m | 768Mi | 3 | 748.42 | 0 | 1440m | 2304Mi |
| 4 | 480m | 768Mi | 4 | 1,169.61 | 0 | 1920m | 3072Mi |
Table 1
From table 1 above, to achieve our performance target of a minimum of 1000tps and a maximum 0.06% allowed error rate, we need 4 pods with memory limits of 512mi and 480m of cpu. If we are to request a quota based on this, we would require 2 cores of cpu and 2Gi of memory in the namespace. Below is the configuration used for the above table.
For a Bustable configuration:
...
resources:
 limits:
   memory: "768Mi"
   cpu: "480m"
 requests:
   memory: "512Mi"
   cpu: "400m"
...
For a Guranteed configuration:
...
resources:
 limits:
   memory: "768Mi"
   cpu: "480m"
 requests:
   memory: "768Mi"
   cpu: "480m"
...| # | max CPU/Pod | max Memory/Pod | # of Pods | Throughput(tps) | % in error | Resource Quota (CPU) | Resource Quota (Memory) |
|---|---|---|---|---|---|---|---|
| 1 | 576m | 768Mi | 1 | 216.06 | 0 | 576m | 768Mi |
| 2 | 576m | 768Mi | 2 | 716.65 | 0 | 1,152m | 1536Mi |
| 3 | 576m | 768Mi | 3 | 1,066.61 | 0 | 1,728m | 2304Mi |
Table 2
Table 2 above show that 3 pod replicas are required to meet our performance target with memory limits of 512Mi and 576m of cpu limit, which is 20% cpu resource increase over the configuration we have in table 1. If we are to request a quota based on this, we would require 1.7 cores of cpu and 1.5Gi of memory in the namespace.
| # | max CPU/Pod | max Memory/Pod | # of Pods | Throughput(tps) | % in error | Resource Quota (CPU) | Resource Quota (Memory) |
|---|---|---|---|---|---|---|---|
| 1 | 692m | 768Mi | 1 | 587.20 | 0 | 692m | 768Mi |
| 2 | 692m | 768Mi | 2 | 1,059.88 | 0 | 1384m | 1536Mi |
Table 3
With Table 3 above, we see that 2 pod replicas are required to meet our performance target with memory limits of 768Mi and 692m of CPU limit, which is 20% CPU resource increase over the configuration we have in table 2. If we are to request a quota based on this, we would require 1384m of CPU and 1536Mi of memory in the namespace.
If we reduce the memory by 20% to optimize the resources, the application gets killed. This indicates that the memory requirement set for the application is optimal since it can sustain the normal load, but the pods get killed once reduced by 20% of the current value.
| # | max CPU/Pod | max Memory/Pod | # of Pods | Throughput(tps) | % in error | Resource Quota (CPU) | Resource Quota (Memory) |
|---|---|---|---|---|---|---|---|
| 1 | 830m | 768Mi | 1 | 858.01 | 0 | 830m | 768Mi |
| 2 | 830m | 768Mi | 2 | 1,356.94 | 0.09 | 1,660m | 1536Mi |
Table 4
Lastly, Table 4 indicates further increase of the cpu by 20% improved the throughput but our error rate increased above the allowed threshold.
So, the optimal configuration for the performance target is the what we have in table 3 which is memory limits of 768Mi and 692m of cpu limit with 2 pod replicas.
Starting with the optimal resource requirement for a normal workload, let's put a peak workload on the system and determine how many replicas we need to handle the load and still achieve the performance target.
| # | max CPU/Pod | max Memory/Pod | # of Pods | Throughput(tps) | % in error | Resource Quota (CPU) | Resource Quota (Memory) |
|---|---|---|---|---|---|---|---|
| 1 | 692m | 768Mi | 2 | 571.30 | 0 | 1384m | 768Mi |
| 2 | 692m | 768Mi | 3 | 1,064.50 | 0.05 | 2076m | 1536Mi |
Table 5
Based on the normal and peak "Black Friday" workloads, Table 5 indicates the number of resources required to run the application successfully.
| Application | # of Pods | mem. req/pod | mem. lim/Pod | Total mem req | Total mem lim | CPU req/Pod | CPU lim/Pod | Total CPU req | Total CPU lim |
|---|---|---|---|---|---|---|---|---|---|
| Todo Application | 2 | 512Mi | 768Mi | 1024Mi | 1536Mi | 576m | 692m | 1152m | 1384m |
| Postgesql | 1 | 512Mi | 512Mi | 512Mi | 512Mi | 200m | 200m | 200m | 200m |
| . | |||||||||
| Margin to Deploy | 256Mi | 256Mi | 256Mi | 256Mi | 100m | 100m | 100m | 100m | |
| Total | 3 | 1,280Mi | 1,536Mi | 1792Mi | 2304Mi | 876m | 992m | 1452m | 1684m |
| Resource Quota | 3 | 1792Mi | 2304Mi | 1452m | 1684m |
Table 6
kind: ResourceQuota
apiVersion: v1
metadata:
 name: resource-estimation-rq
 namespace: resource-estimation
spec:
 hard:
   limits.cpu: 1684m
   limits.memory: 2304Mi
   pods: '3'
   requests.cpu: 1452m
   requests.memory: 1792Mi
 scopes:
- NotTerminatingEstimating the resources an application need is very challenging. It takes time and effort; hence the process is more of an art than science. You’ll first want to identify a good starting point, aiming for a good balance of CPU and memory. After you’ve decided on a suitable resource size for the application, you will also need to set up a process where you can constantly monitor the application's resource actual usage over a period of time. The Deploying Vertical Pod Autoscaler along with other monitoring tools such as Openshift Moniotirng console, can help with this.
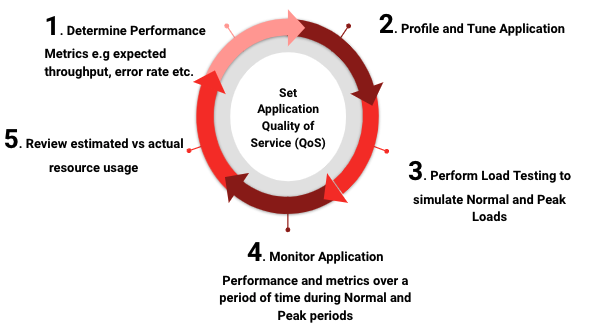
In summary, to estimate the resources an application needs, you need to start by first determining the performance target of the application, profile and tune the application, perform load testing to simulate the normal and peak loads, monitor the application over a period of time, and then review the estimated and actual resource usage.
