GSEAPY: Gene Set Enrichment Analysis in Python.

Note
The main documentation for GSEAPY can be found at https://pythonhosted.org/gseapy
GSEAPY is a python wrapper for GESA.It's used for convenient GO enrichments and produce publishable quality figures from python. GSEAPY could be used for RNA-seq, ChIP-seq, Microarry data.
Gene Set Enrichment Analysis (GSEA) is a computational method that determines whether an a priori defined set of genes shows statistically significant, concordant differences between two biological states (e.g. phenotypes).
The full GSEA is far too extensive to describe here; see
GSEA documentation for more information.
For Gene Enrichment Analysis, GSEA is still the one of best choice.
However, When you have large number of expression tables, or GO terms to enrich, GSEA desktop
version is inconvinient. What's more, the R version of GSEA has not been updated since 2006.
What's worse, GSEA desktop version do not provide means to modify plots,
like legends, ticks......
As a researcher of life science, I want a modern GSEA with lastest features. It can produce pubilishable
figures, and do many jobs at the same time without using mouse to select differrent data table,
differrent gene sets repeatly.
- GSEAPY could reproduce the GSEA figures using GSEA desktop version results.
- GSEAPY could be used directly to perform enrichment anlysis. All parameters are same with
GSEA - GSEAPY is written in
python, using the same algorithm ofGSEADesktop version. - GSEAPY produce figures in pdf format by default, which are ready for publishing and easy to modifiy.
- GSEAPY is build based on Numpy, it runs very fast.
- GSEAPY Enhancement will be considered. If you would like to contribute, please @BioNinja on
Github.
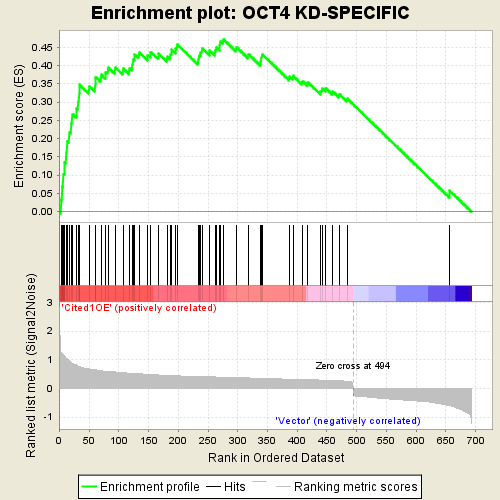
This is an example of GSEA desktop application output
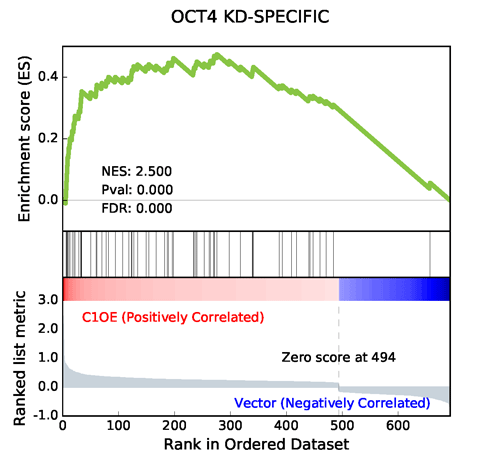
Using the same algorithm by GSEA, GSEAPY reproduce the example above.

Generated by GSEAPY
GSEAPY figures are PDF formats by default. Other matplotlib figures formats are supported, too.
You can modify GSEA plots easily in .pdf files. Please Enjoy.
$ pip install gseapy$ pip install git+git://github.com/BioNinja/gseapy.git#egg=gseapy- Python 2.7 or 3.3+
- Numpy
- Pandas
- Matplotlib
- Beautifulsoup4
You may also need lxml, html5lib, if you could not parse xml files.
GSEAPY has three subcommands: replot, call, prerank.
The replot module reproduce GSEA desktop version results. The only input for GSEAPY is the location to GSEA results.
The call module produce GSEAPY results. The input requries a txt file(FPKM, Expected Counts, TPM, et.al), a cls file,
and gene_sets file in gmt format.
The prerank module produce GSEAPY results. The input expects a pre-ranked gene list dataset with correlation values, which in .rnk format,
and gene_sets file in gmt format. prerank module is an API to GSEA pre-rank tools.
All input files' formats are identical to GSEA desktop version.
See GSEA documentation for more information.
# An example to reproduce figures using replot module.
$ gseapy replot -i ./Gsea.reports -o test


# An example to compute using gseapy call module
$ gseapy call -d exptable.txt -c test.cls -g gene_sets.gmt -o test

# An example to compute using gseapy prerank module
$ gseapy prerank -r gsea_data.rnk -g gene_sets.gmt -o testimport gseapy
# An example to reproduce figures using replot module.
gseapy.replot(indir='./Gsea.reports',outdir='test')
# calculate es, nes, pval,fdrs, and produce figures using gseapy.
gseapy.call(data=expression.txt, gene_sets=gene_sets.gmt, cls=test.cls, outdir='test')
# using prerank tool
gseapy.prerank(rnk=gsea_data.rnk, gene_sets=gene_sets.gmt, outdir='test')If you would like to report any bugs when you running gseapy, don't hesitate to email me: fangzhuoqing@sibs.ac.cn
Visit the document site at https://pythonhosted.org/gseapy
