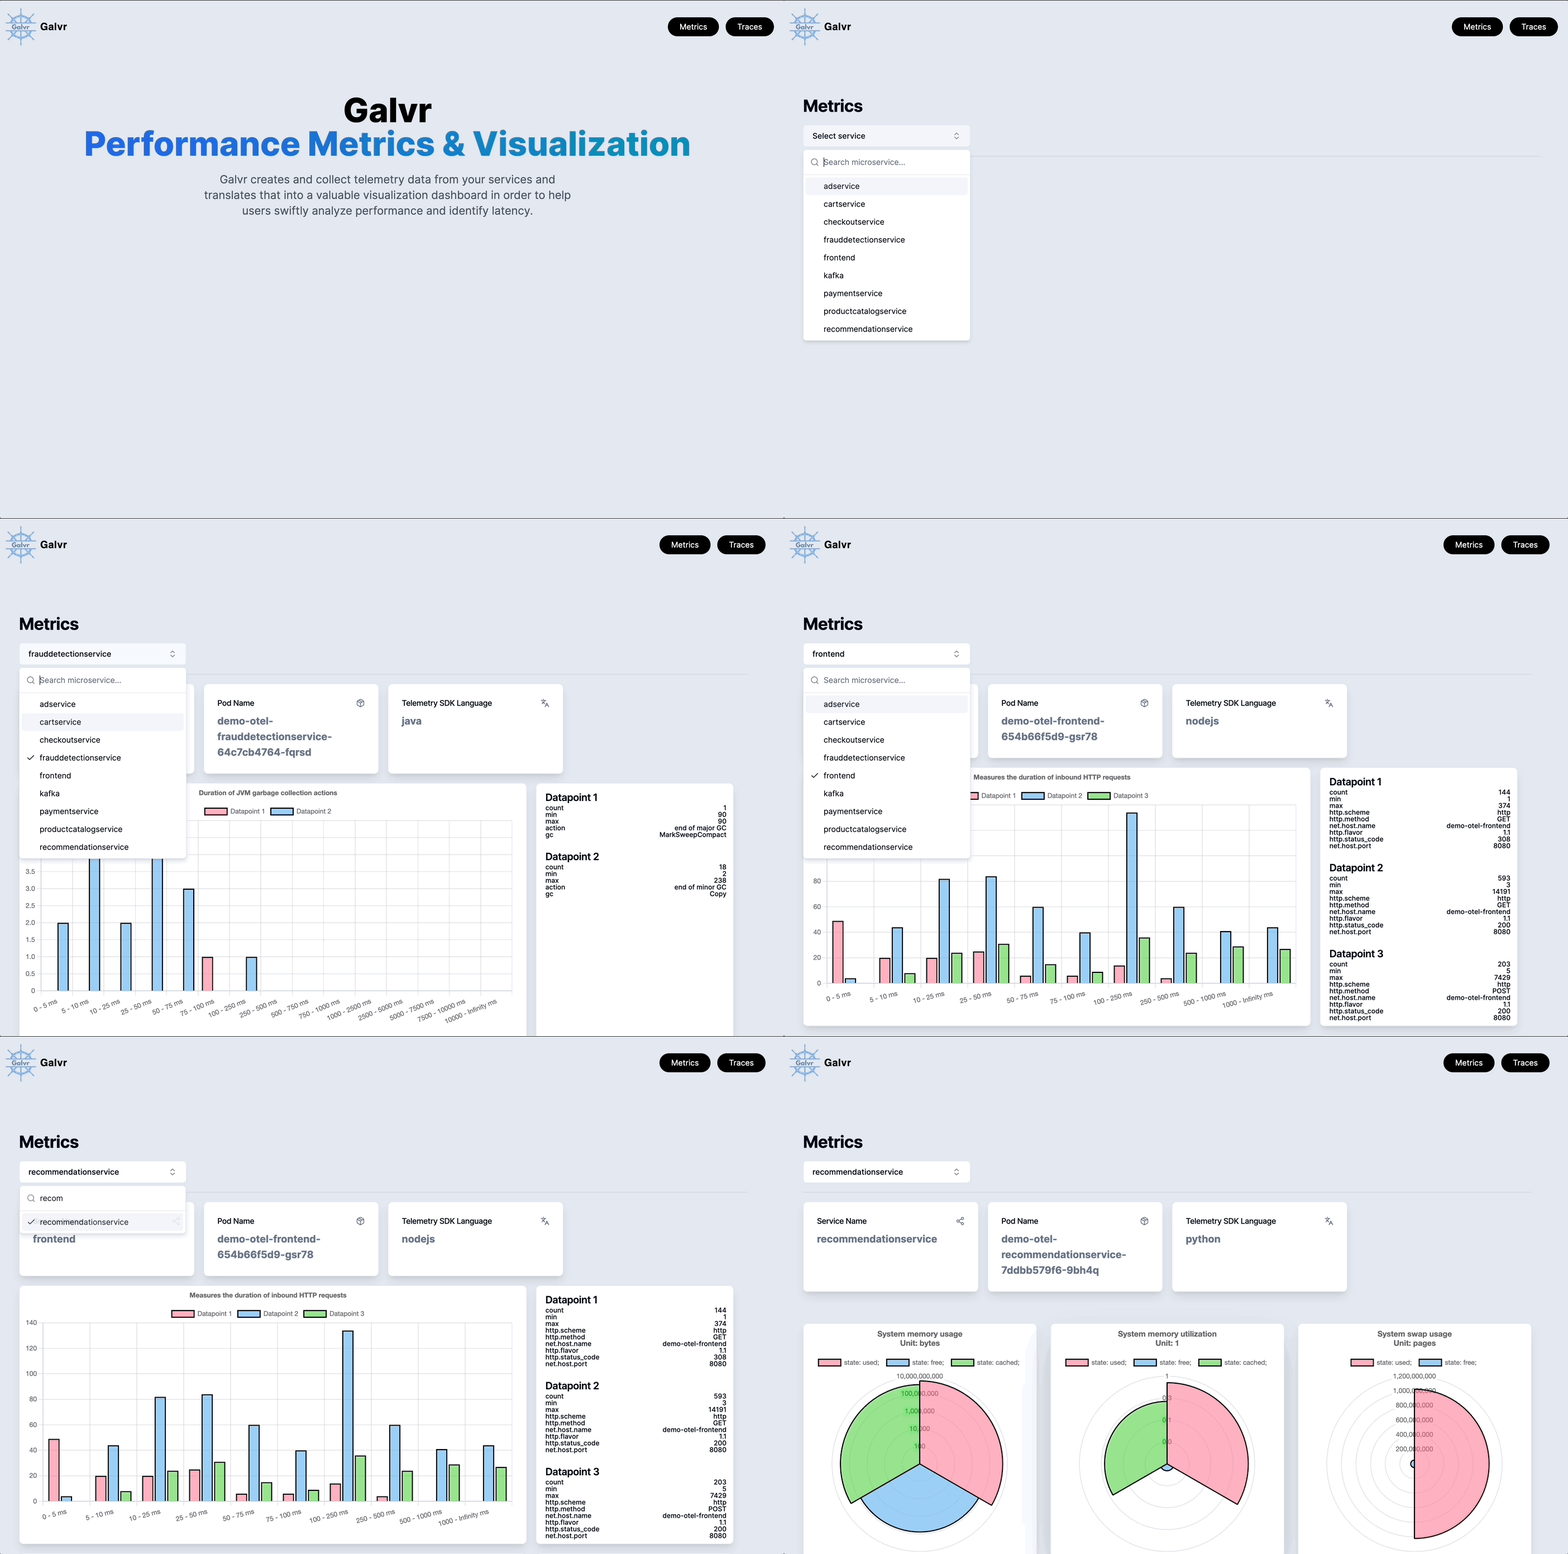
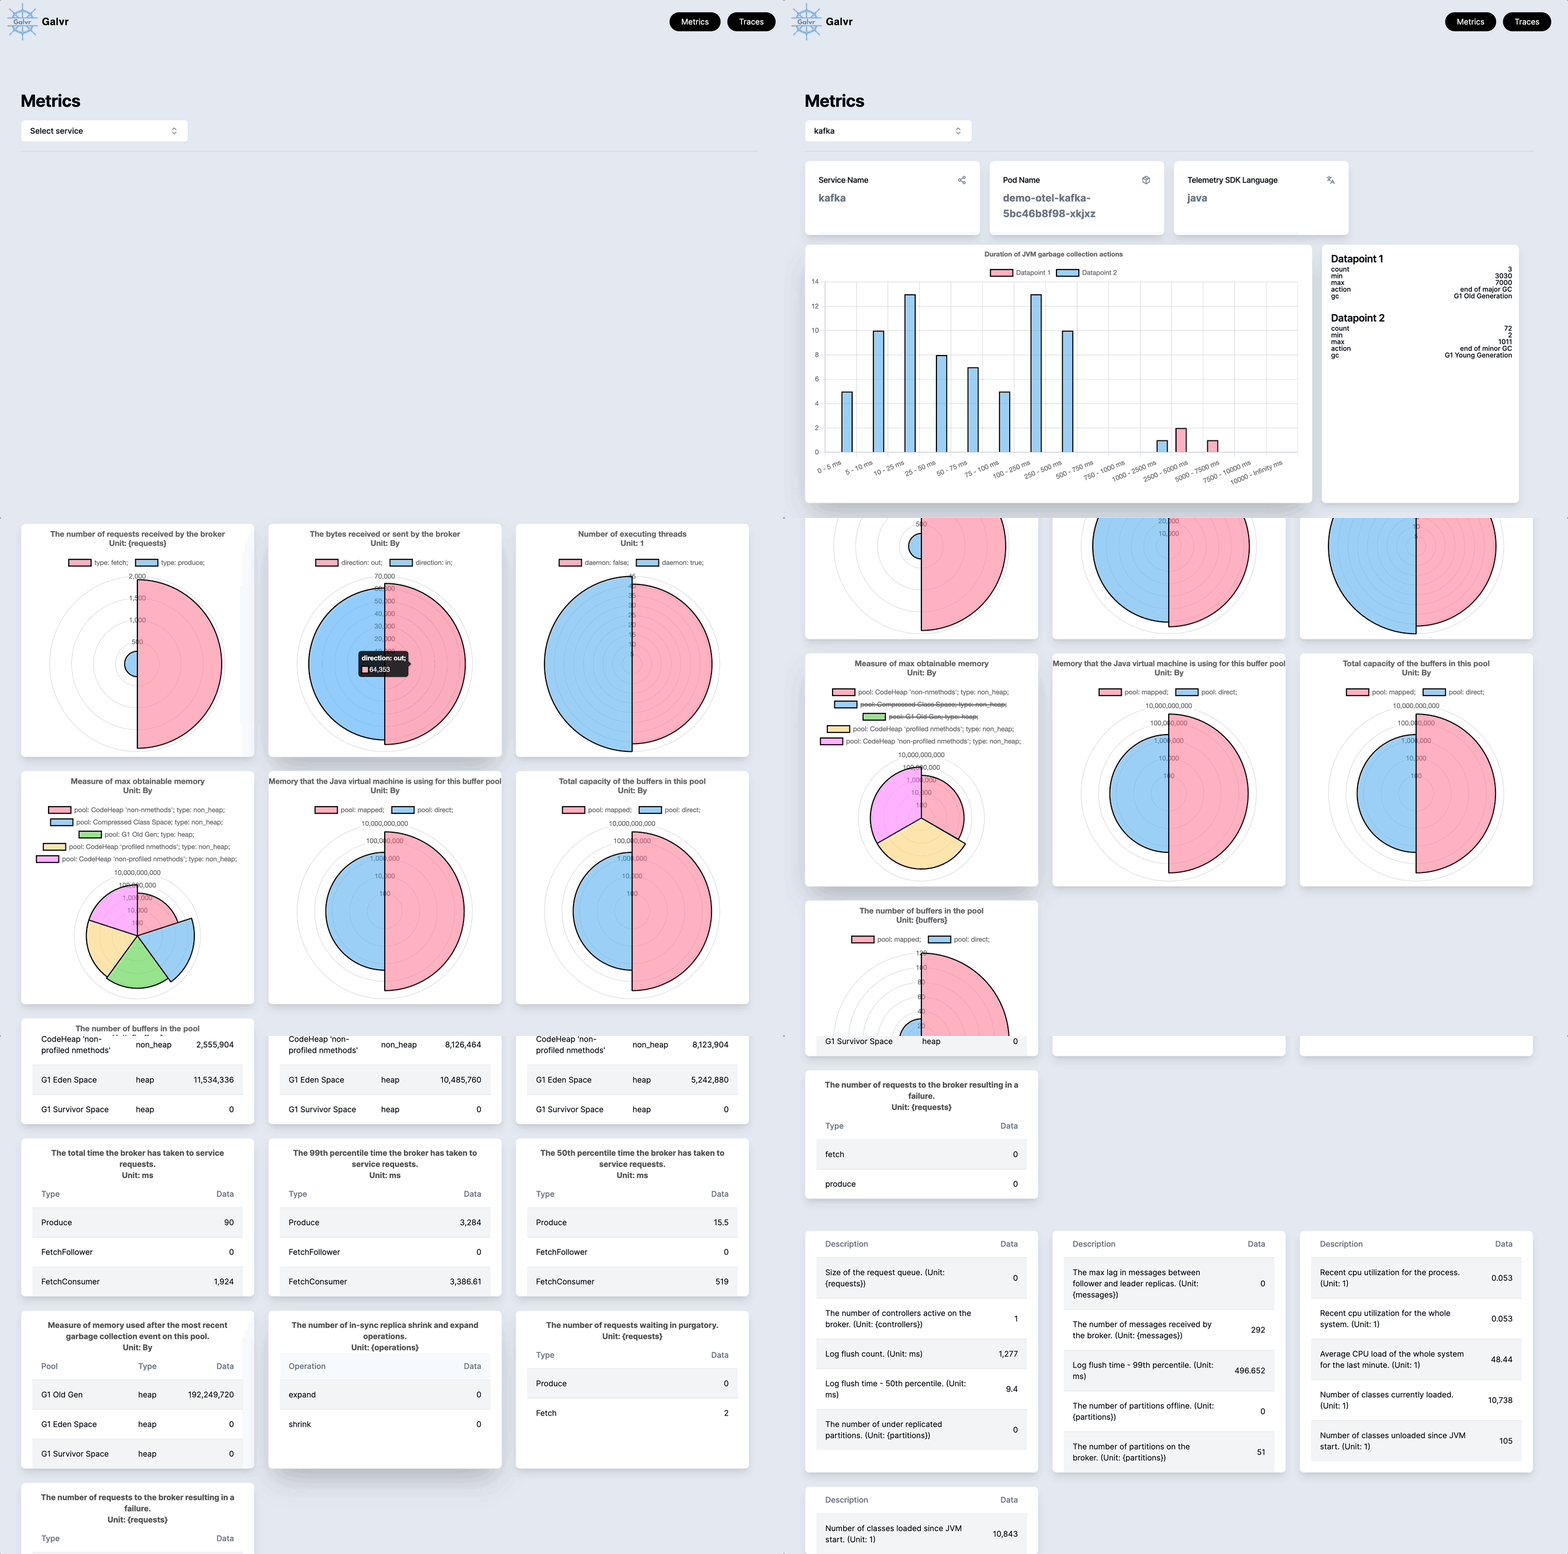
Galvr is a communication metric visualization dashboard for Kubernetes clusters. It is built on the OpenTelemetry observability framework and takes advantage of the metric aggregation processing done by OpenTelemtry instrumentation. It can work with any cluster using instrumentation that exports metrics with the OTLP specification. Galvr is intended to be used alongside the Jaeger distributed tracing platform; in fact, it was created to be a sibling product meant for metrics instead of traces. Galvr consists of two services: a metric collector backend, and a metric visualization frontend. Currently, the two services must be used together, but future development may allow a la carte use.
Galvr is an unopinionated tool, so it works with Kubernetes clusters of any microservice configuration. It simply provides the user with a list of instrumented services and allows them to view whatever metrics they wish.

Galvr can also handle any metric it receives as long as the metric object follows OTLP specifications. This means it will visualize any histogram, sum, or gauge data type.

This guide assumes you have a Kubernetes cluster up and running.
kubectl apply -f https://github.com/cert-manager/cert-manager/releases/download/v1.11.0/cert-manager.yamlkubectl apply -f https://github.com/open-telemetry/opentelemetry-operator/releases/latest/download/opentelemetry-operator.yaml3. Start the openTelemetry collector (you can use a different configuration file as long as it exports metric data to metricendpoint:3000 with the OTLP/HTTP protocol):
kubectl apply -f https://github.com/oslabs-beta/Galvr/releases/download/latest/otelCol.yamla. If your services are not already instrumented, openTelemetry has a number of autoinstrumentation options (https://opentelemetry.io/docs/kubernetes/operator/automatic/). Autoinstrumentation for services written in Node.js can be added to your cluster with:
kubectl apply -f https://github.com/oslabs-beta/Galvr/releases/download/latest/otelNode.yaml
kubectl apply -f https://github.com/oslabs-beta/Galvr/releases/download/latest/otelCol-jaeger.yaml
kubectl create namespace observability
kubectl create -f https://github.com/jaegertracing/jaeger-operator/releases/download/v1.45.0/jaeger-operator.yaml -n observability
kubectl apply -f https://github.com/oslabs-beta/Galvr/releases/download/latest/jaeger.yaml
kubectl port-forward services/jaeger-query 16686:16686
kubectl apply -f https://github.com/oslabs-beta/Galvr/releases/download/latest/galvr.ymlIf you do not have already have a microservice application with which to test Galvr but would like to, we encourage you to try it with the OpenTelemetry Demo application. Instructions for setup can be found in the demo/otel folder.
Distributed under the MIT License. See LICENSE.txt for more information.
We welcome contributions to Galvr from the open source community. Feel free to open an issue or submit a pull request! If you are submitting changes to the codebase, we request that you fork the repository and create a new branch with your changes before submitting a pull request.
Daniel Jaworski GitHub | LinkedIn
Sam Blackburn GitHub | LinkedIn
Sharon Chen GitHub | LinkedIn
Yi Sun GitHub | LinkedIn
