The one-stop shop Docker Desktop Extension for seamless Kafka cluster monitoring and troubleshooting 🐋 🚀
Kafka Sonar is the first-of-its-kind Docker Desktop Extension aimed at enhancing the Kafka developer experience. For developers monitoring or testing their Kafka clusters, Sonar offers an at-a-glance overview of cluster health with 20 essential metrics, and archives those metrics for postmortem retrieval and analysis. Sonar provides a transparent, no-code configuration solution to your Kafka cluster monitoring needs, all in Docker Desktop. It's as simple as entering your cluster information and clicking to connect.
Kafka Sonar is built with:
- Docker
- TypeScript
- React
- MUI
- React Router
- Vite
- Node.js
- Express.js
- Prometheus
- Grafana
- TimescaleDB
The cluster examples in the demo-clusters repo are built with the KafkaJS library.
Kafka Sonar consists of:
- A frontend UI which allows you to add cluster connections and monitor those connections using visualizations generated by Grafana and supported by Prometheus;
- A Node backend which handles API calls from the frontend UI, and a time-series database to store your cluster's metrics;
- And two backend containerized services custom-configured to your cluster which are spun up or down via the Docker Engine depending on Sonar's connection state:
- A Prometheus service to connect to your brokers' JMX-exposing ports and read metrics data, and
- A Grafana service to display that metrics data as embedded graphs on the frontend UI.
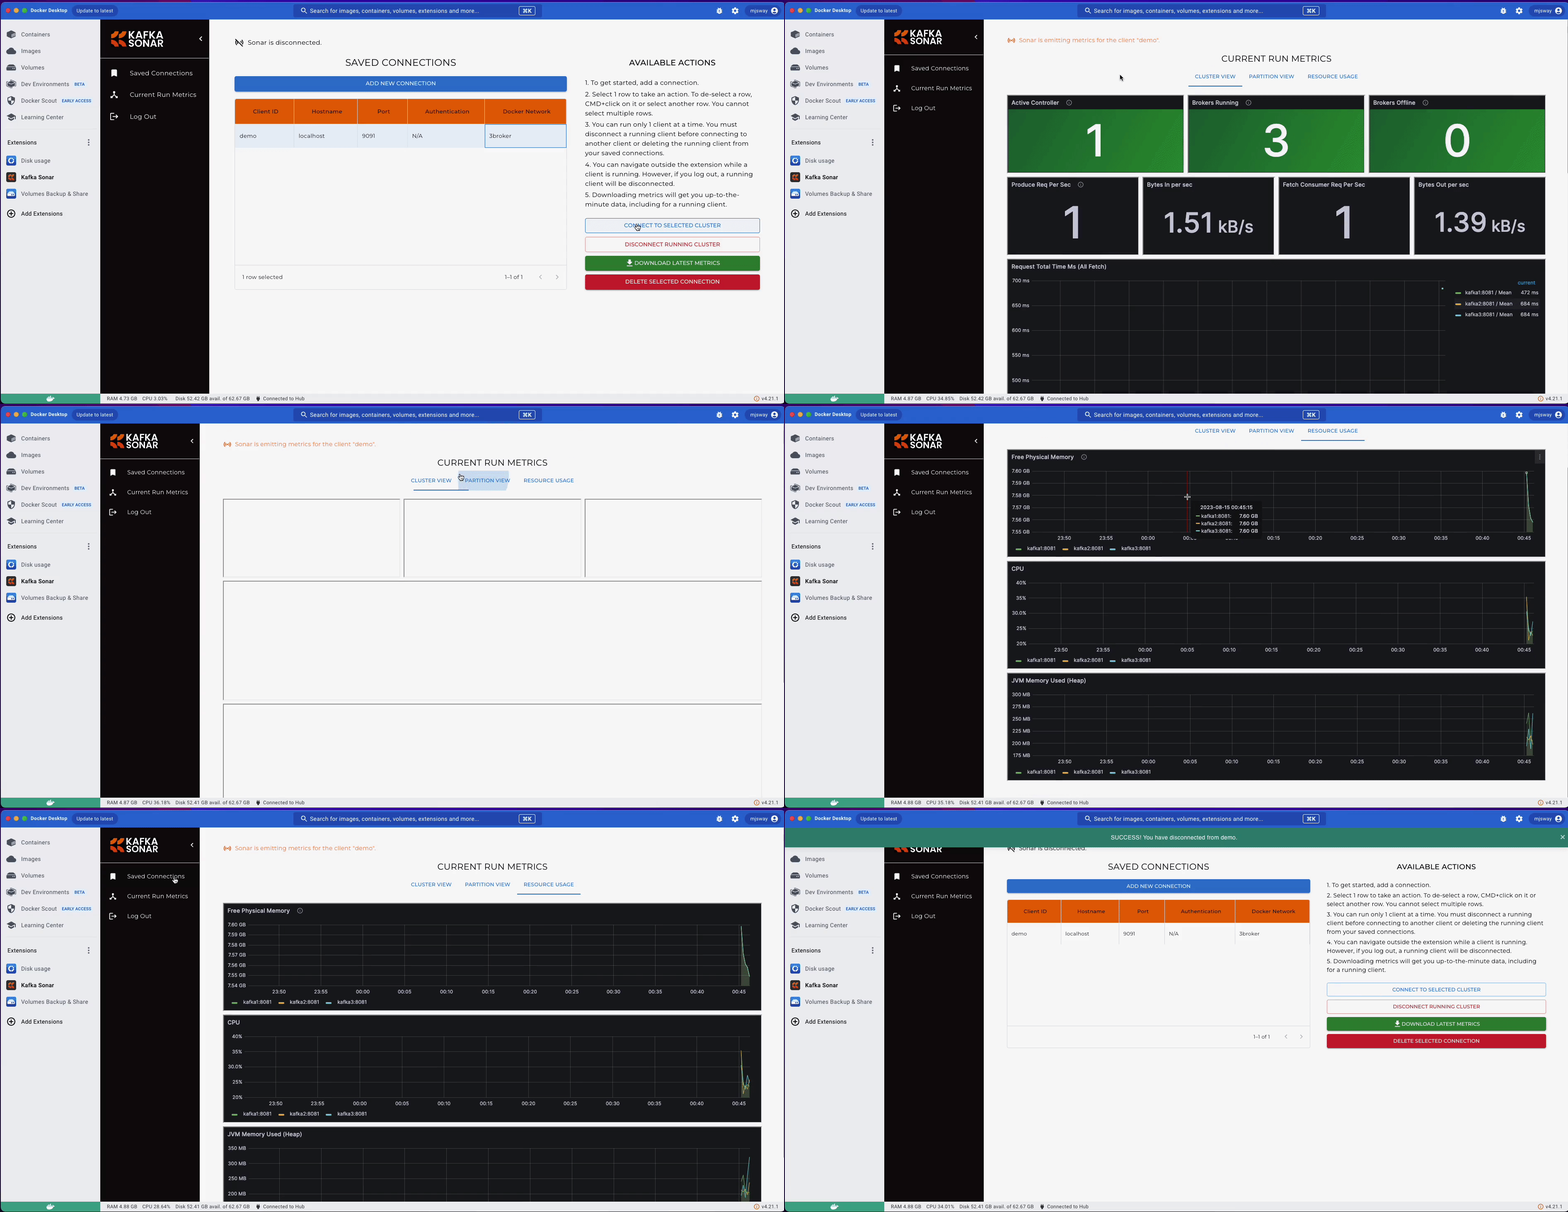
When you connect, Sonar spins up Prometheus and Grafana containers configured to your cluster (on ports 9090 and 3000, respectively) and manages their entire lifecycle for you. You can also download historical metrics data for your cluster as a .csv for analysis.
In order to use Kafka Sonar, you must have a containerized Kafka cluster set up to expose JMX data. Our recommendation to use Confluent's Kafka images with the KAFKA_OPTS environmental variable to run the Prometheus JMX Exporter as a Java agent. Your cluster must also be set up using a Docker bridge network to allow Sonar's custom Prometheus container to connect. See here for working examples.
Install the extension from Docker Desktop, or build it yourself by forking this repo, navigating to the root folder and running
make build-extensionand then
make install-extensionMake sure Docker Desktop is running to build it yourself.
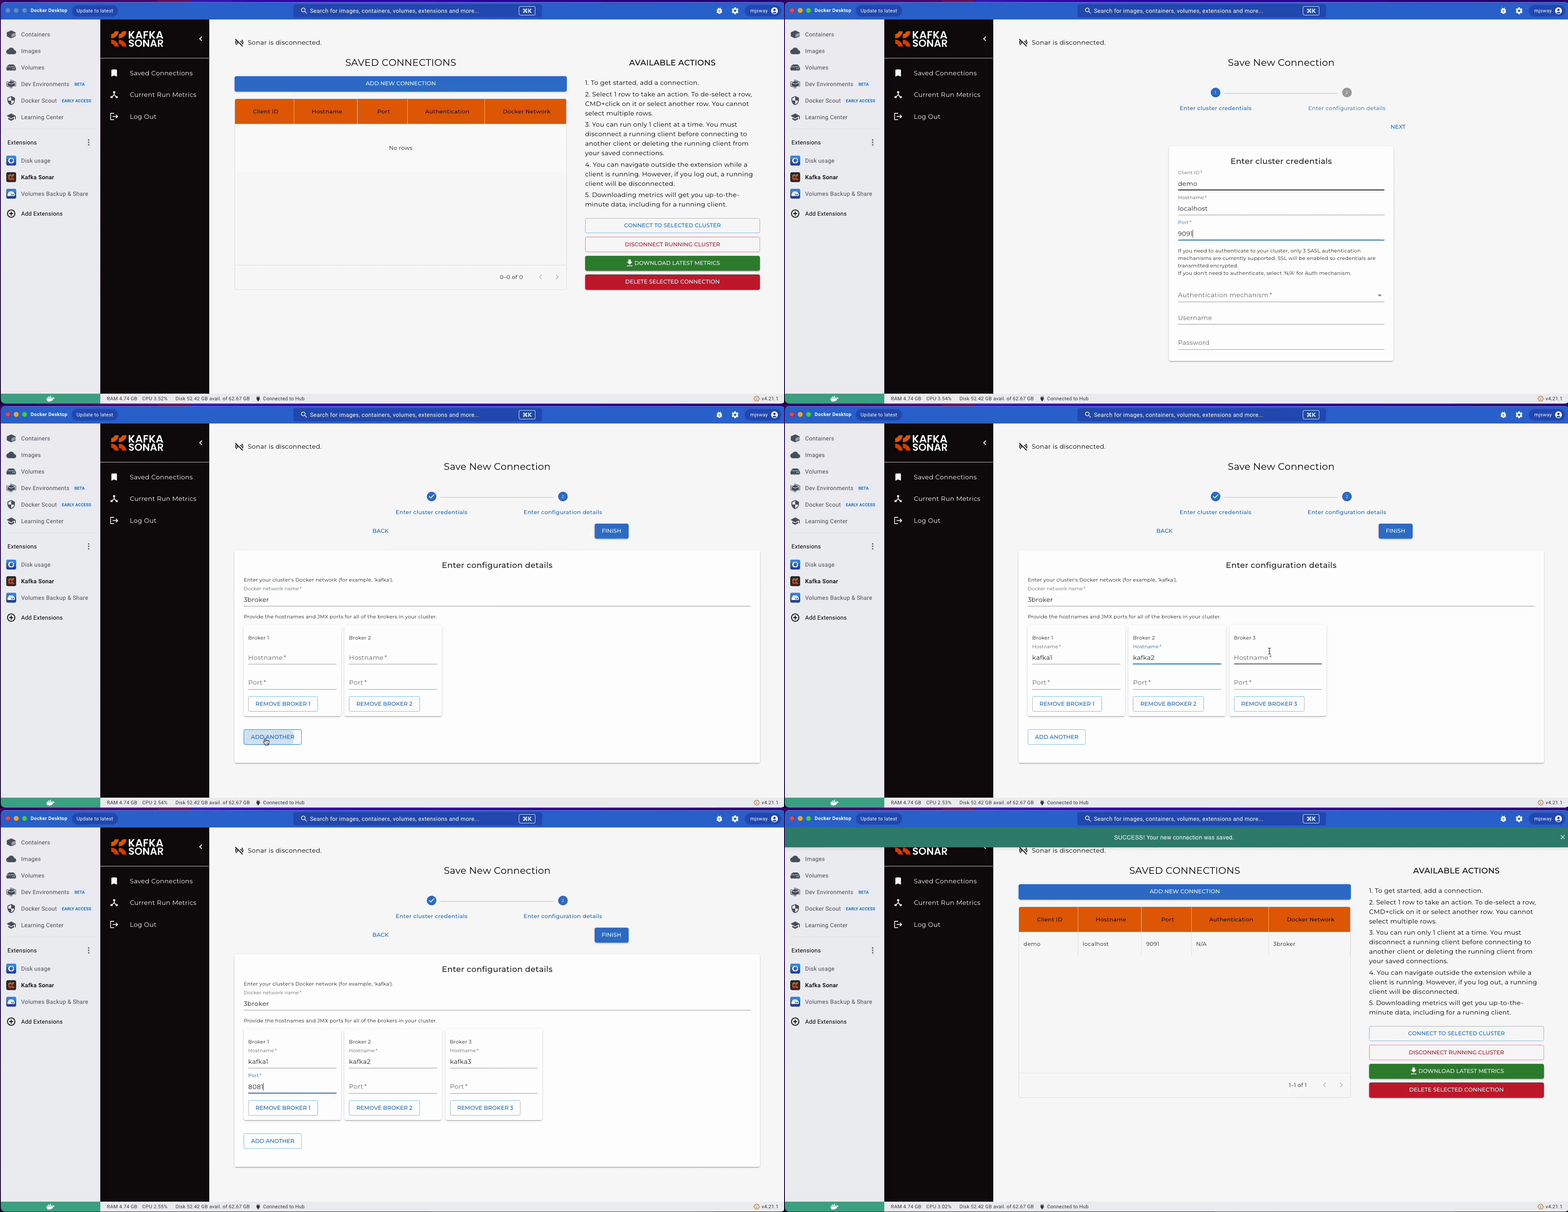
Once installed, navigate to the extension, create an account, and click Add A Connection. Enter your cluster's information to allow Sonar to connect and begin rendering metrics. It's that simple. Your cluster's configurations for Prometheus and Grafana are stored in a volume to facilitate rapid reconnection.
🔒 Your cluster's credentials and metrics are stored exclusively in a containerized database right on your own machine, giving you complete control over your data. Kafka Sonar does not externally transmit any of your sensitive data.
Some features the team is looking to implement in the future include:
- Rendering cluster metrics via a charting library rather than Grafana
- Include another UI to allow users to configure alerts when metrics rise above or drop below user-configured thresholds
- Utilize KafkaJS to add another tab in Current Run Metrics with a console view streaming real-time cluster errors
- Refactor FE to a more elegant state management solution (i.e. Redux, Recoil)
- Add E2E testing with Jest-puppeteer
- Implement CI workflow with GitHub Actions
- Add a PassportJS Google OAuth 2.0 login feature
- Grow the metrics dashboards with additional useful cluster metrics:
- Messages in per broker
- Bytes in per broker
- Bytes out per broker
- Messages in per topic
- Bytes in per topic
- Bytes out per topic
- Avg Replication Factor
- In-sync Replicas
- Out-of-sync Replicas
- Failed producer request rate OR failed req to server / sec
- Broker response rate OR res to consumers / sec
- Failed fetch request rate OR req to broker / sec
- Requests in-flight (awaiting responses)
- Time spend in Garbage Collection
- Michael Way | Github | Linkedin
- Steven Kim | Github | Linkedin
- Upasana Natarajan | Github | Linkedin
- Kareem Saleh | Github | Linkedin
We urge Kafka developers to utilize Sonar in their workflow and provide product feedback via Git issues. We encourage potential contributors to start with the our Roadmap above. Thank you in advance for your support!
This product is licensed under the MIT License without restriction.


